Selenium with Perl
Your guide to running Selenium Webdriver tests with Perl on BrowserStack.
Introduction
BrowserStack gives you instant access to our Selenium Grid of 3000+ real devices and desktop browsers. Running your Selenium tests with Perl on BrowserStack is simple. This guide will help you:
Prerequisites
Before you can start running your Selenium tests with Perl, ensure the Selenium::Remote::Driver library is installed. Following is the command to install Selenium from command line:
cpanm Selenium::Remote::Driver
Run your first test
To get started, let’s run a simple Selenium Webdriver test. The perl script below opens google.com, inputs a search string, submits the form, asserts the page title and marks the status of test as pass/fail based on the assertion.
Step 1 - Select the OS and device-browser combination
Select the OS and Device-Browser combination you’d like to test on using the drop-down menus below. This will automatically update the Perl code sample below:
If you have not created an account yet, you can sign up for a Free Trial or purchase a plan.
driver.quit() statement is required, otherwise the test continues to execute, leading to a timeout.
Step 2 - Run the sample test code
Copy the code sample into your code editor, save it as sample-test.pl file, and execute the test from your command line.
perl sample-test.pl
Step 3 - Verify the results
Once the test has run successfully, it is time to verify the results. The Selenium Webdriver test should have opened a URL, inputted a string, submitted the form, returned the page title and marked the test based on the title.
Mark tests as passed or failed
BrowserStack does not know whether your test’s assertions have passed or failed because only the test script knows whether the assertions have passed. Therefore, based on the assertions on your script, you have to explicitly inform BrowserStack whether your tests have passed or not and this document will help you in doing that exactly.
It is possible to mark tests as either a pass or a fail and also give a reason for the same, using the following snippet (Refer the above sample script which implements the snippet shown below):
# for marking the test as passed
$driver->execute_script('browserstack_executor: {"action": "setSessionStatus", "arguments": {"status":"passed", "reason": "Yaay! My test has passed"}}');

#for marking the test as failed
$driver->execute_script('browserstack_executor: {"action": "setSessionStatus", "arguments": {"status":"failed", "reason": "Oops! My test has failed"}}');
status and reason.
-
statusaccepts eitherpassedorfailedas the value -
reasonaccepts a value in string datatype
Marking test as pass/fail is also possible using our REST API at any point in the test or also after the test has concluded. You can read more about marking test using REST API and use it if it fits your use case.
Debug your app
BrowserStack provides a range of debugging tools to help you quickly identify and fix bugs you discover through your automated tests.
Text logs
Text Logs are a comprehensive record of your test. They are used to identify all the steps executed in the test and troubleshoot errors for the failed step. Text Logs are accessible from the Automate dashboard or via our REST API.
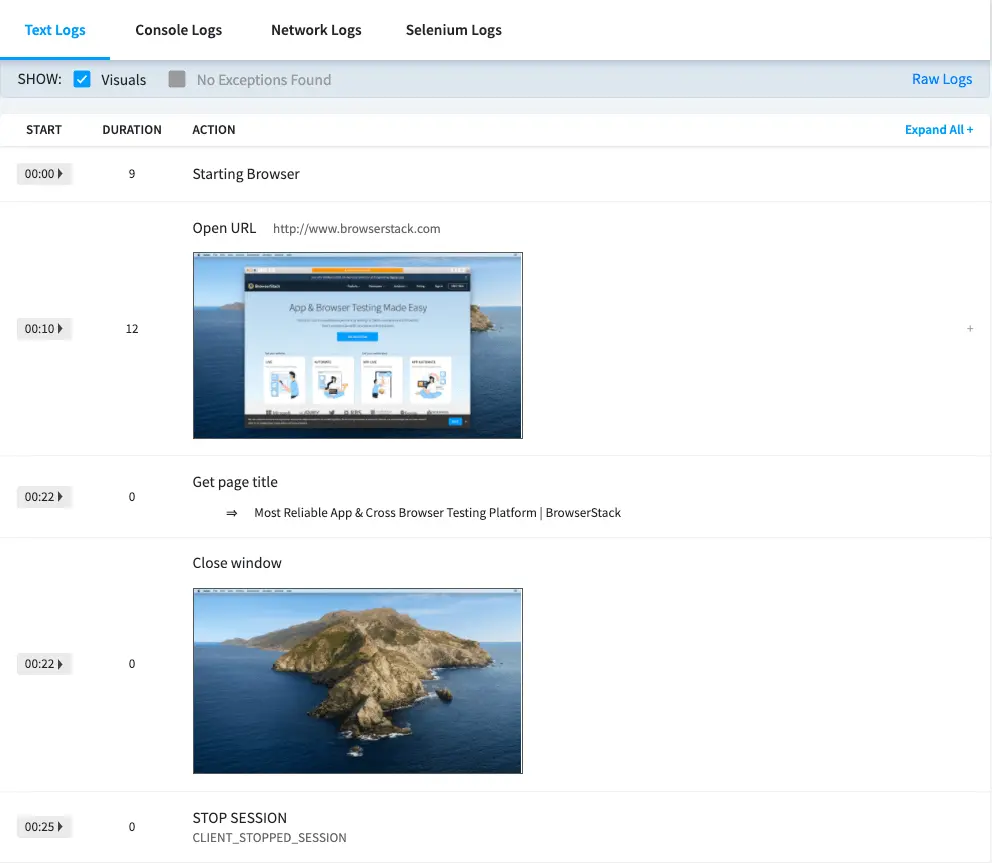
Visual logs
Visual Logs automatically capture the screenshots generated at every Selenium command run through your Perl script. Visual logs help with debugging the exact step and the page where failure occurred. They also help identify any layout or design related issues with your web pages on different browsers.
Visual Logs are disabled by default. In order to enable Visual Logs you will need to set browserstack.debug capability to true:
$extraCaps->{"browserstack.debug"} = "true";
Sample Visual Logs from Automate Dashboard:
Video recording
Every test run on the BrowserStack Selenium grid is recorded exactly as it is executed on our remote machine. This feature is particularly helpful whenever a browser test fails. You can access videos from Automate Dashboard for each session. You can also download the videos from the Dashboard or retrieve a link to download the video using our REST API.
browserstack.video capability to false.
In addition to these logs BrowserStack also provides Raw logs, Network logs, Console logs, Selenium logs, Appium logs and Interactive session. You can find the complete details to enable all the debugging options.
Next steps
Once you have successfully run your first test on BrowserStack, you might want to do one of the following:
- Migrate existing tests to BrowserStack
- Run multiple tests in parallel to speed up the build execution
- Test on private websites that are hosted on your internal networks
- Select browsers and devices where you want to test
- Set up your CI/CD: Jenkins, Bamboo, TeamCity, Azure, CircleCI, BitBucket, TravisCI, GitHub Actions
We're sorry to hear that. Please share your feedback so we can do better
Contact our Support team for immediate help while we work on improving our docs.
We're continuously improving our docs. We'd love to know what you liked
- RESOURCES

Is this page helping you?
 Yes
No
Yes
No
We're sorry to hear that. Please share your feedback so we can do better
Contact our Support team for immediate help while we work on improving our docs.
We're continuously improving our docs. We'd love to know what you liked
Thank you for your valuable feedback!