We’re excited to announce that BrowserStack Test Observability is now in General Availability (GA).
What does GA of Test Observability mean for you?
In early 2023, we announced Test Observability in Public Beta. Now, the General Availability of Test Observability means a much more functionality-rich offering with support for the most popular test frameworks such as WebdriverIO, Cypress & Playwright, custom rules to detect flaky tests, configurable alerts, drill-downable charts, and more.
Why Test Observability?
Test Observability is useful IF:
🔥 You’re spending many engineering-hours in analyzing test reports, filtering out flaky tests, and debugging test failures.
🔥 You’re getting less time to write new test cases because of bandwidth spent on run verification.
🔥 You’re considering expanding your QE team to avoid release delays because of run verification.
🔥 You’re worried about bugs creeping into production despite verifying and reverifying your runs.
What about test reporting tools?
Test reporters that do exactly what they say - reporting - they collate test results in a report.
After that, you are supposed to analyze those results, debug failures, and report bugs.
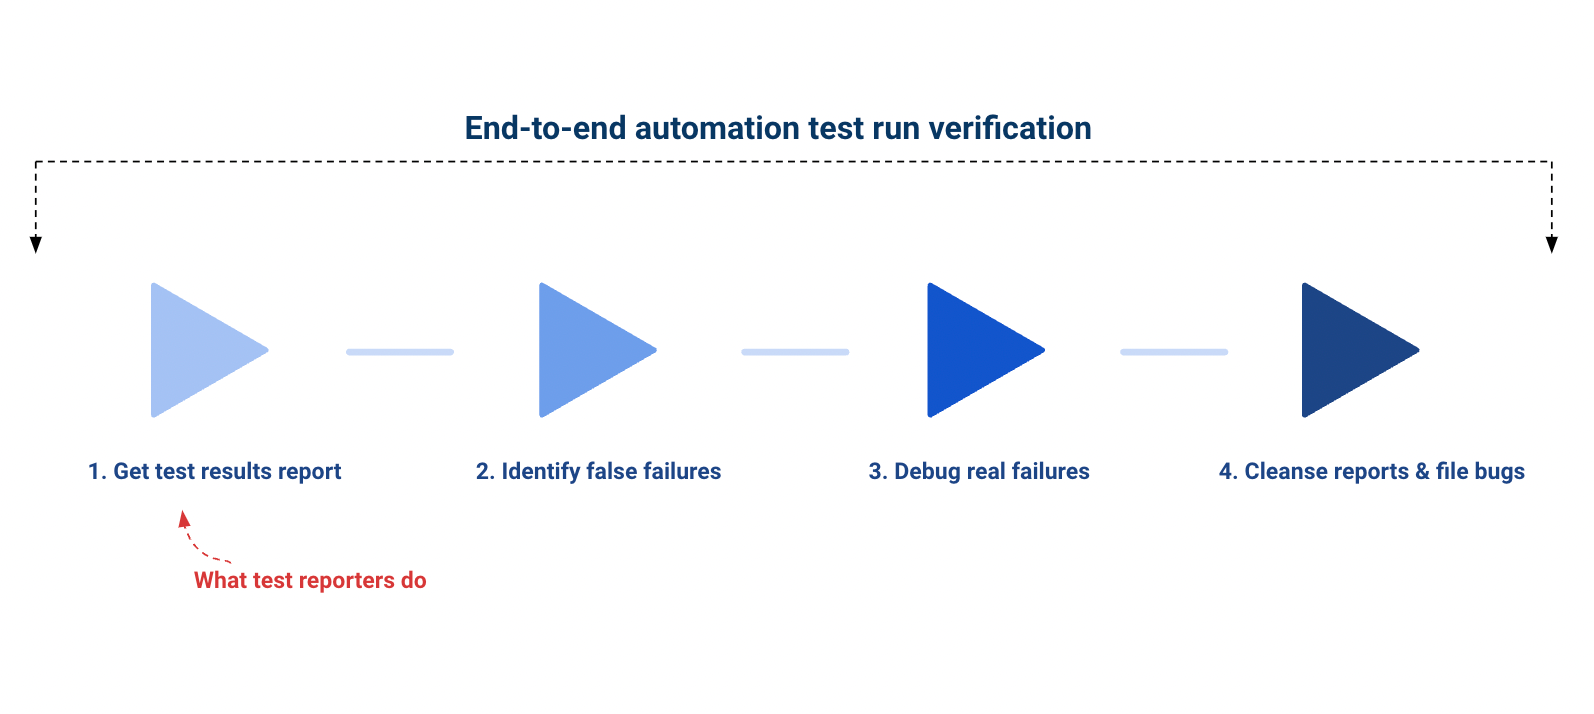
Using test reporters for run verification works until you don’t adopt CI, and when you release less frequently than once a month.
As soon as you’re merging code more often, and aspiring to release more often, manual verification of automation test runs—from identifying flaky failures to debugging real ones, reporting and tracking them— for every merge is beyond difficult. 🥵
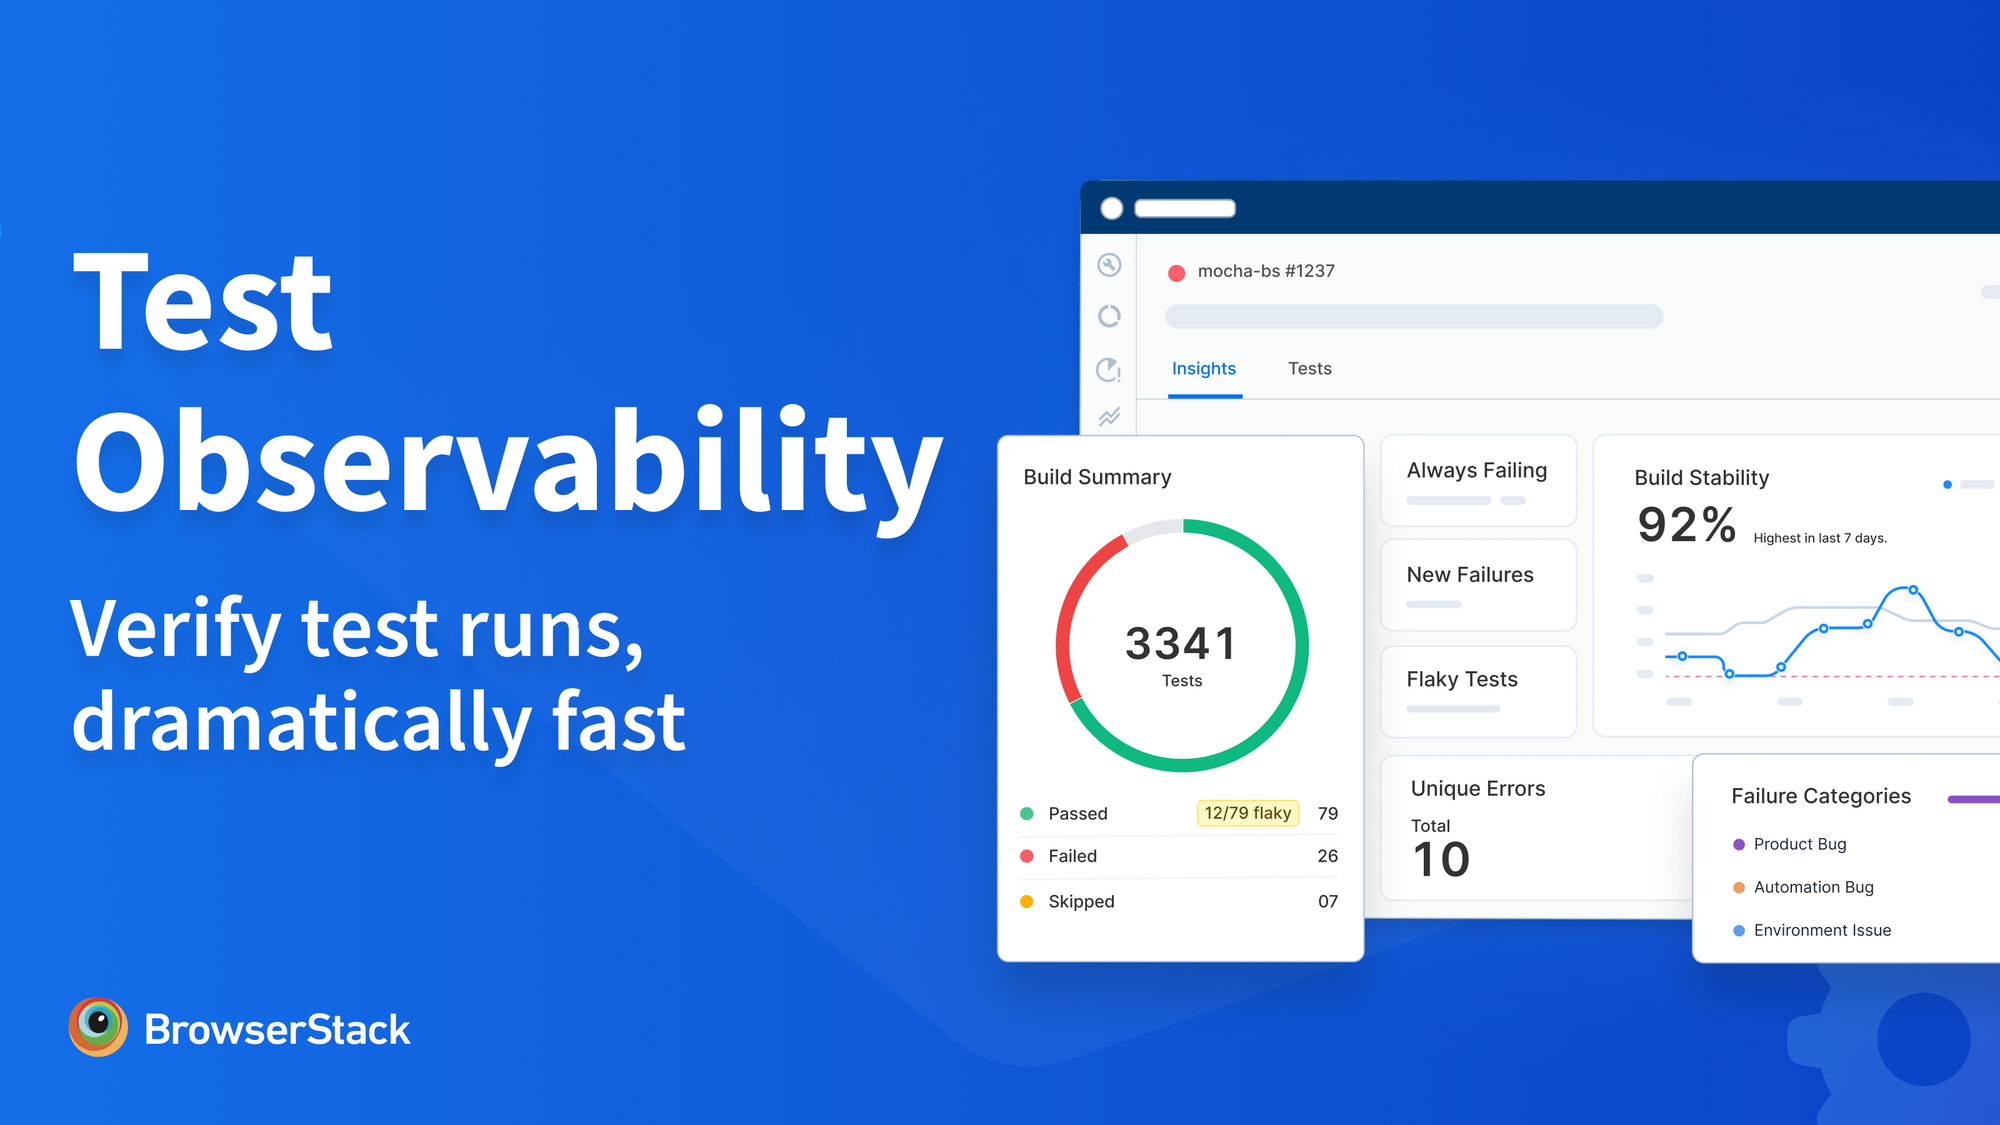
That’s why we built Test Observability
Test Observability automatically collects, connects, and comprehends test result data to drastically speed up the end-to-end run verification process - from analysis to debugging, and reporting, and even enables real-time monitoring, and trend analysis of QE metrics.
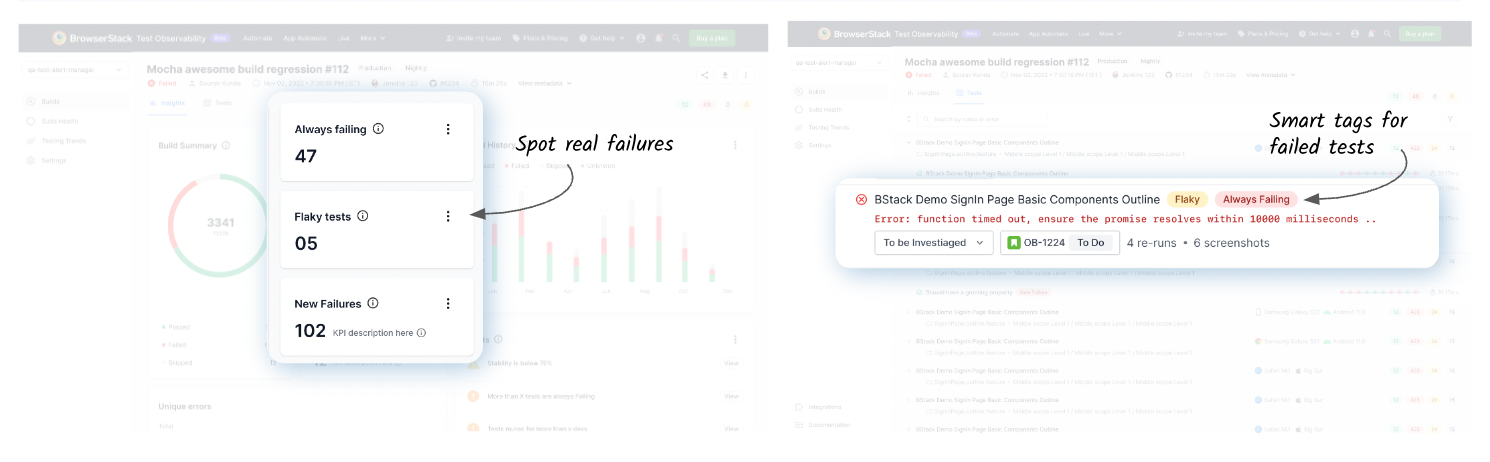
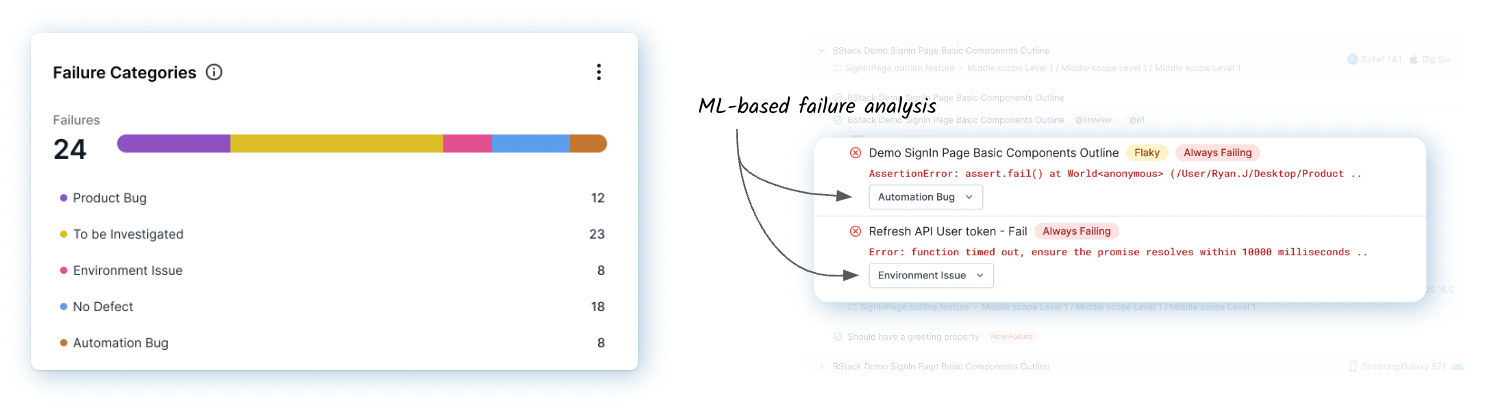
Identify genuine test failures
With Test Observability you can quickly jump to critical test failures with:
- Automatic categorization of failures into
flaky,always failing,new failures, oranomaliesto instantly separate false failures from real ones. - ML-based failure reason categorization into
Product bug,Automation issue,environment issue, and more for faster root cause analysis. - Unique errors analysis that groups tests that fail with the same error so you can prioritize the highest impacting errors.
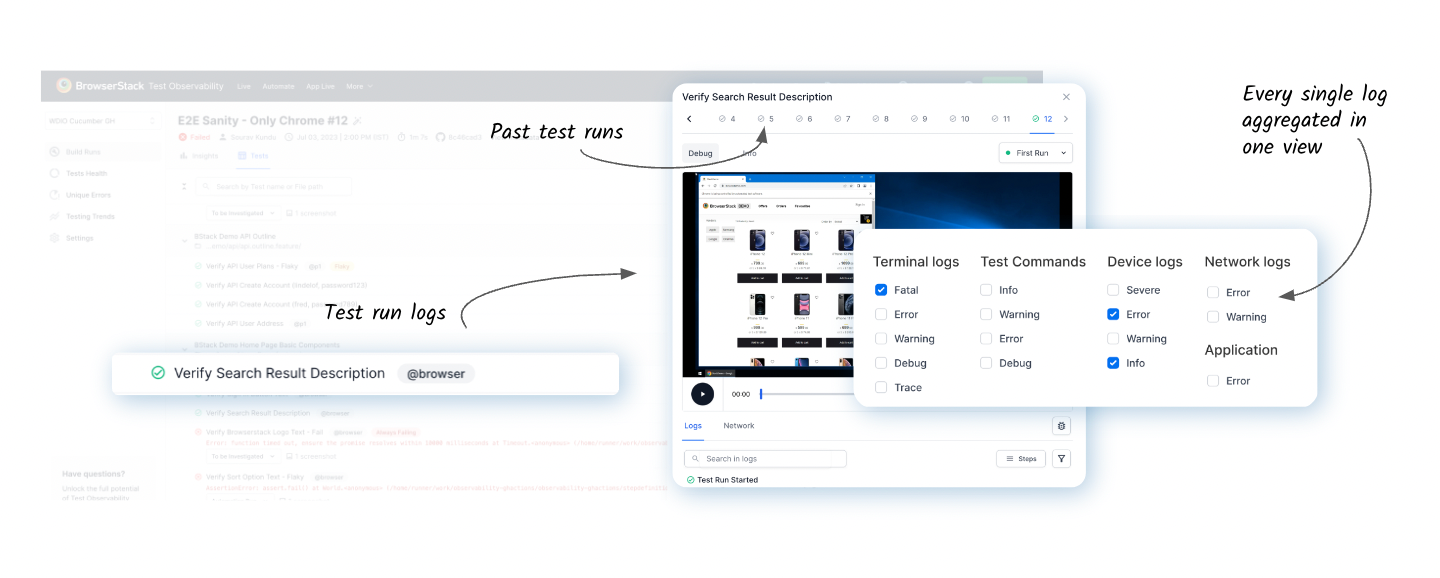
Debug fast without a context switch
Test Observability brings to you a saner way of debugging tests with:
- Log aggregation so you get access to e$very possible log from video recording and screenshots to terminal, network, and JS console logs to device/browser, test framework, and even application logs in a single place.
- Timeline debugging that chronologically organizes logs of every test from across sources so you can instantly correlate a failure with an error logged by any of the aggregated log sources in the same view. Troubleshoot without context switch.
- Time-travel debugging so you can go back in time to analyze logs from a previous run to debug at the source of an issue.
End-to-end run verification flows
Conclude your test run verification with clean and intuitive reporting workflows, such as:
- Muting tests with known issues to keep reports noise-free.
- Filing defects on Jira with prefilled context, and avoiding creating duplicate issues with automatic tagging of tests that have Jira issues open against them.
- Getting one consolidated build report across reruns that represent the latest status of each test.
🎈 Test Observability
- Is agnostic to your test platform: Works regardless of if the tests are run on BrowserStack or in-house infra or on a laptop.
- Supports all test types: Be it unit test, integration test, API test, web tests, anything.
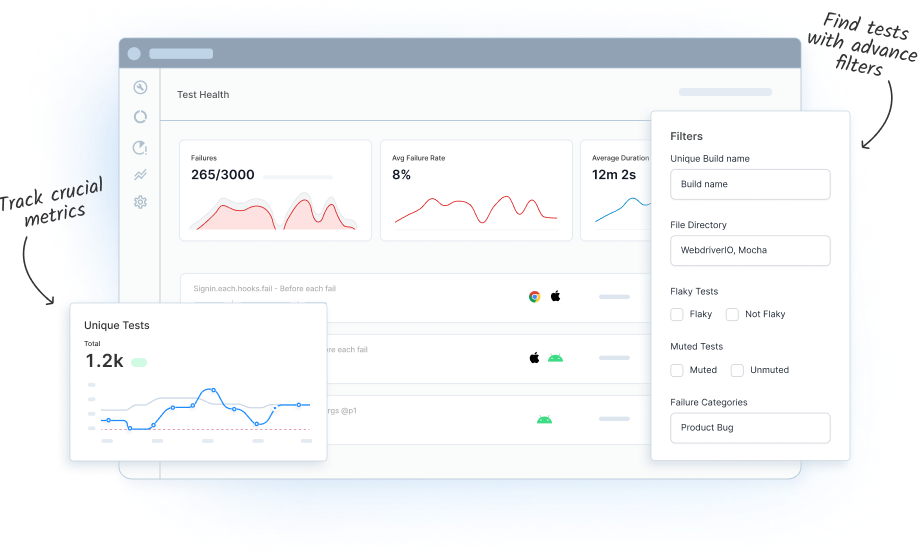
Metrics & monitoring
Using Test Observability, you will always be in the know of your test suite health with:
- Built-in QA metrics like build stability, flakiness, and more, are already calculated for you so you don’t need to pull your hair with Excel.
- Custom alerts that you can configure on any metric such as pass percentage, flakiness percentage, build run time, number of muted days, etc.
- Notifications to pipe alerts to wherever you work - Slack, MS Teams, or email.
Test Observability: Single tool for end-to-end run verification
With the ability to quickly spot critical failures, debug them with full context and monitor relevant QA metrics on the same dashboard, you can:
- Decrease deployment cycle time: Drastically reduce the man hours spent on run verification, saving cost
- Make your test suite more reliable: Take data-driven prioritization about fixing bad tests
Online sandbox
The easiest way to try Test Observability is to play around with its online sandbox.
Or integrate in 2 mins
If you prefer ingesting your data and seeing your own insights, integrate with the SDK in just 2 mins:
- Log into Test Observability
- Select your test framework to get started.
- Set up the config file
- Run your tests as usual and your test data will automatically start getting sent to Test Observability
Post the build run completion, navigate to your Test Observability dashboard to start analyzing your test results now.
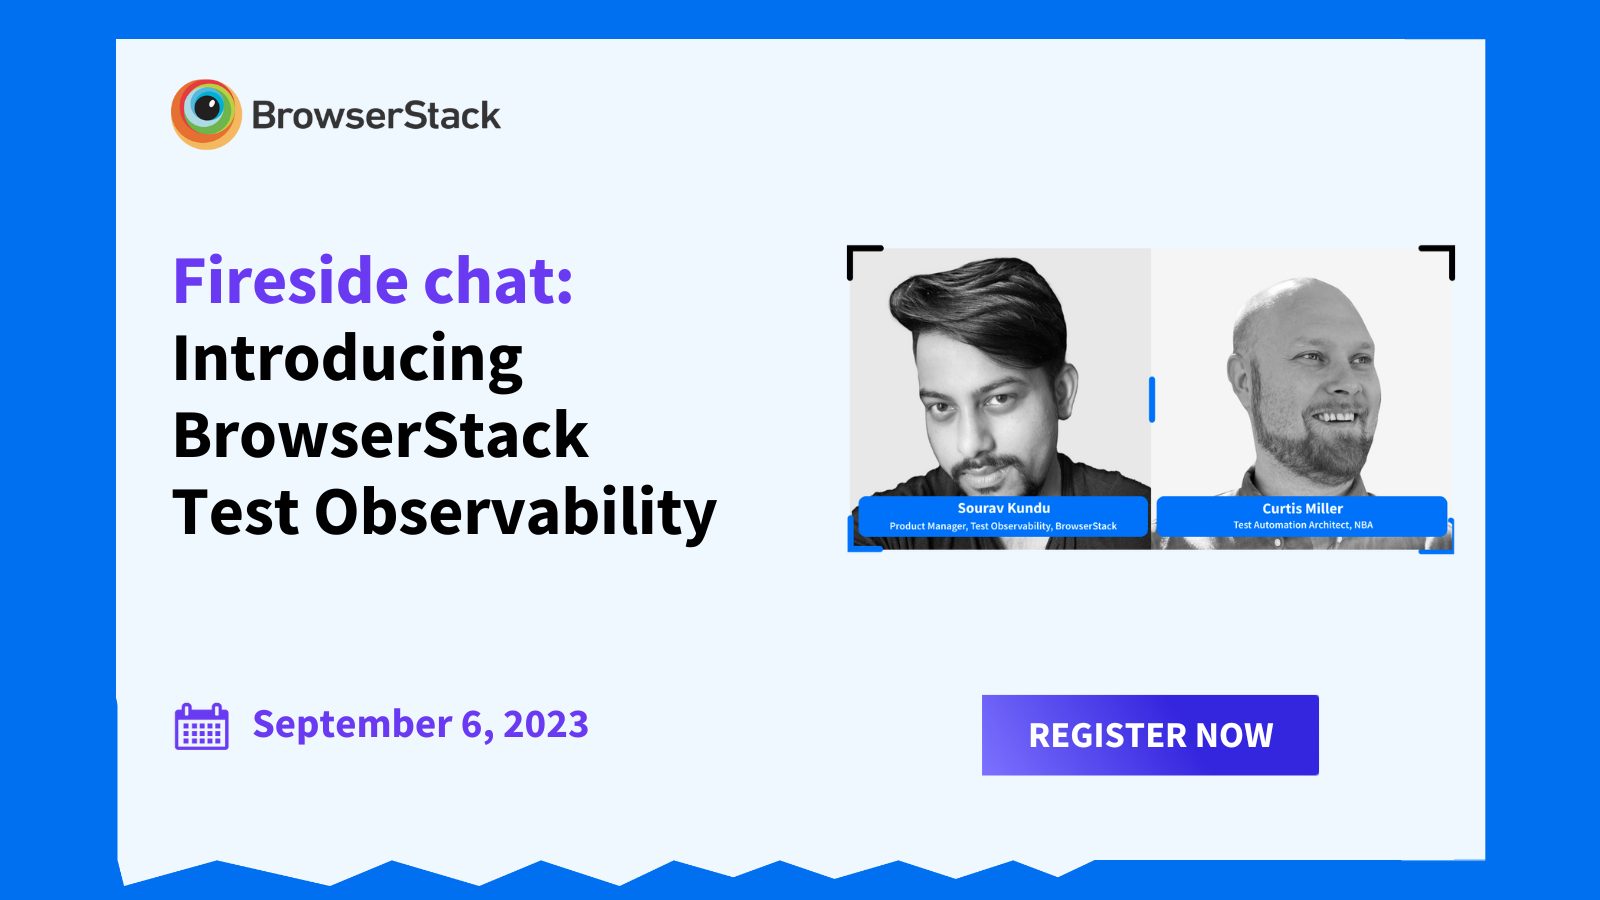
Join the launch webinar to hear from real users of Test Observability
Join the exclusive webinar where experts talk about how National Basketball Association (NBA) has made BrowserStack Test Observability a part of their daily automation run verification routine.