Aggregated Summary
This widget helps you summarize the dashboard by pinning the key takeaways for a team or module the dashboard is created for. It helps you create a concise summary banner in which you can include the most valuable insights about selected projects and builds. You can include information like Tests Summary, Failure Rate, Failure Count, Stability, Flakiness, Muted Tests, New Failures, Always Failing, Defect Summary, Platforms Covered, and Unit Test Cases.
You can use the Aggregated Summary widget as an indicator of the Key Performance Indicators you want to track on your projects and builds.
Drill down for more information
You can investigate more contextual information on all dashboard widgets using the drill-down feature.
You can use the drill-down feature in the Aggregated Summary widget to analyze more information on the insights. For example, if you want to investigate why a particular indicater, like failure rate, is high, you can click it and discover more details.
Follow these steps to use the drill-down feature:
- Click any insight on the Aggregated Summary widget. A project-wise breakdown of the metrics related to the insight for the selected date range opens up in a side pane.

- If the option is present, click View tests to get to the tests that contribute to the insight.
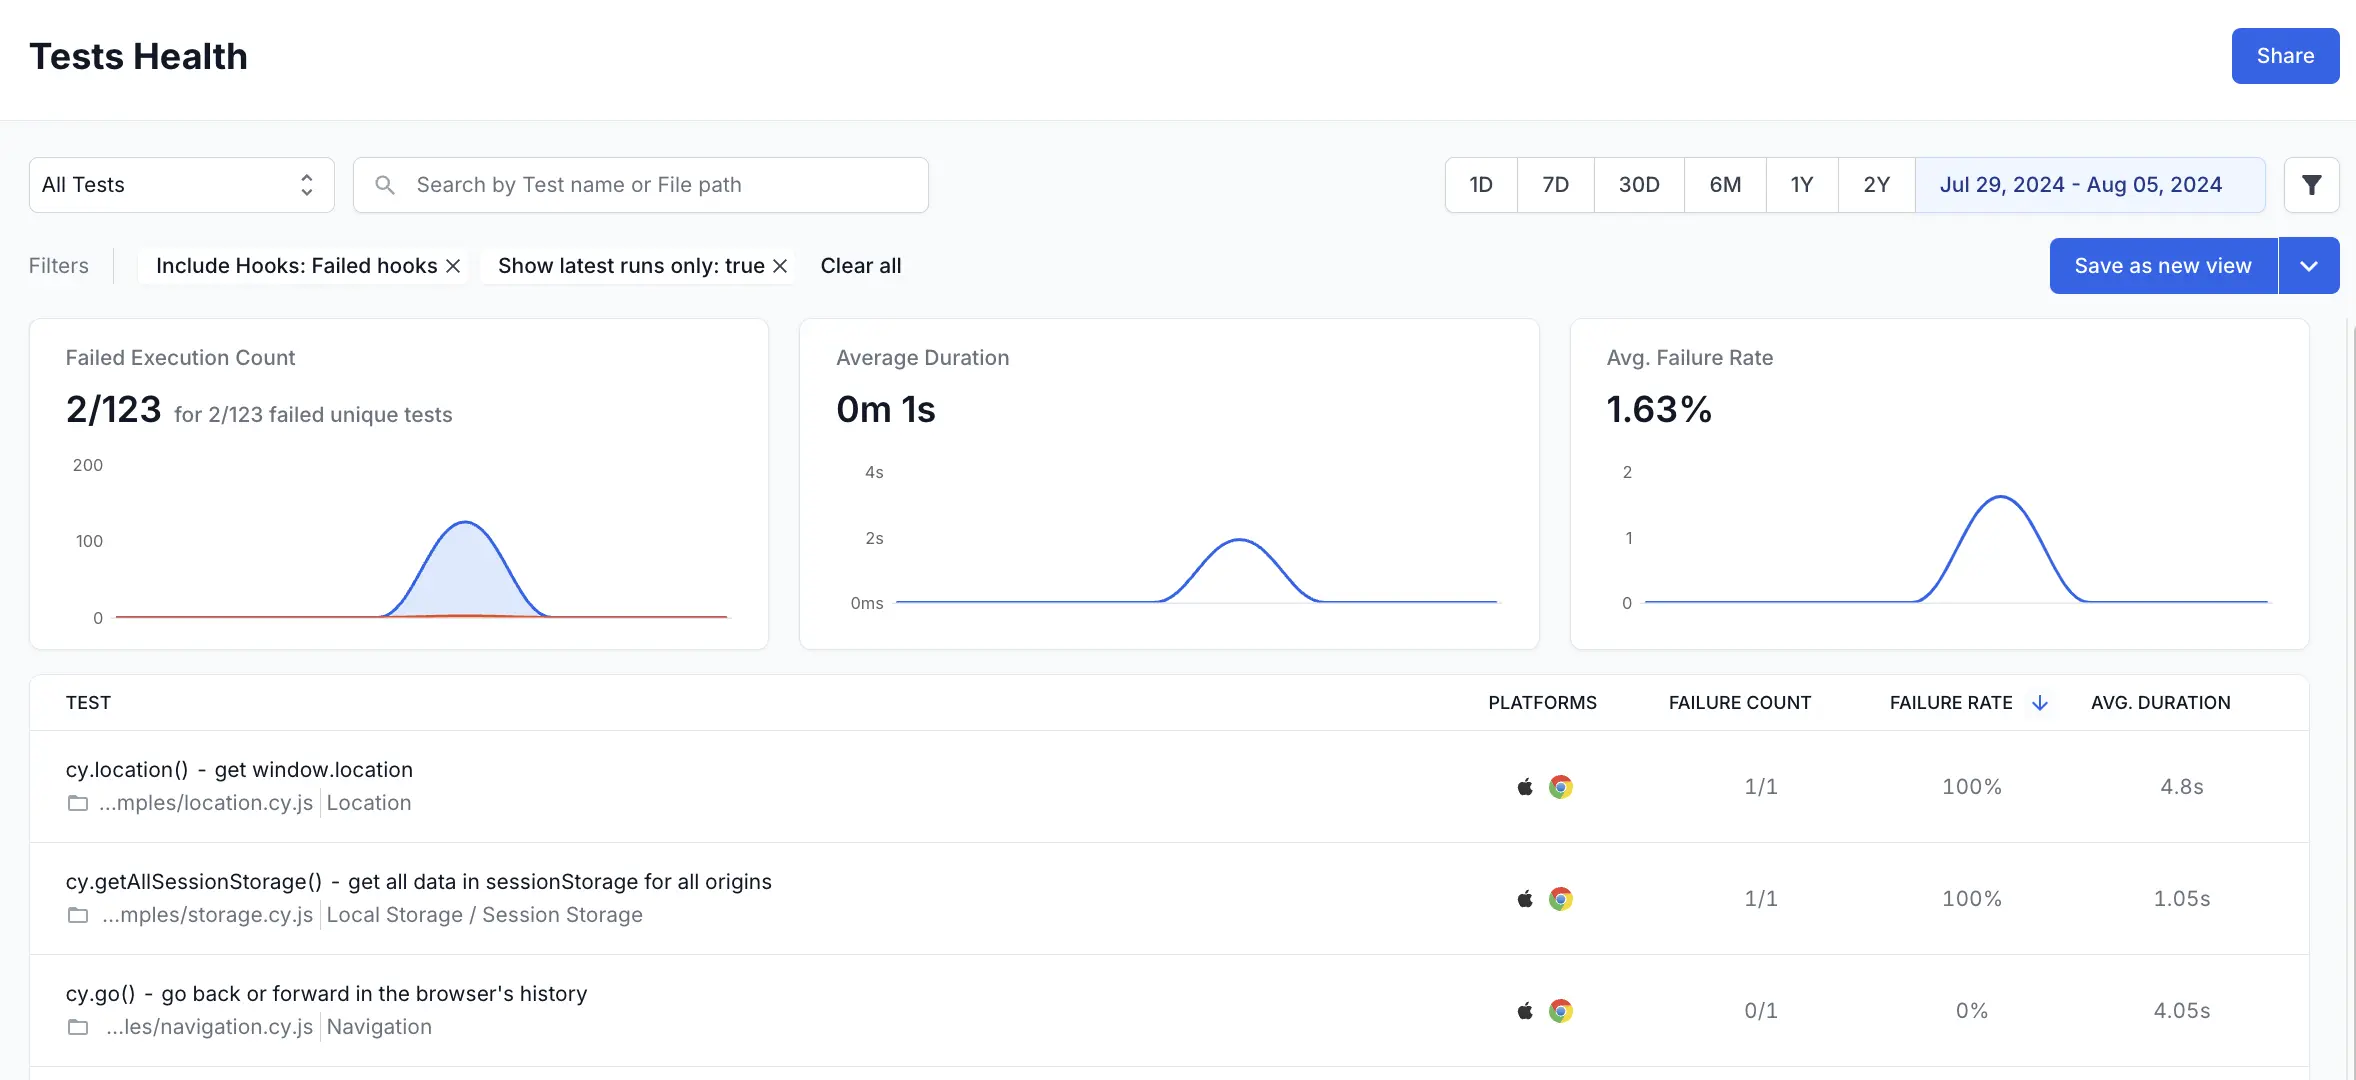
This opens Tests Health in a new tab with the applicable filters. On Tests Health, you can view the individual tests that contributed to the insight to investigate further.
We're sorry to hear that. Please share your feedback so we can do better
Contact our Support team for immediate help while we work on improving our docs.
We're continuously improving our docs. We'd love to know what you liked
We're sorry to hear that. Please share your feedback so we can do better
Contact our Support team for immediate help while we work on improving our docs.
We're continuously improving our docs. We'd love to know what you liked
Thank you for your valuable feedback!