Build Performance widget in custom dashboards
Monitor the build times of your test setup over time along with the number of test executions.
This widget helps you understand if the performance of your test setup is improving or worsening over time, enabling you to uncover bottlenecks in your testing.
The build performance widget illustrates the trend of average build duration, along with the trend of the number of test executions. A bar chart represents the build duration whereas a line chart indicates the test executions. If the average duration trends downwards, even when the test executions haven’t reduced, it indicates that the build performance is improving.
Here, the X-axis represents time and the Y-axis represents the number of test executions and the average duration. Each line is a different segment that you can configure to compare different projects, builds, users, etc.
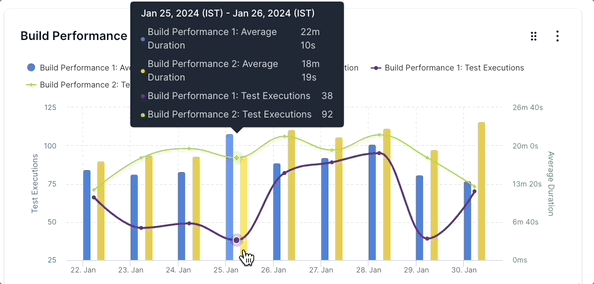
In the sample above, there are two segments: Build Performance 1 (purple line and blue bar chart) and Build Performance 2 (green line and yellow bar chart). The average duration of Build Performance 1 decreases from 22m 10s on 25th January to 20m 6s on 28th January even when the number of test executions shot up from 38 to 95. This drop in average duration even when the test executions increased is a sign that the build performance improved in this period.
Meanwhile, the average duration of Build Performance 2 increased from 18m 19s on 25th January to 23m 6s on 28th January when the number of test executions increased from 92 to 107. This cannot be considered a drop in performance as the higher duration is justified by the increase in the number of test executions.
Widget configuration - Build Performance
You can configure the following options in the Build Performance widget:
-
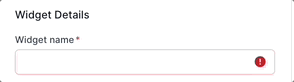
Widget name: A suitable name to easily identify the purpose of the widget.
-
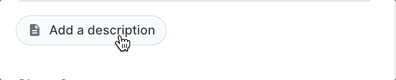
Description: An optional widget description to explain the purpose in detail. A user can view this description by hovering over an info icon on the widget and gain valuable context about the widget.
-
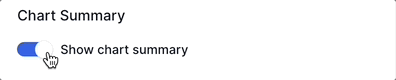
Chart Summary: A toggle to show or hide the chart summary, a concise banner that displays summarized information on your build performance widget. By default, the build performance widget prominently displays Average Build Duration as the chart summary. You can choose to show or hide this chart summary. Chart summary is available only on widgets with a single segment.
-
Segments: Add up to five segments in the build performance widget using the Add segment option. A new line chart and a bar chart get added to the widget when you add a new segment. Segments should be used along with filters. You can use various filters in each segment to compare different projects, builds, users, etc.

-
Filter: You can add a filter to include only the data you want in a particular segment. The parameters by which you can filter data are Projects, Unique Build Names, Users, Build Tags, and Host Names.
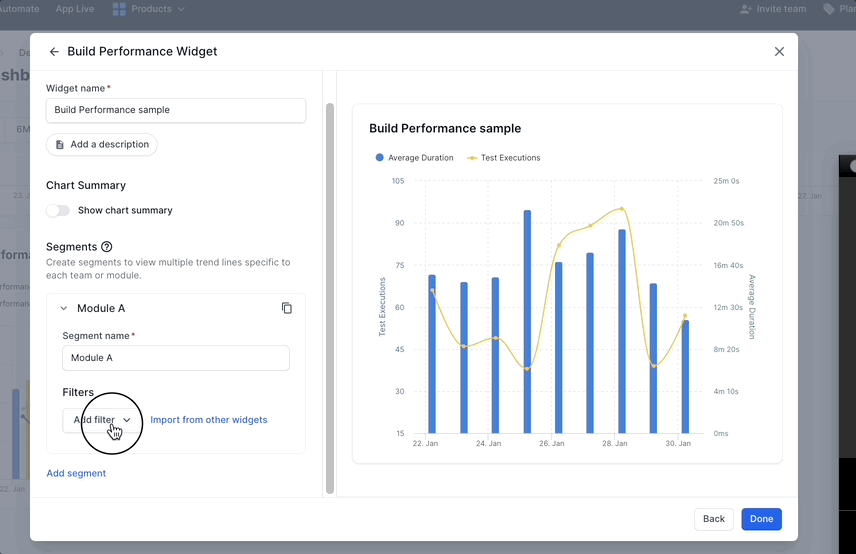
You can also import filters from other widgets to avoid duplicate efforts.
Sample use cases
You can use the build performance widget to track and compare the performance of several aspects of your testing organization. Here are a few sample use cases to get you started:
Analyze module-wise and team-wise build performance
You can configure separate segments for different modules or teams in your test suites. You can use segments in combination with the following filters to identify modules and teams:
- Unique build names filter to identify build names that belong to a particular module or team.
- Users filter to differentiate between team members who triggered the build.
- Build tags and Host names that represent team or module information.
Consider the following example in which the performance of builds in three modules is compared.
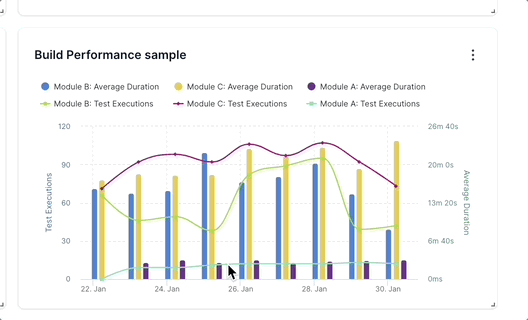
Here, the three sets of line charts and bar charts represent Module A (dark green line and purple bars), Module B (light green line and blue bars), and Module C (pink lines and yellow bars) in a test suite. Such a graph can quickly tell you that Module A has been stable in terms of build performance with very little variation in the average duration or the number of test executions.
Module B is improving in build performance from Jan 25th to Jan 28th, as the average duration decreased even when there was an increase in the number of test executions.
Although the average duration in Module C increases from Jan 25th to Jan 28th, this increase in duration is proportional to the increase in the number of test executions.
Using this insight, you can focus on Module B, discover the best practices followed, and implement them in other modules to improve their build performances.
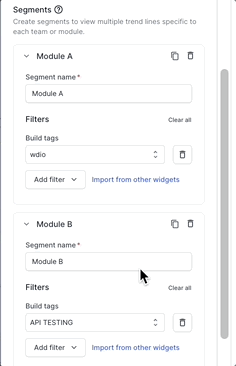
To create the above widget, in the following sample configuration, different Build tags are configured on each of the three segments that define Module A, Module B, and Module C.
Analyze project-wise build performance
You can measure the build performance across multiple projects using the build performance widget. This can be achieved by configuring separate segments for each of the projects that you want to track.
In the following example, the build performance of tests under three projects is compared.
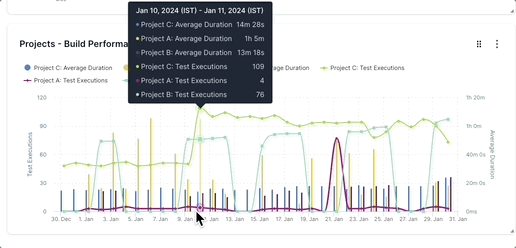
Here, the three sets of line charts and bar charts represent the performance of builds of Project A (pink line and yellow bars), Project B (dark green line and purple bars), and Project C (light green line and blue bars). This graph informs you that the builds in Project A display an inconsistent performance even when the number of test executions remains constant. Also, it shows that the build times in Project B are closely related to the number of test executions. In contrast, the build times in Project C don’t change much even when the number of test executions increases.
We're sorry to hear that. Please share your feedback so we can do better
Contact our Support team for immediate help while we work on improving our docs.
We're continuously improving our docs. We'd love to know what you liked
Is this page helping you?
 Yes
No
Yes
No
We're sorry to hear that. Please share your feedback so we can do better
Contact our Support team for immediate help while we work on improving our docs.
We're continuously improving our docs. We'd love to know what you liked
Thank you for your valuable feedback!