Build Insights
Discover meaningful insights on your build runs and the tests associated with them.
Build Insights is the one-stop place to analyze and debug your builds. You can view comprehensive information on your builds and investigate more information on your build runs from this interactive console.
Navigate to Build Insights
When you click any build run in Build Runs, Build Insights opens up, with a host of useful information about the build. You can also access Build Insights by clicking a build from the recent builds in Testing Trends.
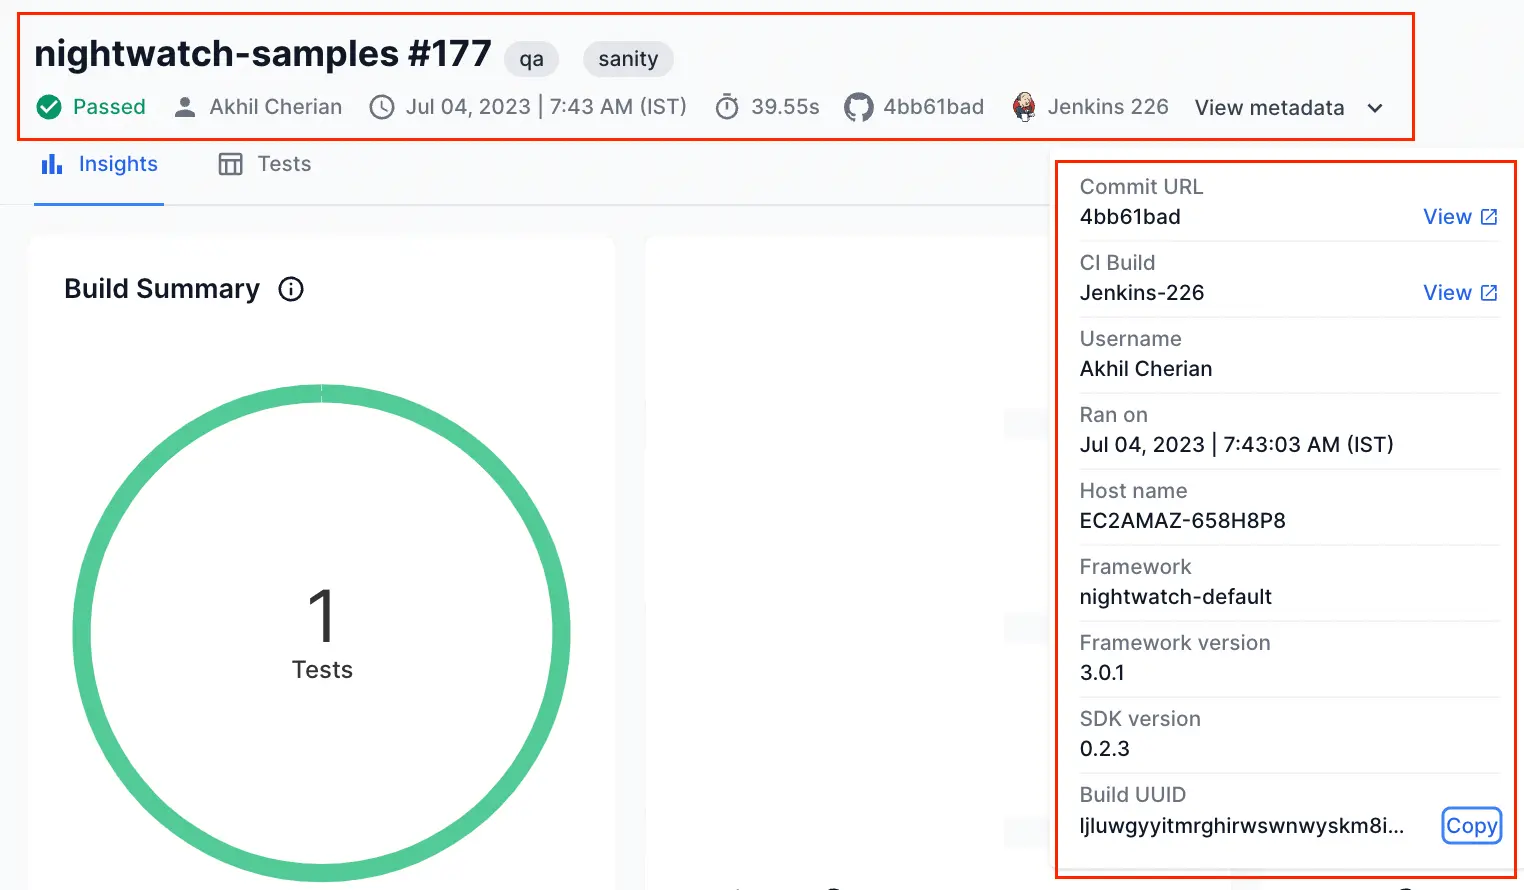
Build Metadata
Build Insights presents the following metadata about the selected build run:
- Build Name: Name of the build.
- Build Number: ID of the specific build run.
- Custom Build Tags: Tags that you can associate with a build.
-
Build Status: The status of the build that denotes whether the build
passed,failed, or wasskipped. - User: Specifies the name of the user who triggered the build.
- Start time: The timestamp at which the build was triggered.
- Duration: The duration for which the build ran.
- Commit ID: The Git commit ID associated with the build. You can click the commit ID to view the commit on supported SCM tools like GitHub and GitLab. Support for more SCMs is coming soon.
- CI Job name: You can click the CI job name to view the job in your CI tool that triggered the build.
- Host name: The host system from which the build was triggered.
- Framework: The test framework of your build.
- Framework Version: The version number of the test framework of your build.
- SDK Version: The BrowserStack SDK version you use in your build.
- Build UUID: The unique ID of the build run.
Insights tab
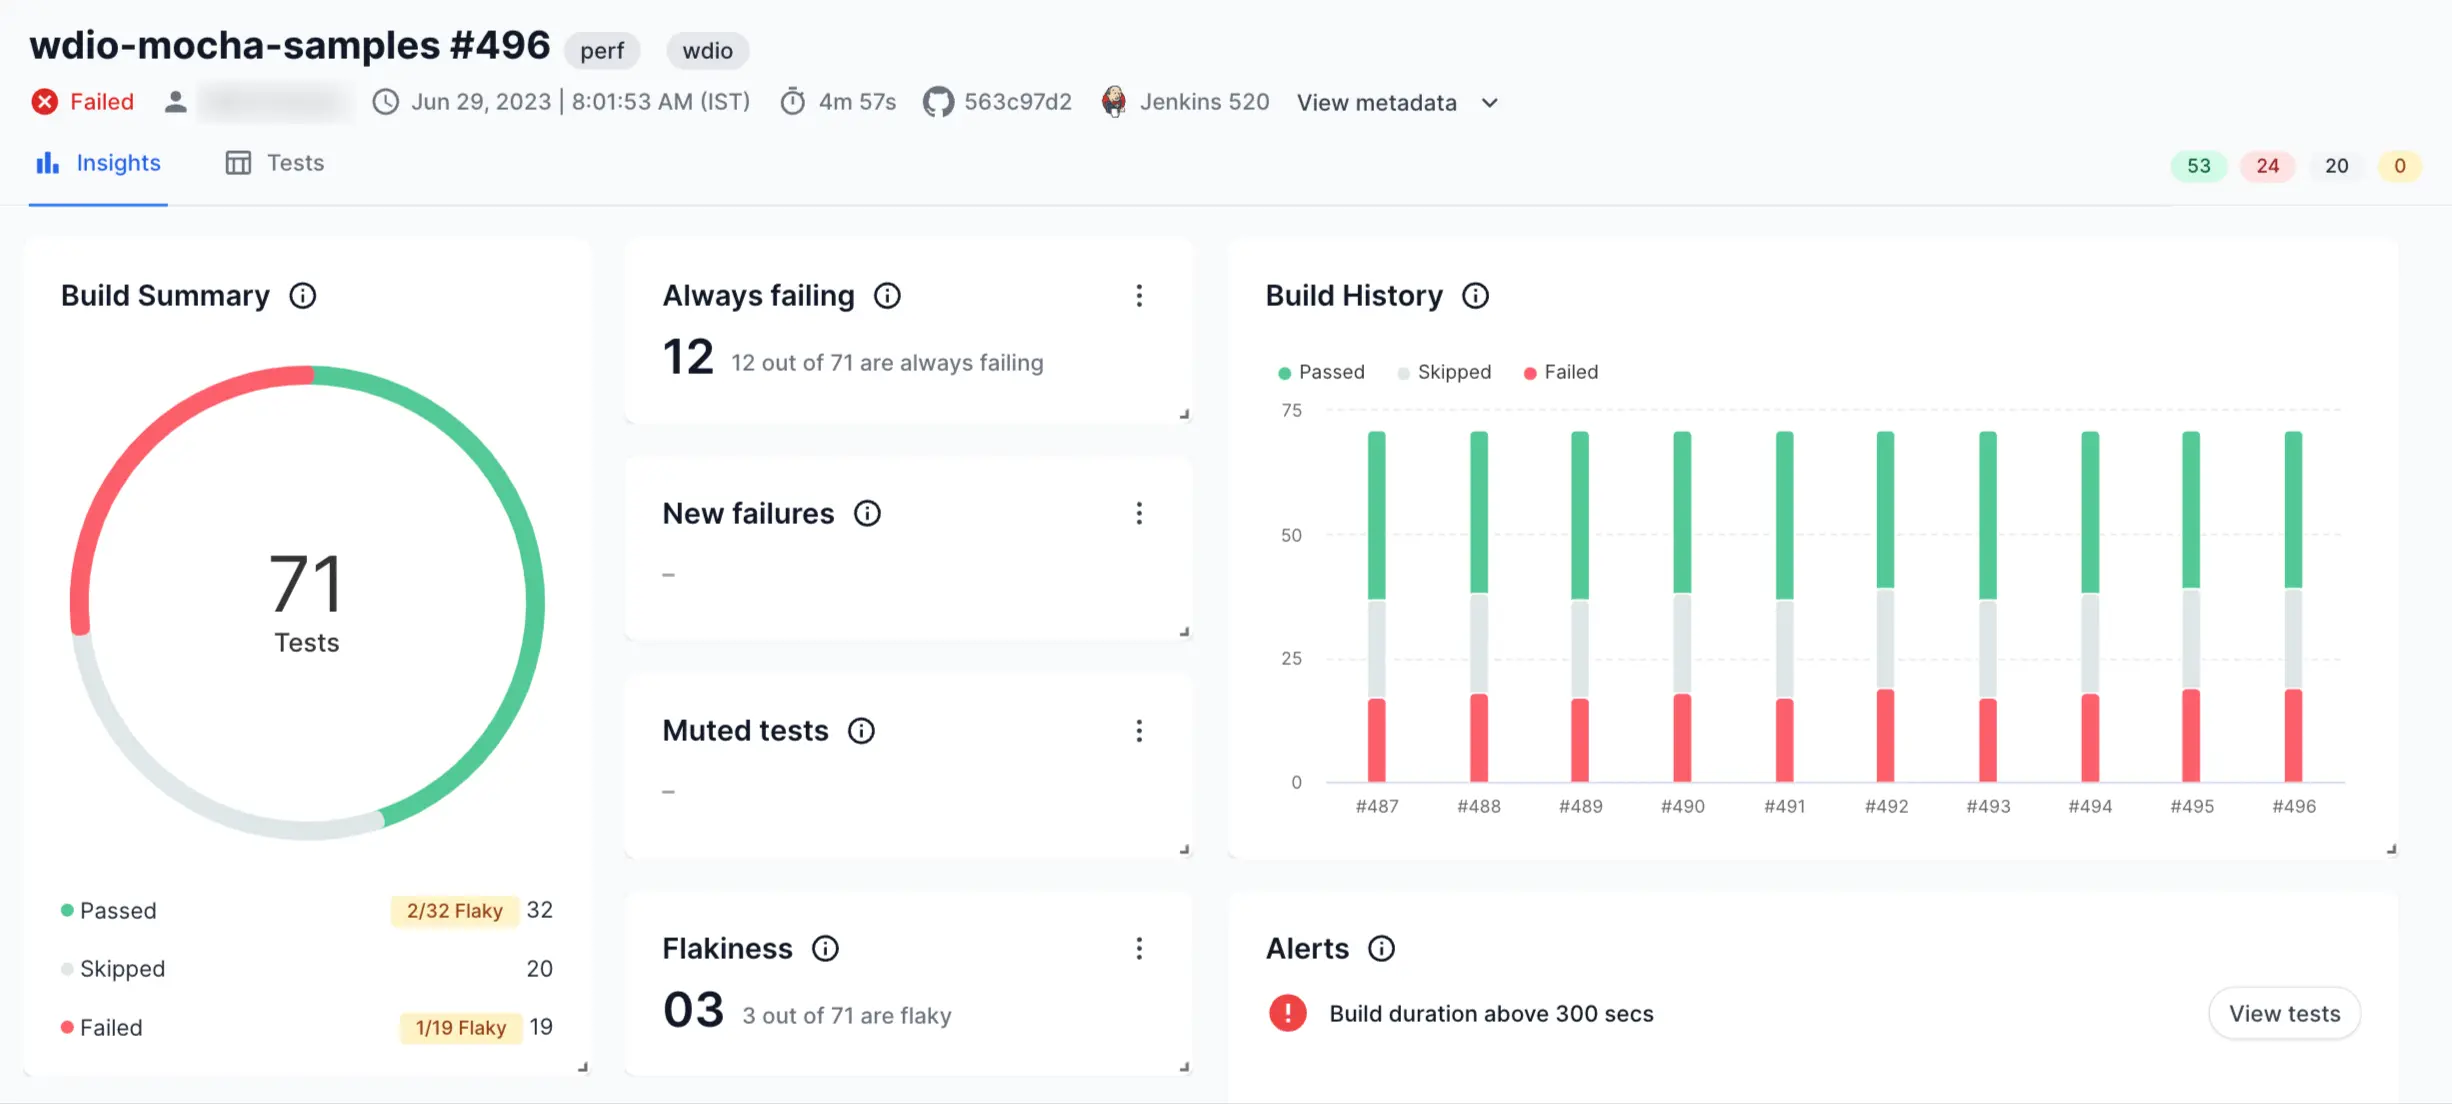
The Insights tab in Build Insights presents a set of useful charts and data points that provide detailed information about the selected build.
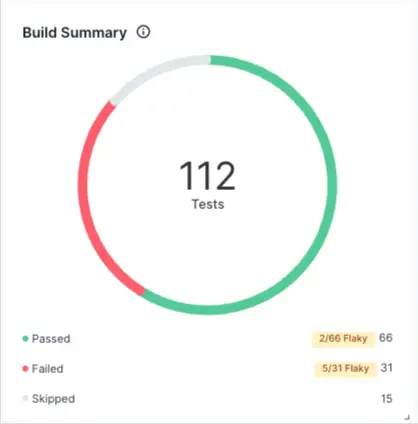
Build summary
The Build Summary donut chart illustrates the number of tests that passed, failed, or were skipped in a build run. This chart also highlights any flaky tests in a build run. You can click various elements on the chart to view a filtered list of tests.
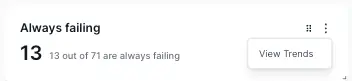
Always failing tests
The Always failing count denotes the number of tests in the selected build that continuously fails, as per the conditions set in the Always Failing Smart Tag.
You can click the kebab menu and select View Trends to view more details in Testing Trends.
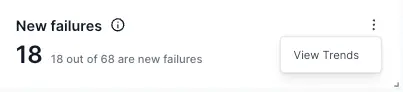
New failures
The New failures count denotes the number of tests that started to fail recently, as per the conditions set in the New Failure Smart Tag.
You can click the kebab menu and select View Trends to view more details in Testing Trends.
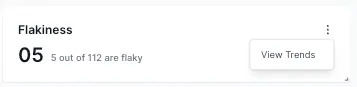
Flakiness
The Flakiness count denotes the number of flaky tests in the selected build as per the conditions set in the flaky Smart Tag.
You can click the kebab menu and select View Trends to view more details in Testing Trends.
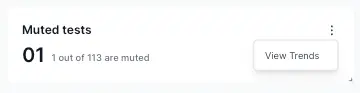
Muted tests
The Muted tests count denotes the number of tests you have muted in your build.
You can click the kebab menu and select View Trends to view more details in Testing Trends.
Build History
The Build History chart provides a trend of how the selected build has been performing over time. It illustrates the number of tests that were passed, failed, or skipped in each of the build runs.
You can hover over the chart and click it to view more details about the tests.
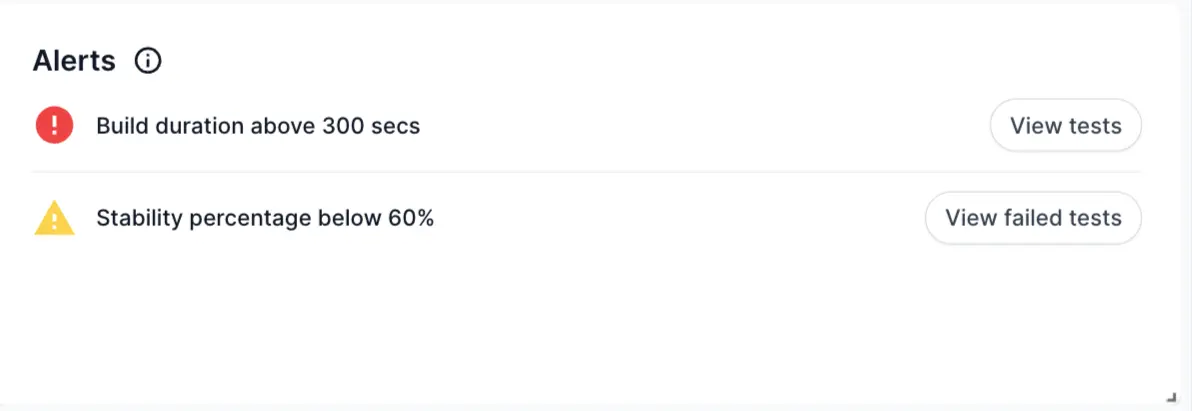
Alerts
BrowserStack Test Observability allows users to set up custom rules for every build. If these rules are breached, you will see an alert on Build Insights, helping you quickly understand if the build failed any quality standards you might have set. Click here to learn how to set up custom alerts.
You can click the View failed tests button to view the tests that triggered a particular alert.
Unique Errors
The Unique Errors widget illustrates the impact of individual errors in your test suite.
This widget allows you to take a unique yet incredibly effective approach to resolving failures in your build. By fixing one underlying error, you could fix tens of tests that are impacted by the same error.
You can further click a test to inspect it using the Timeline Debugging view.
Build stability
The Build stability widget illustrates the change in the percentage of tests in a specific build that passes over time. You can hover over the chart to get more information or click on any point in the chart to view the tests in detail.
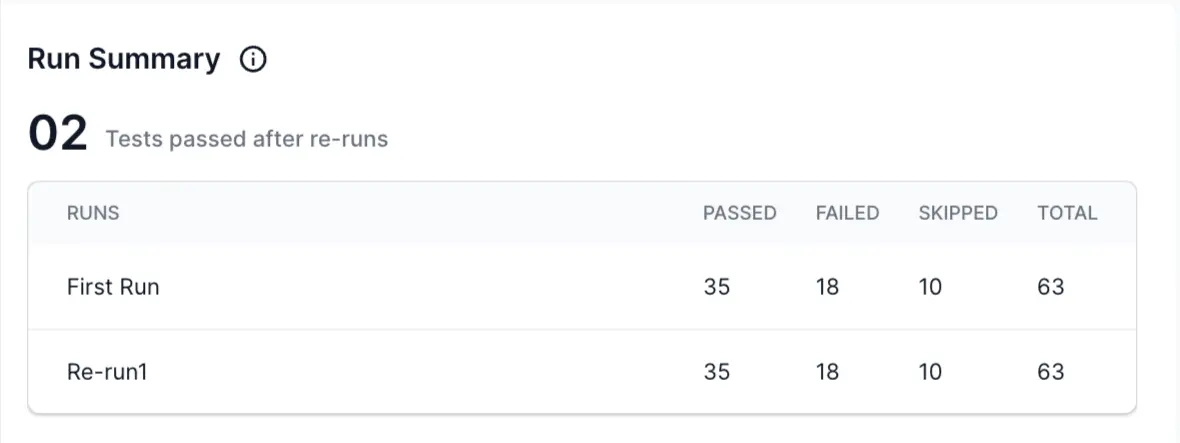
Run Summary
The Run Summary widget shows a summary of all the runs clubbed in a specific build. It includes all re-runs and merged runs triggered from multiple CI machines. Learn more about merging multiple runs and creating one single report.
You can view how many tests were passed, failed, or skipped in each run or re-run. You can further click on a run to see a filtered view of all the tests within that run.
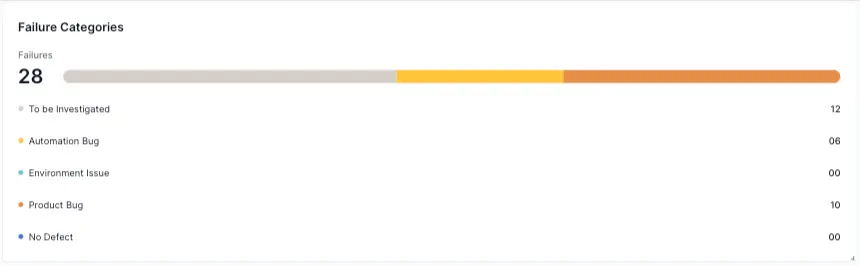
Failure Categories
The Failure Categories chart displays the result of Automatic Failure Analysis performed by Test Observability. This chart helps you to know which test failures are genuine and which are just noise. Automatic Failure Analysis classifies test failures into different categories like Product bugs, Automation bugs, Environment issue, No Defect, and To be investigated.
You can click the chart or a failure category to view the Test Listing in that particular category.
Failures by Folders
The Failures by Folders heatmap represents the failure rate of different modules in a test suite. You can hover your mouse over a folder to view the test statistics of that particular module. You can further click a folder to open subfolders and inspect a filtered view of those tests.
Customize the charts and widgets in Build Insights
You can customize the charts and widgets in Build Insights by changing their dimensions or order of display. These changes you make to the layout are saved in your browser.
Reorder the charts and widgets
To reorder the charts and widgets,
- Hover your mouse over any chart in Build Insights.
- Click the candy bar menu and drag the chart to a different part of your screen.
Use this feature to reorder the charts based on the priorities of your test suite.
Resize the charts and widgets
To resize the charts and widgets, click the small arrow mark at the corner of a widget and drag it to the size you prefer.
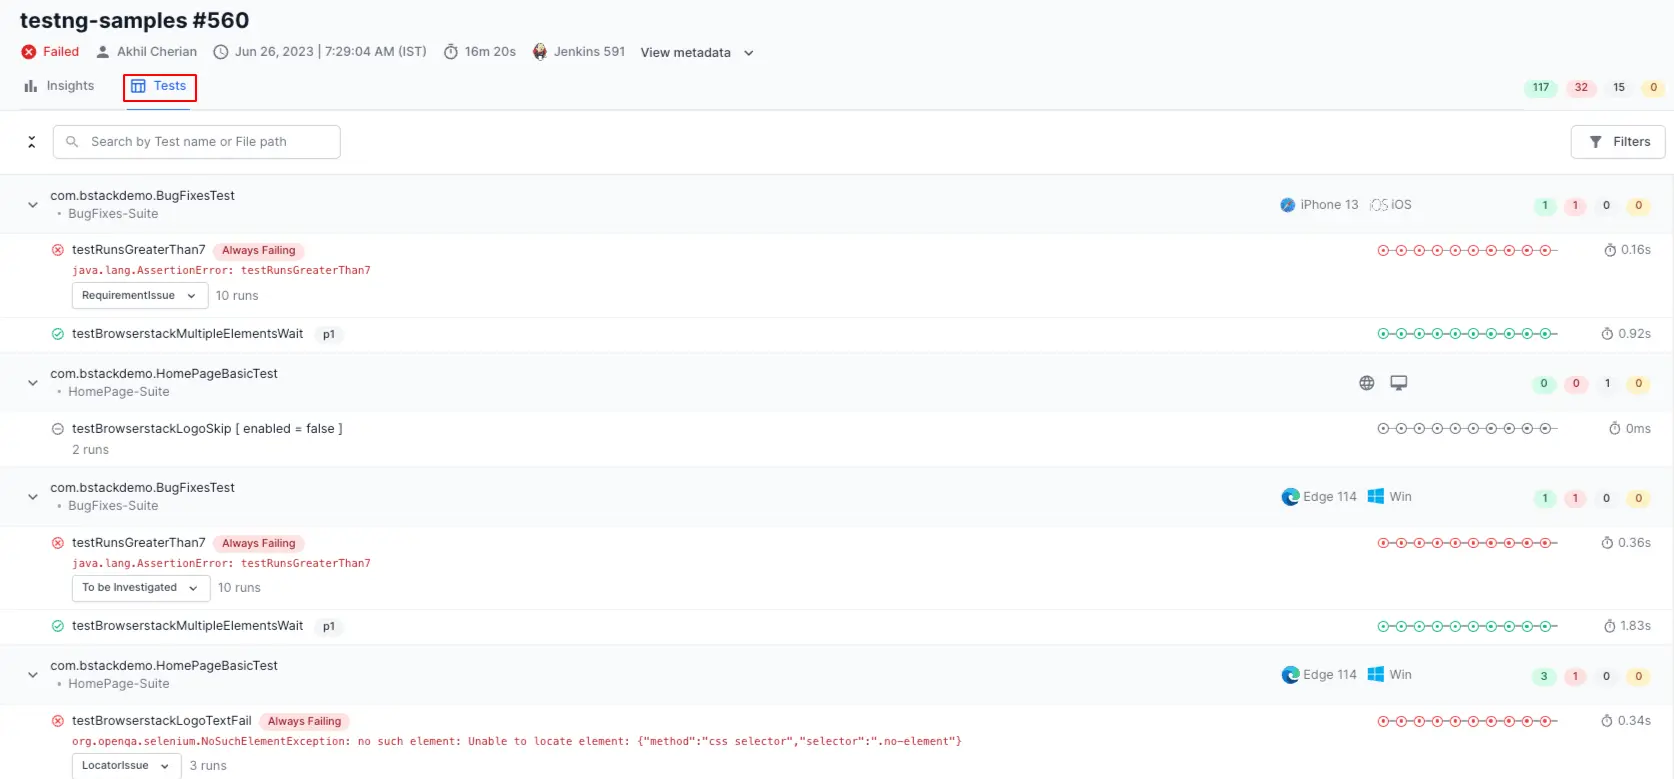
Tests tab
When you click the Tests tab, a Test Listing opens up in which you can view all the tests associated with the build run.
Test Listing hierarchy
The tests are grouped in the Test Listing in a hierarchical order. This hierarchy depends on your test framework.
In the Mocha example in the screenshot, the tests are organized into the following groups:
- File level: Tests cases grouped by the browser-device combination.
- Describe level: Test cases for a feature.
- Nested describe level: Test cases for a sub-feature.
- Test case level: Individual test cases.
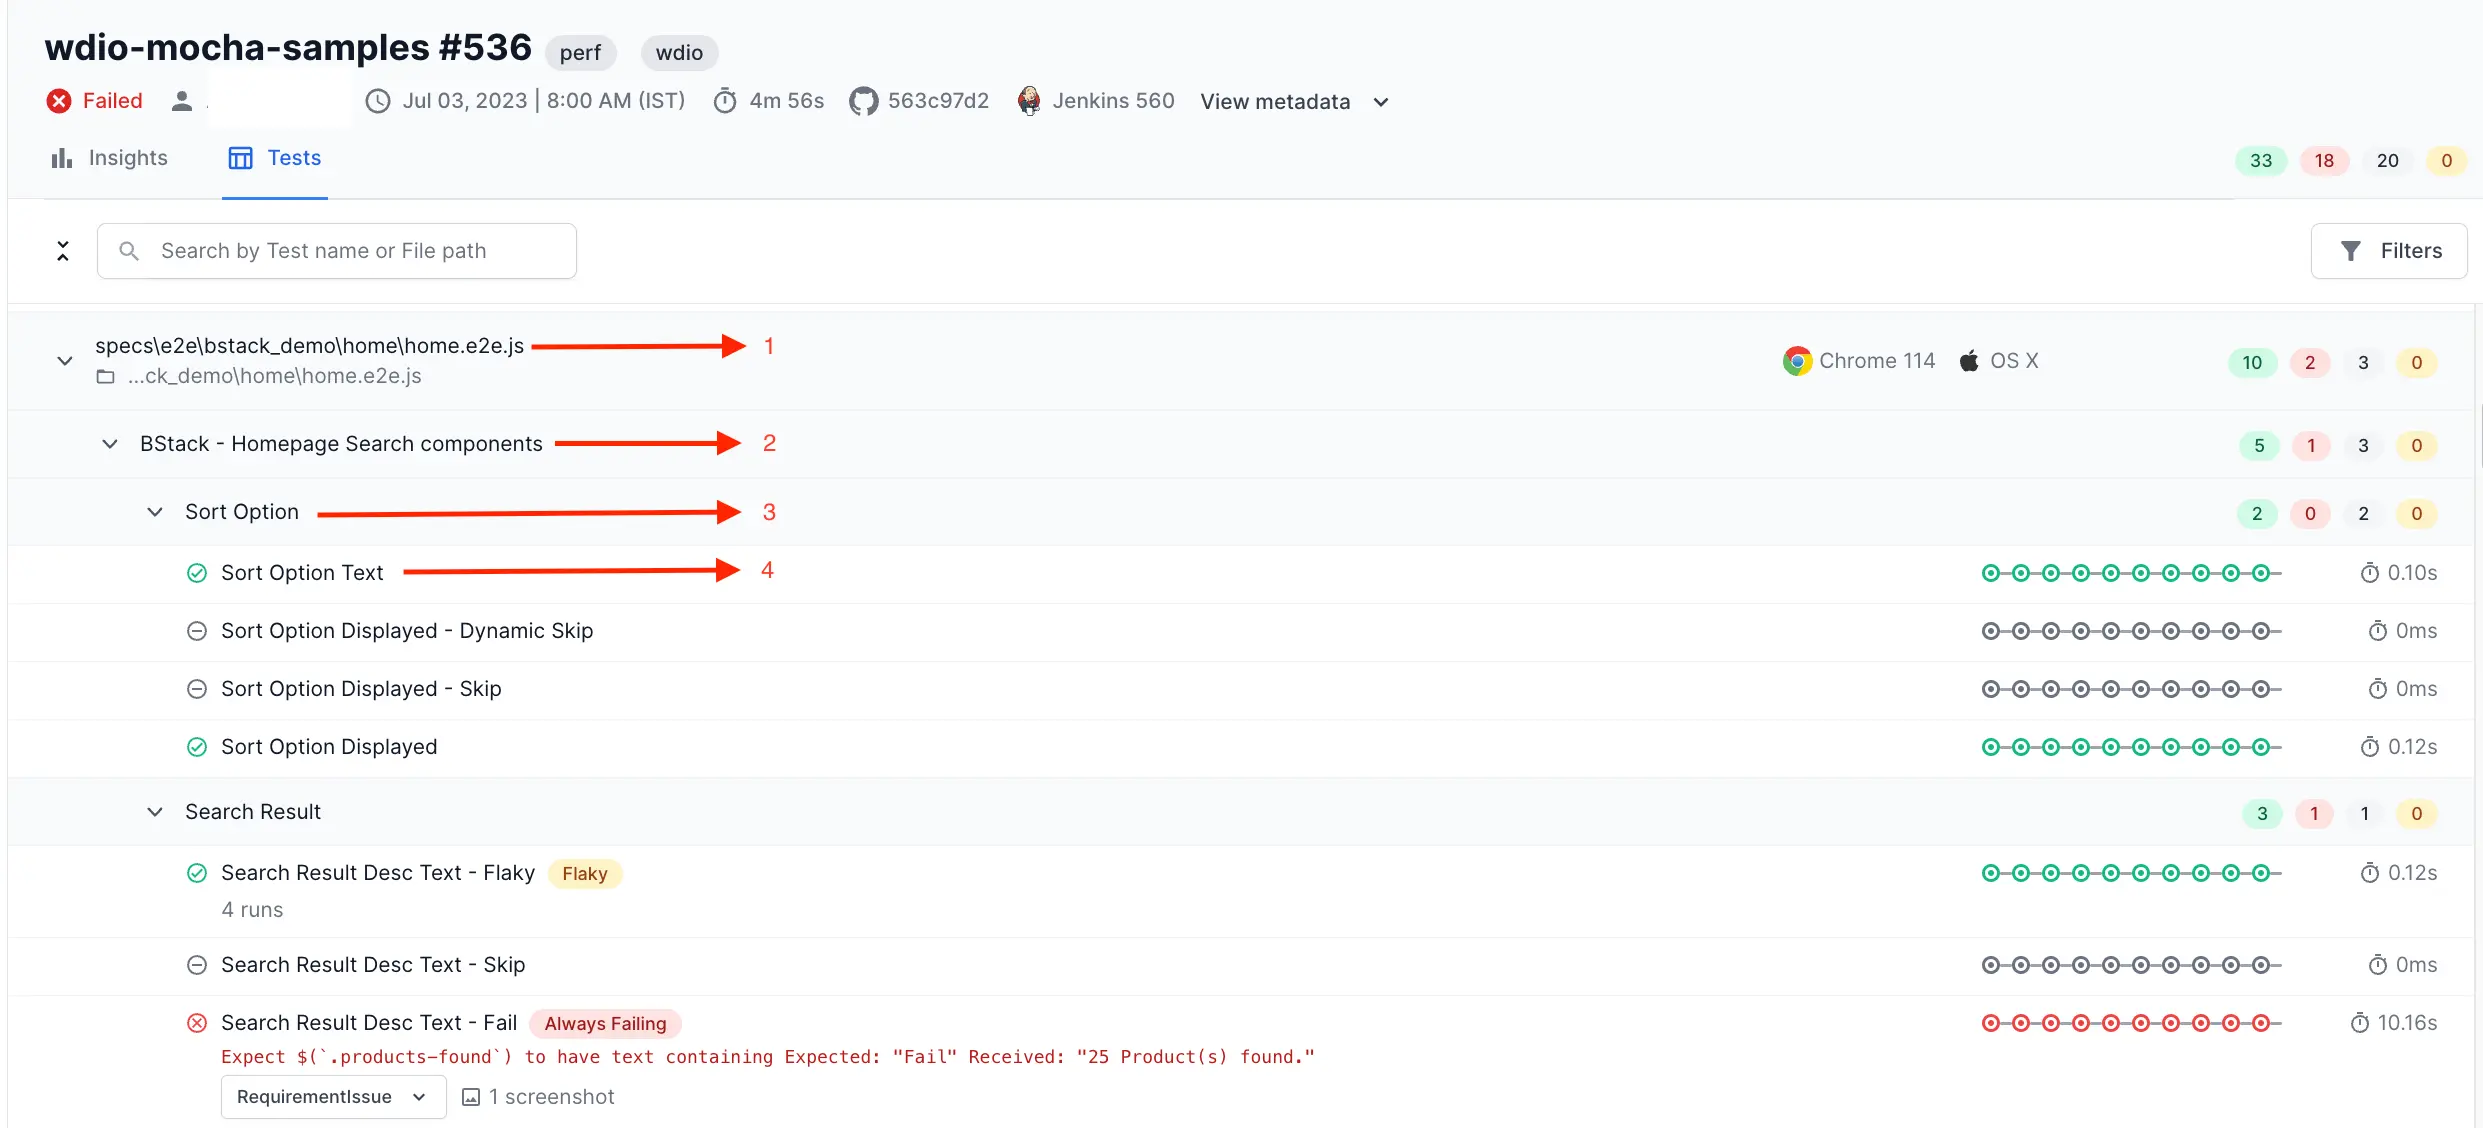
You can click an individual test case to open the Timeline Debugging view.
Search for a test or file path
You can use the search bar to find a particular test or file path.
Apply filters to tests
To filter the tests in a build, click the Filters button on the top-right corner. A sidebar appears where you can select the desired filters. After you’ve made your selections, click the Apply button to filter the tests based on your chosen criteria.
View test execution history
You can view a timeline chart that illustrates the multiple executions of a test. Red, green, and grey circles represent a failed, passed, or skipped test respectively.
If you click the chart or a test, you can inspect more details in the Timeline Debugging view. In the Timeline Debugging view, you can view and debug your test runs with every type of log in one place. You can also travel back in time to see how the same test fared in previous executions to aid your debugging efforts.
Report a Jira bug, Re-run, mute, or unmute tests
You can hover over a test to view buttons to re-run a test, report a Jira bug, and mute/unmute a test.
Explore Build Insights and Test Listing in the demo sandbox
You can explore Build Insights and Test Listing in the Test Observability demo sandbox.
We're sorry to hear that. Please share your feedback so we can do better
Contact our Support team for immediate help while we work on improving our docs.
We're continuously improving our docs. We'd love to know what you liked
Is this page helping you?
 Yes
No
Yes
No
We're sorry to hear that. Please share your feedback so we can do better
Contact our Support team for immediate help while we work on improving our docs.
We're continuously improving our docs. We'd love to know what you liked
Thank you for your valuable feedback!