Testing Trends
Learn how testing activity in your organization has evolved over time.
Testing Trends in Test Reporting & Analytics serves as a central hub to analyze trends in the testing activity in your organization. It presents crucial metrics and high-level statistics that enable you to get a comprehensive picture of the testing activity and uphold the highest quality standards in your organization.
To navigate to Testing Trends, click Testing Trends in the menu bar. You can scroll down to view all the charts in Testing Trends.
Let’s explore the capabilities and features grouped under Testing Trends.
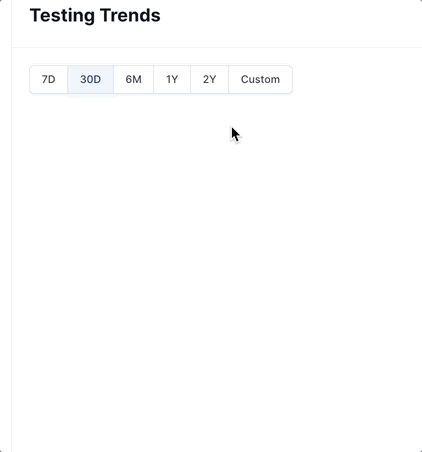
View trends within a specific time window
You can use the date range selector located in the top-left corner, to filter tests executed within specific time periods. Alternatively, you can specify a custom start and end date to focus on tests within a specific time frame.
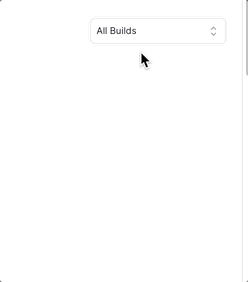
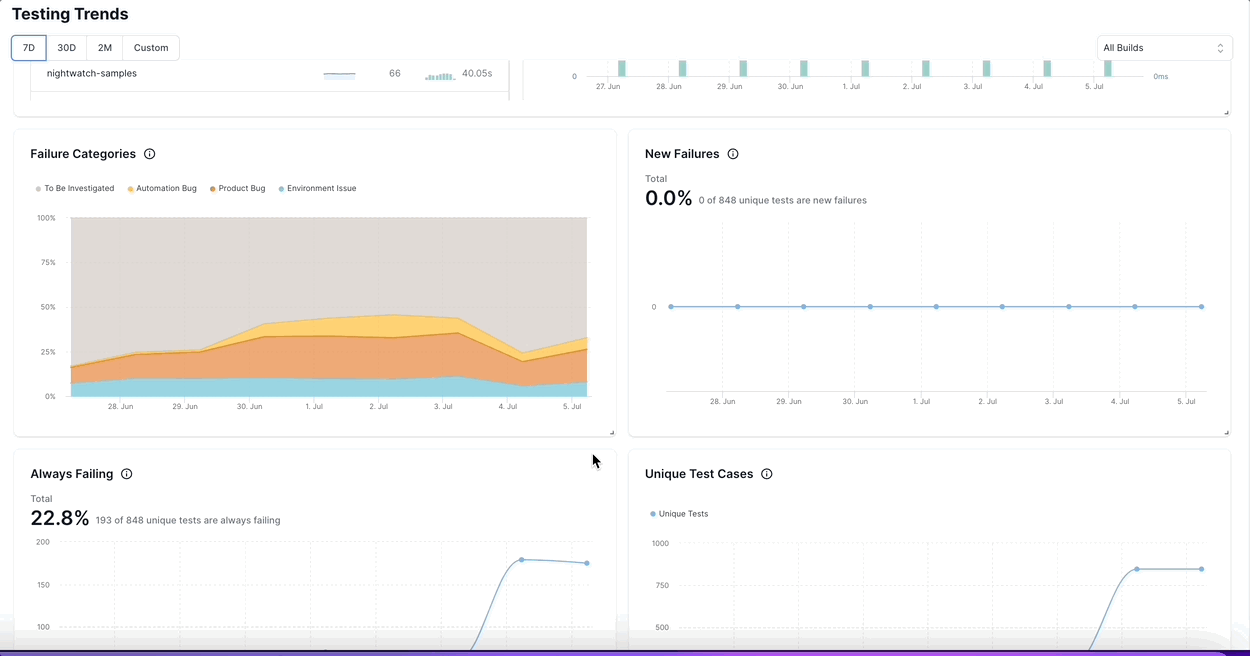
Apply filters to view trends for a specific build
Testing Trends displays the trends of all builds by default. You can view the trends of a specific build by using the filter in the top-right corner.
View charts on testing trends
Testing Trends presents the following charts to visualize the trends in the testing activity in your organization for the chosen date range.
-
Latest Unique Build Runs: This widget helps you to know how the latest runs of your builds performed. It summarizes the latest run of all the builds in your project. This widget always displays the latest runs, bypassing the date range filters.
You can use this scrollable list to view the number of tests that
passed,failed, or wereskippedin the latest build run. You can also view other details like the user, timestamp of the build run, and Smart Tags.You can click a build run to inspect more details using Build Insights.
-
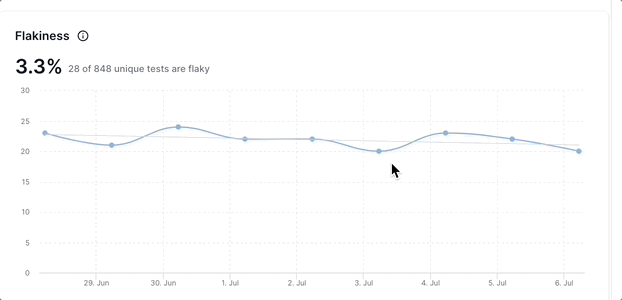
Flakiness: This chart illustrates the change in the percentage of flaky tests as per the conditions set in the
FlakySmart Tag. A higher percentage of flaky tests or an upward trend indicates quality issues in your automation tests.You can hover over the chart to view more details and click View Tests to inspect more details in Tests Health.
-
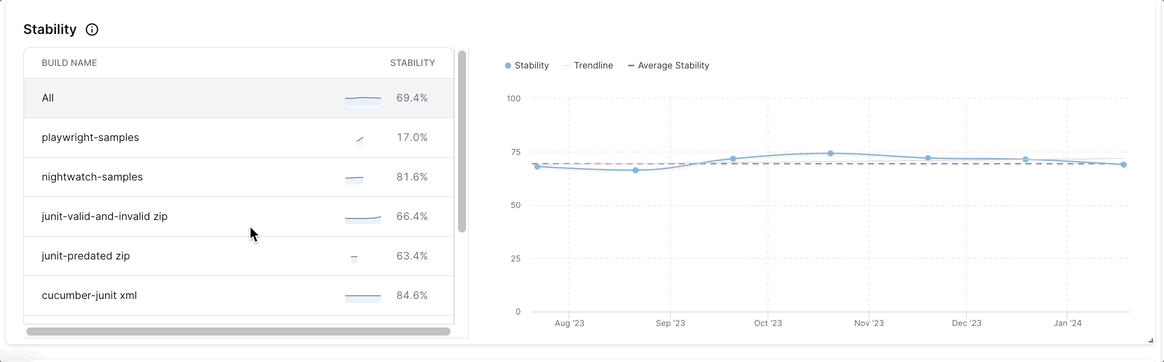
Stability: This widget helps you understand how stable the testing activity in your organization is. It illustrates the fluctuation in the stability (total passing test executions as a percentage of overall test executions) of builds over time.
By default, the chart illustrates the stability of all unique builds. You can click a build name to view filtered data for a specific build.
You can hover over the chart to view more details and click View Tests to inspect more details in Tests Health.
-
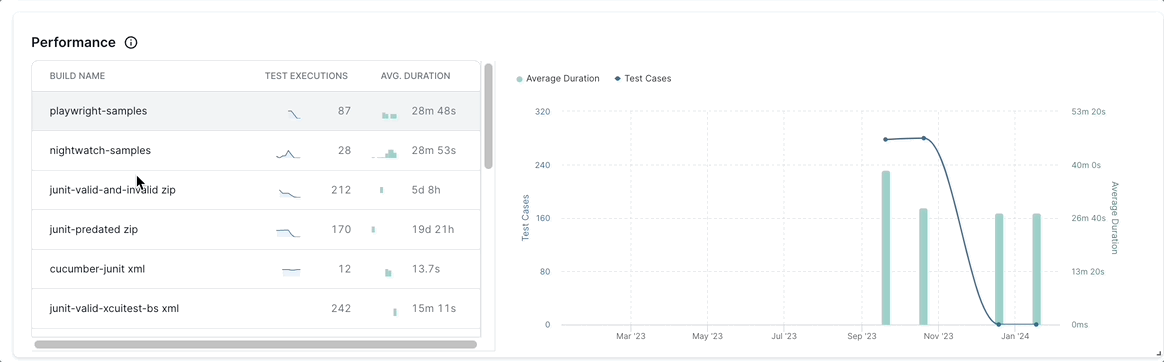
Performance This widget helps you understand if the performance of your builds is improving or worsening over time, enabling you to uncover bottlenecks in your testing. It illustrates the number of test cases and the average duration of a build over time on a line chart. If the average duration trends upwards, it indicates that the performance of your builds has been improving.
You can click a build to filter and understand the fluctuation in average duration for that particular build.
You can hover over the chart to view more details and click View Tests to inspect more details in Tests Health.
-
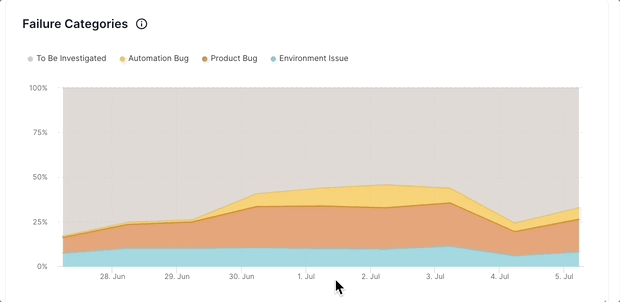
Failure Categories This chart helps you understand the common causes of test failures and how it is changing over time. You can use this information to prioritize the efforts of your engineering and QA teams.
This chart uses the result of Automatic Failure Analysis performed by Test Reporting & Analytics. Automatic Failure Analysis learns from the testing activity over time and classifies test failures into categories like
Product Bug,Automation Bug,Environment Issue,No Defect, andTo Be Investigated.You can hover over the chart to view more details and click View Tests to inspect more details in Tests Health.
-
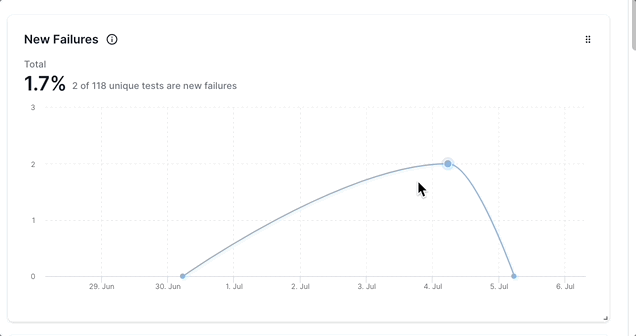
New Failures: This chart helps you discover suboptimal development quality impacting many tests. New failures are test cases that failed at least once within a configurable number of build runs, as per the conditions set in the
New FailureSmart Tag. A high number of New Failures every day or an upward trend points to an opportunity to improve the dev quality.You can hover over the chart to view more details and click View Tests to inspect more details in Tests Health.
-
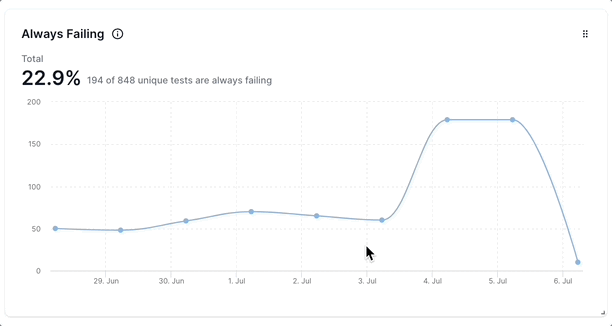
Always Failing: A high number of Always Failing tests in this chart indicates lower effectiveness of the test cases in your automation tests. This chart illustrates the number of tests that continuously fail, as per the conditions set in the
Always FailingSmart Tag.You can hover over the chart to view more details and click View Tests to inspect more details in Tests Health.
-
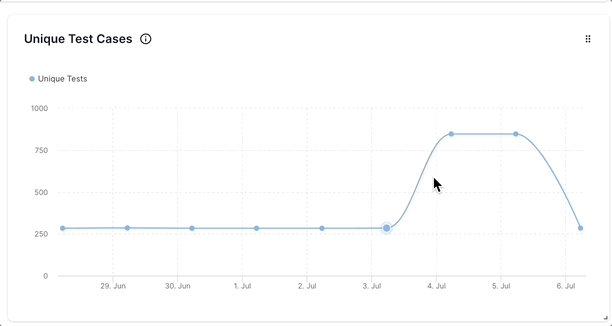
Unique Test Cases This chart tracks the growth of unique test cases being run. An upward-trending graph represents more automation scenarios being added, and a more complete test suite being built.
You can hover over the chart to view more details and click View Tests to inspect more details in Tests Health.
-
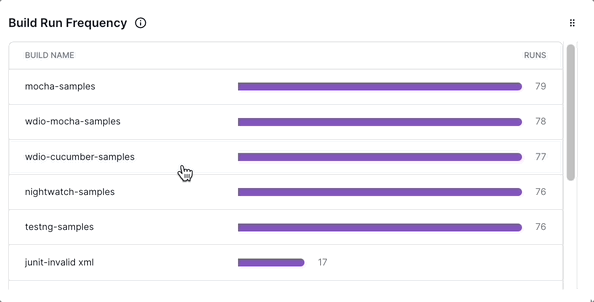
Build Run Frequency This chart helps you benchmark the maturity of the CI/CD setup in your organization. It illustrates the number of times builds are run in the selected date range. A higher frequency of test build runs indicates a healthy volume of tests and enables you to detect bugs earlier in the SDLC.
You can hover over the bar chart and click View build runs to inspect more details in Tests Health.
-
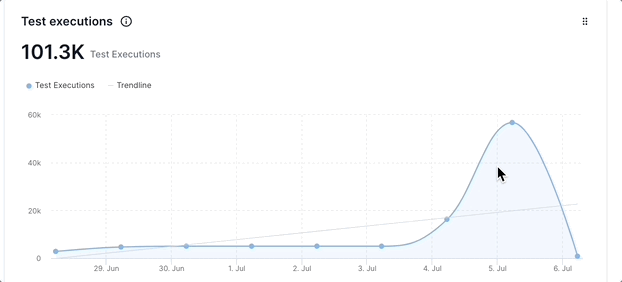
Test Executions This chart represents the scale of test automation activity in your organization, by displaying the overall number of test executions over time. Trends can be used to forecast the future scale of testing and progress made toward goals. An upward trend indicates that the scale of automation testing is increasing.
You can hover over the chart and click View Tests to inspect more details in Tests Health.
-
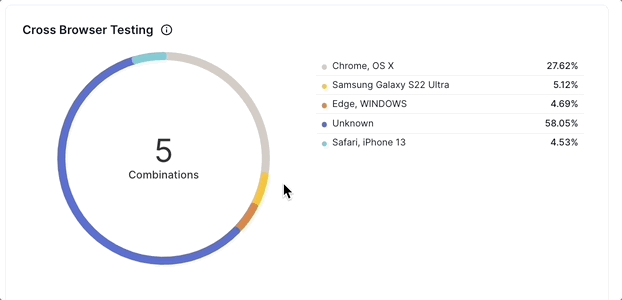
Cross Browser Testing This donut chart helps you understand the coverage of your automation tests across various device-browser combinations. A high number of combinations and a well-distributed percentage of tests in multiple combinations indicate a more rigorous testing activity across multiple device-browser combinations.
You can hover over the chart and click View Tests to inspect more details in Tests Health.
Reorder and resize the charts and widgets
To reorder the charts and widgets:
- Hover your mouse over a chart in Testing Trends.
- Click the candy bar menu and drag the chart to a different part of your screen.
Use this feature to reorder the charts based on the priorities of your project.
To resize the charts and widgets, click the small arrow mark at the bottom-right corner of a widget and drag it to the size you prefer.
Explore Testing Trends in the demo sandbox
You can explore Testing Trends in the Test Reporting & Analytics demo sandbox.
We're sorry to hear that. Please share your feedback so we can do better
Contact our Support team for immediate help while we work on improving our docs.
We're continuously improving our docs. We'd love to know what you liked
We're sorry to hear that. Please share your feedback so we can do better
Contact our Support team for immediate help while we work on improving our docs.
We're continuously improving our docs. We'd love to know what you liked
Thank you for your valuable feedback!