
Timeline Debugging
Debug your test failures, view all logs and previous test runs in a single view, and resolve issues in your test suite efficiently.
Timeline Debugging in BrowserStack Test Reporting & Analytics is a comprehensive tool that lets you view and debug your test runs with every type of log in one place. You can also travel back in time to see how the same test fared in previous executions to aid your debugging efforts.
Why should you use Timeline Debugging?
Timeline Debugging enriches the debugging process by giving you everything you need to debug a test in one place. Focus and perform root cause analysis fast as you no longer need to jump from tool to tool just to collate the necessary logs. Timeline Debugging also reduces the cognitive load of debugging a test by presenting key information and steps in a concise, easy-to-understand timeline view.
How to use Timeline Debugging?
You can access Timeline Debugging primarily from Build Runs, Tests Health, and Unique Errors.
Navigating to Timeline Debugging from Build Runs
While in the Build Runs view:
- Select the build that you want to debug.
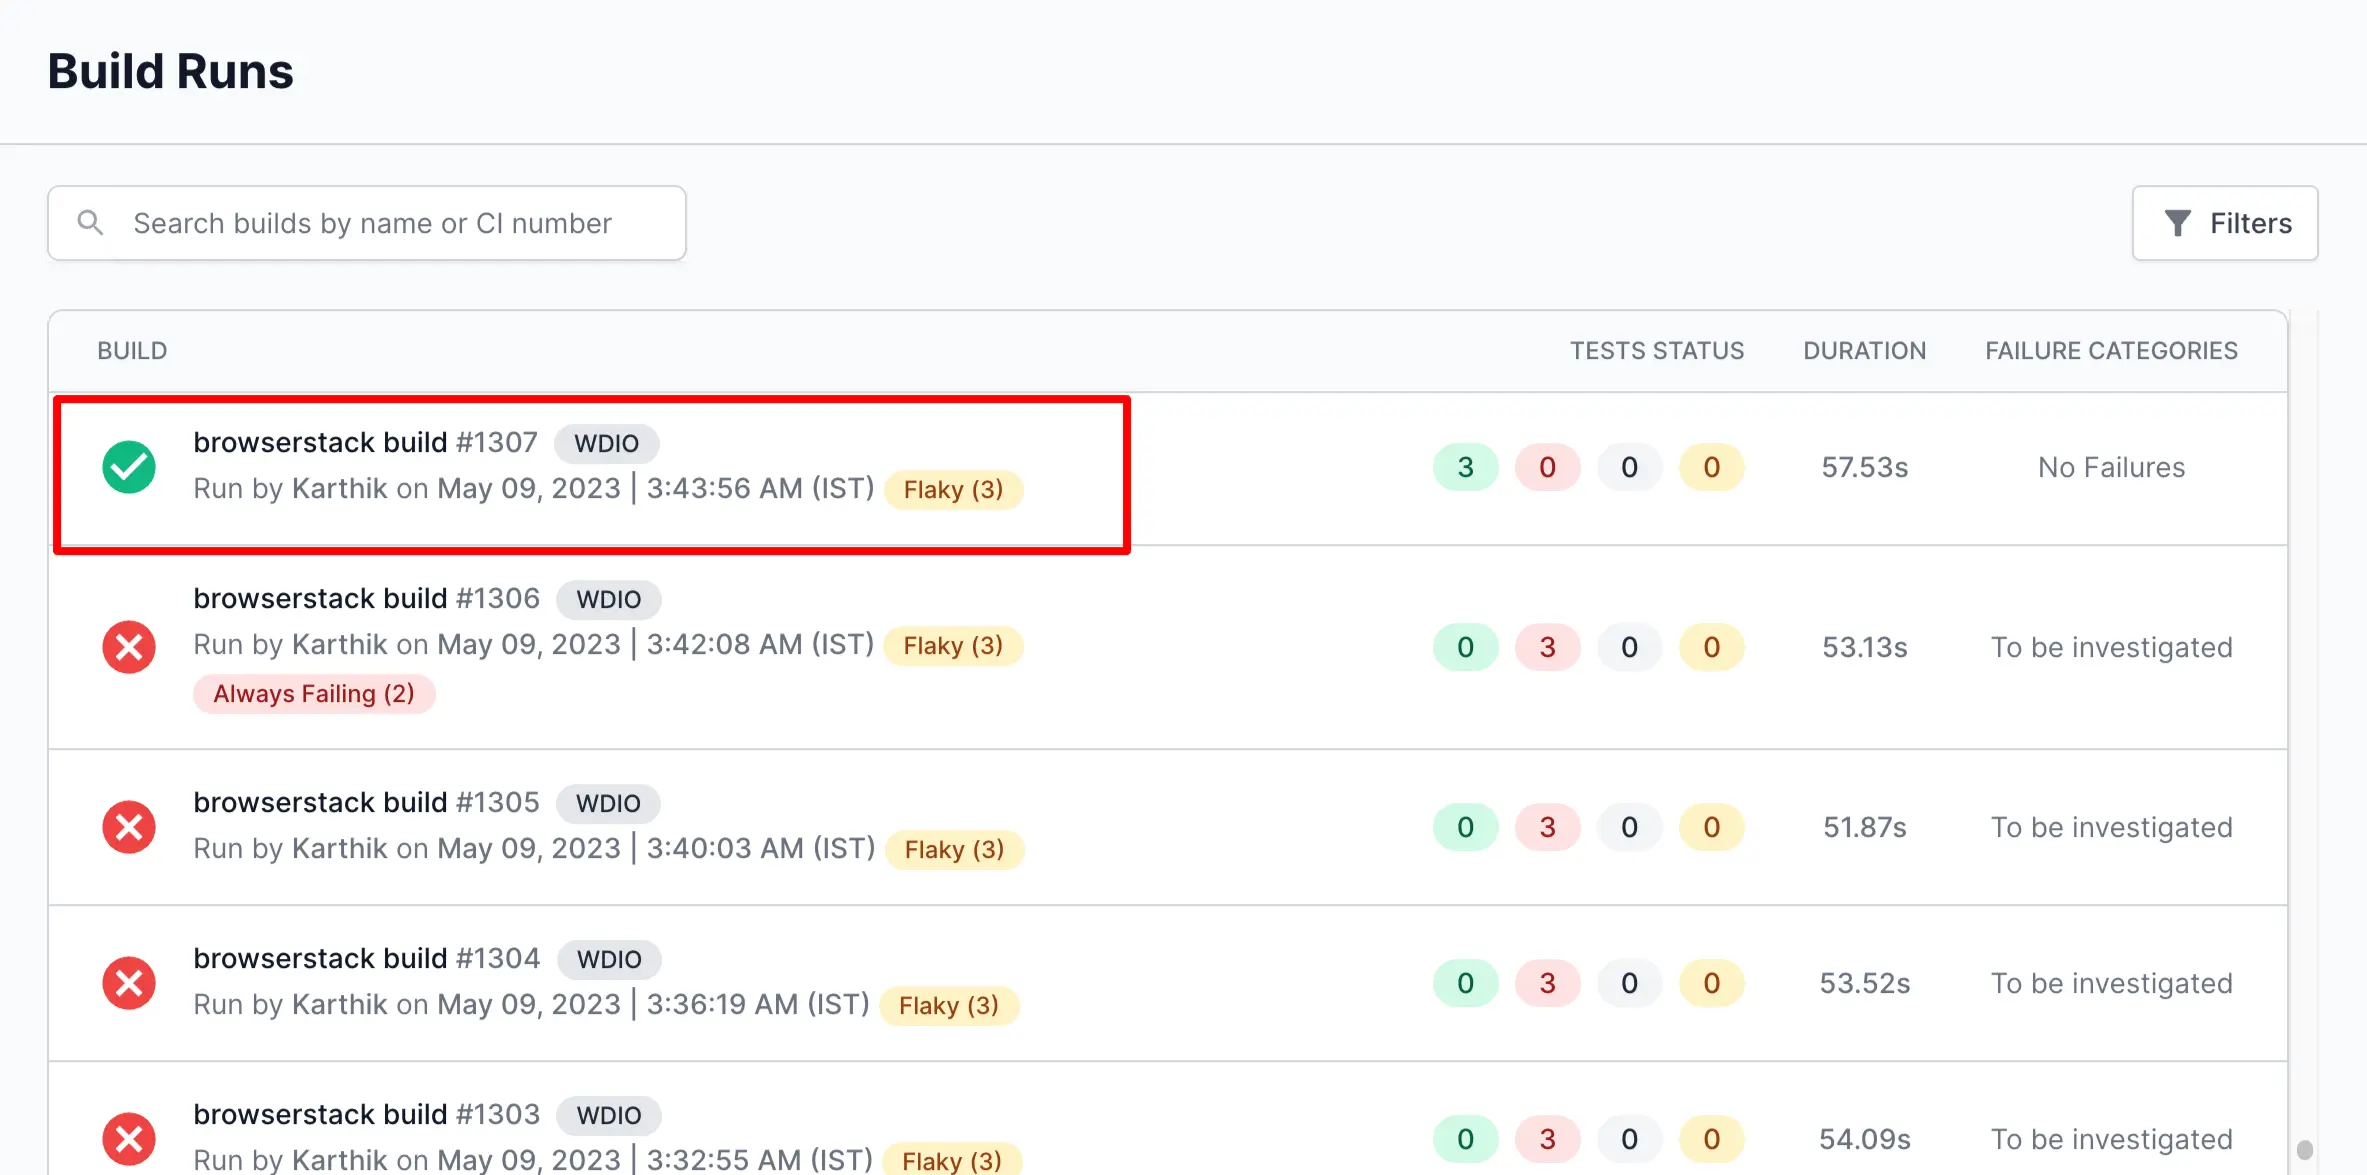
- Click the Tests tab.
- Click any of the test runs.
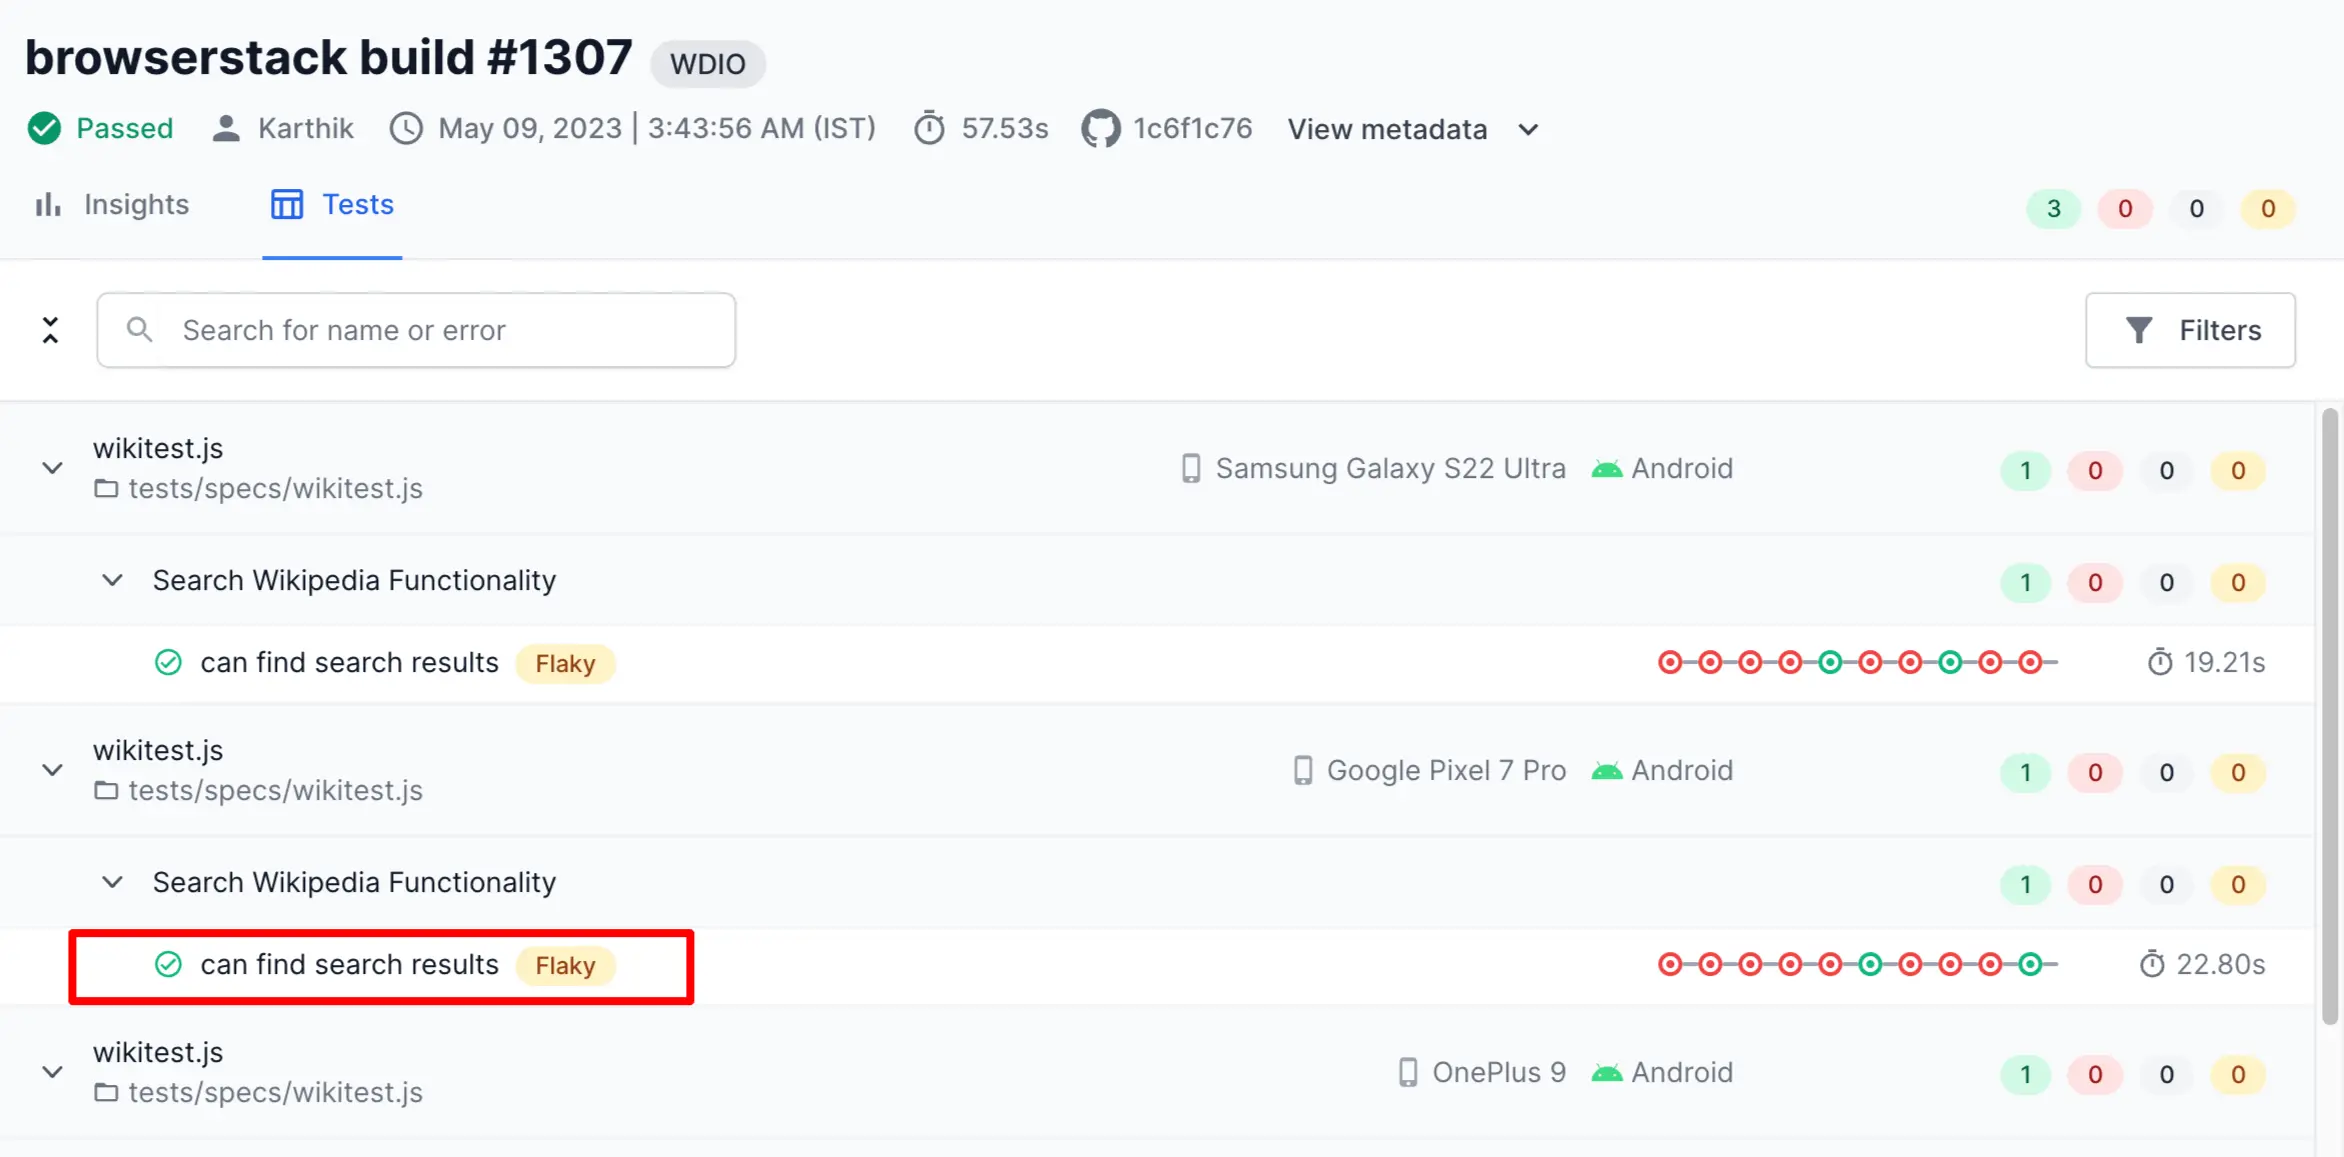
The Timeline Debugging view opens on the right-hand side of your screen.
Navigating to Timeline Debugging from Tests Health
While in the Tests Health view:
- Click any of the test runs.
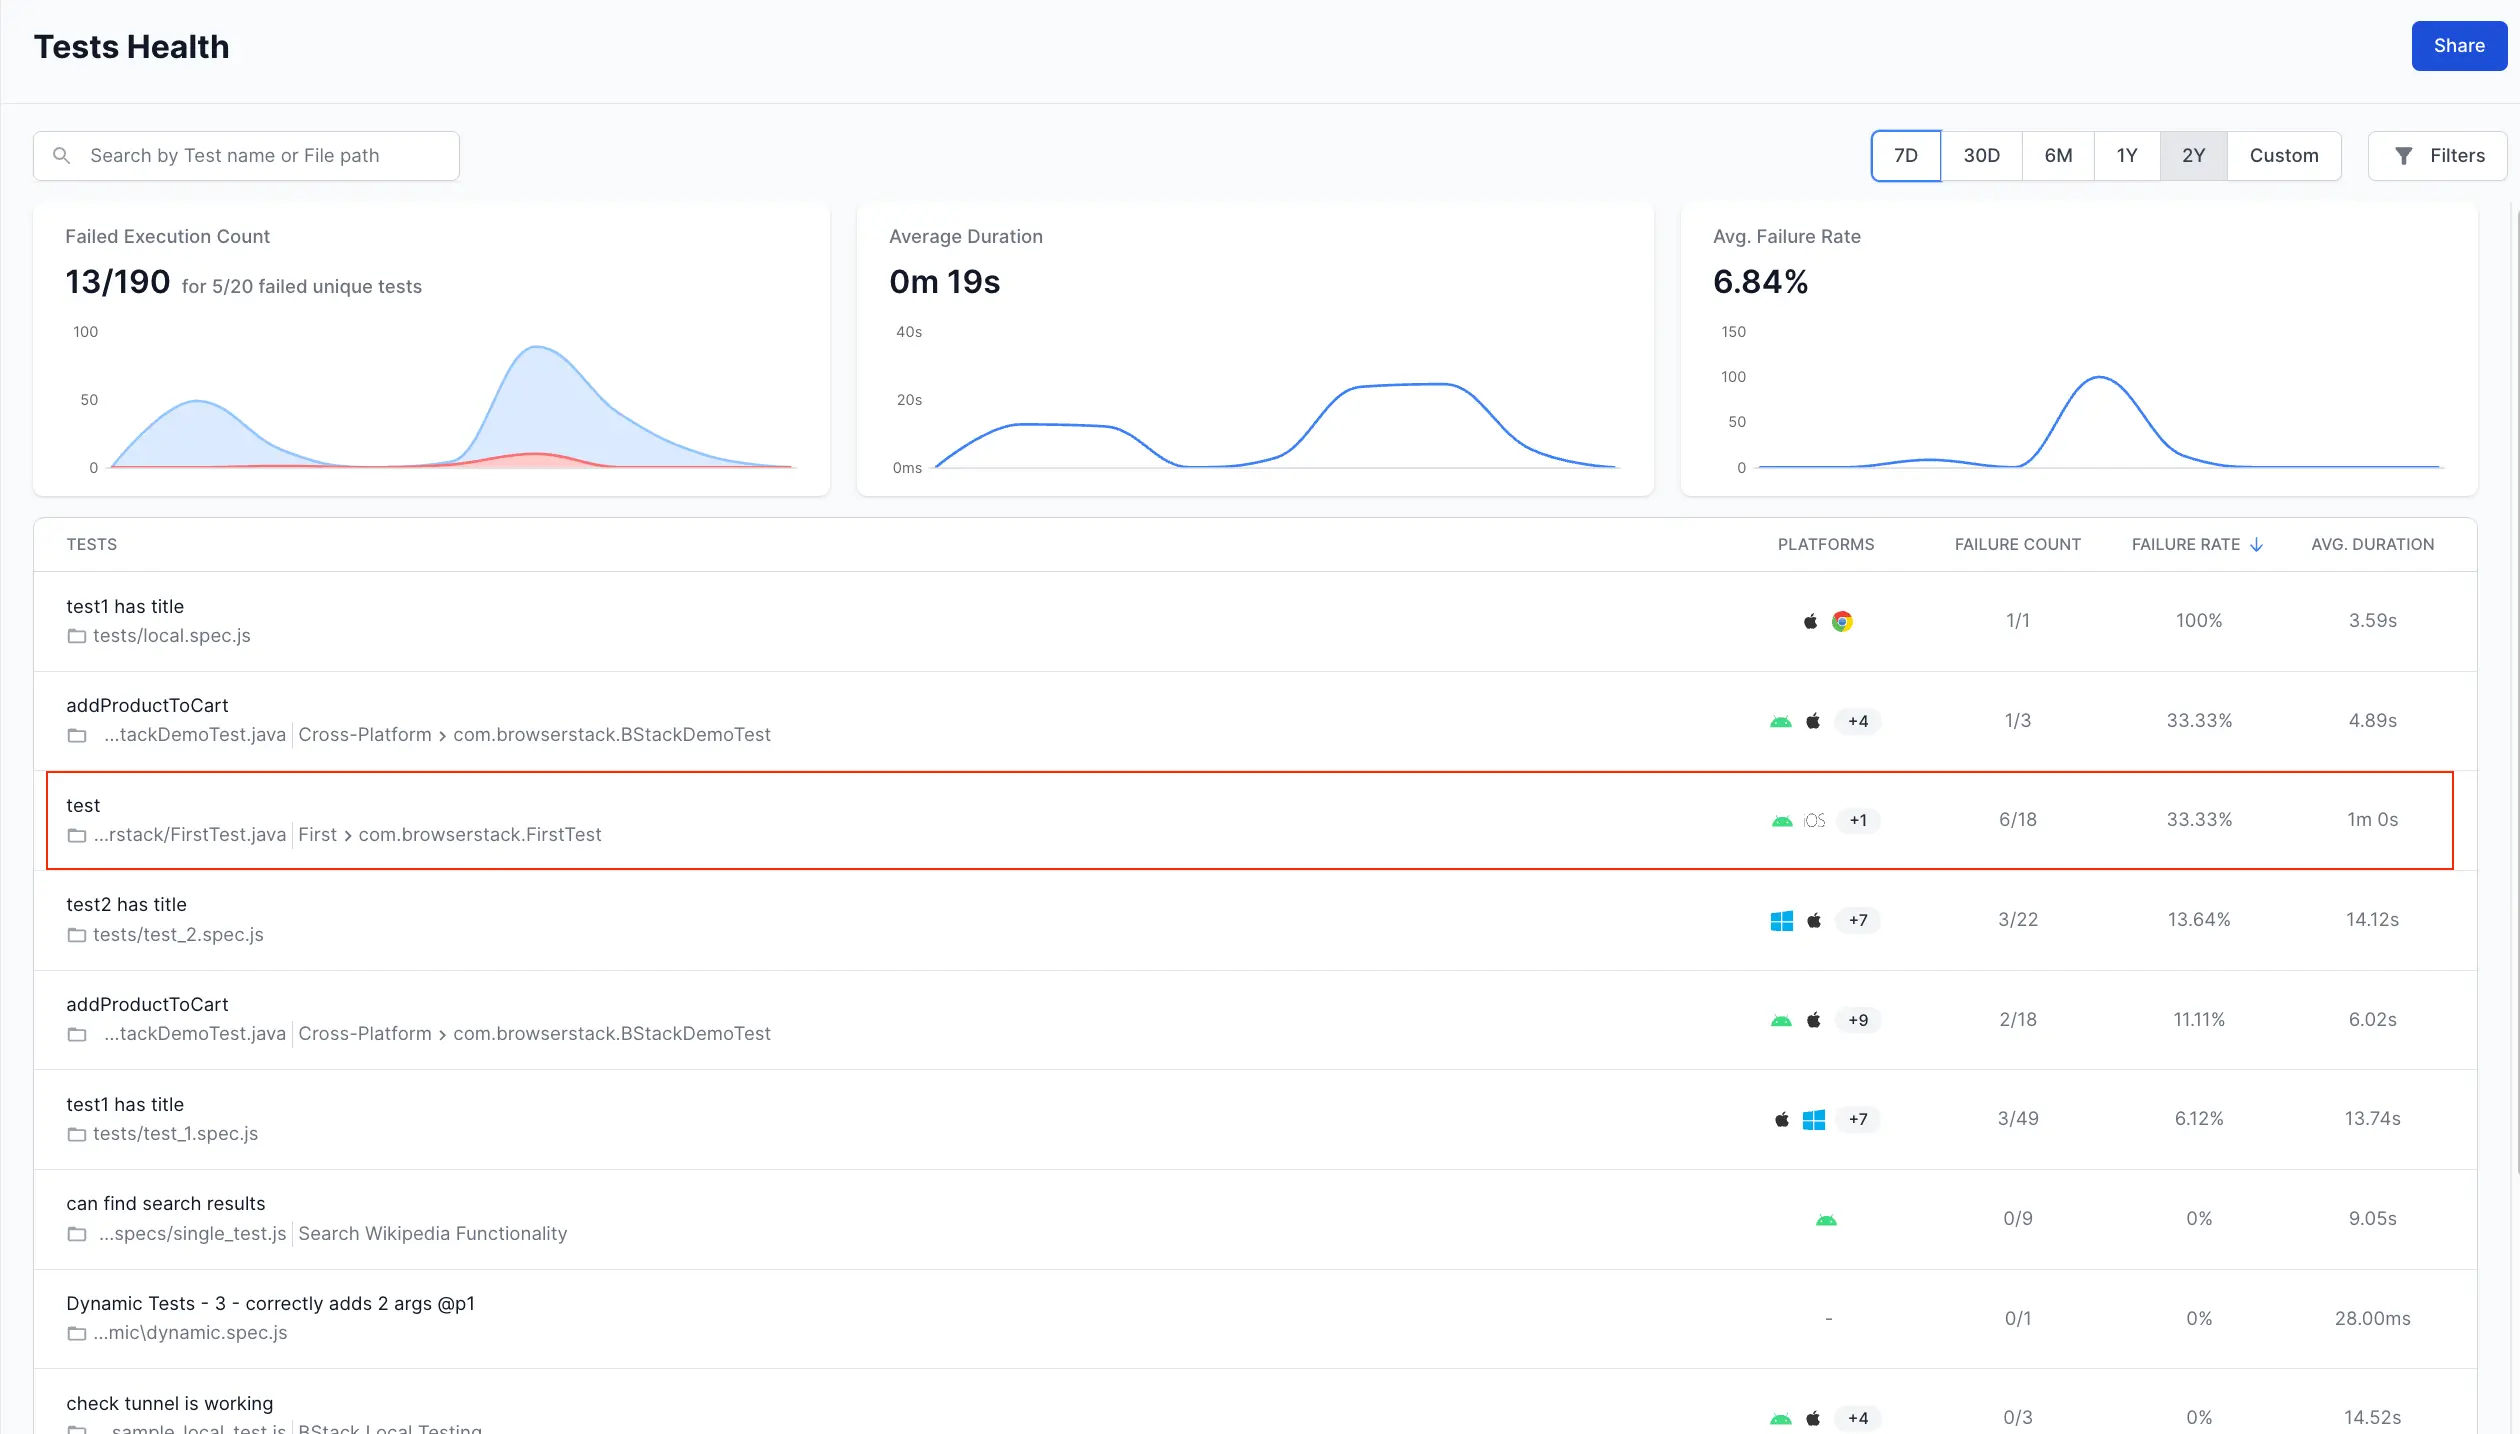
- Select the build for which you want to open Timeline Debugging.
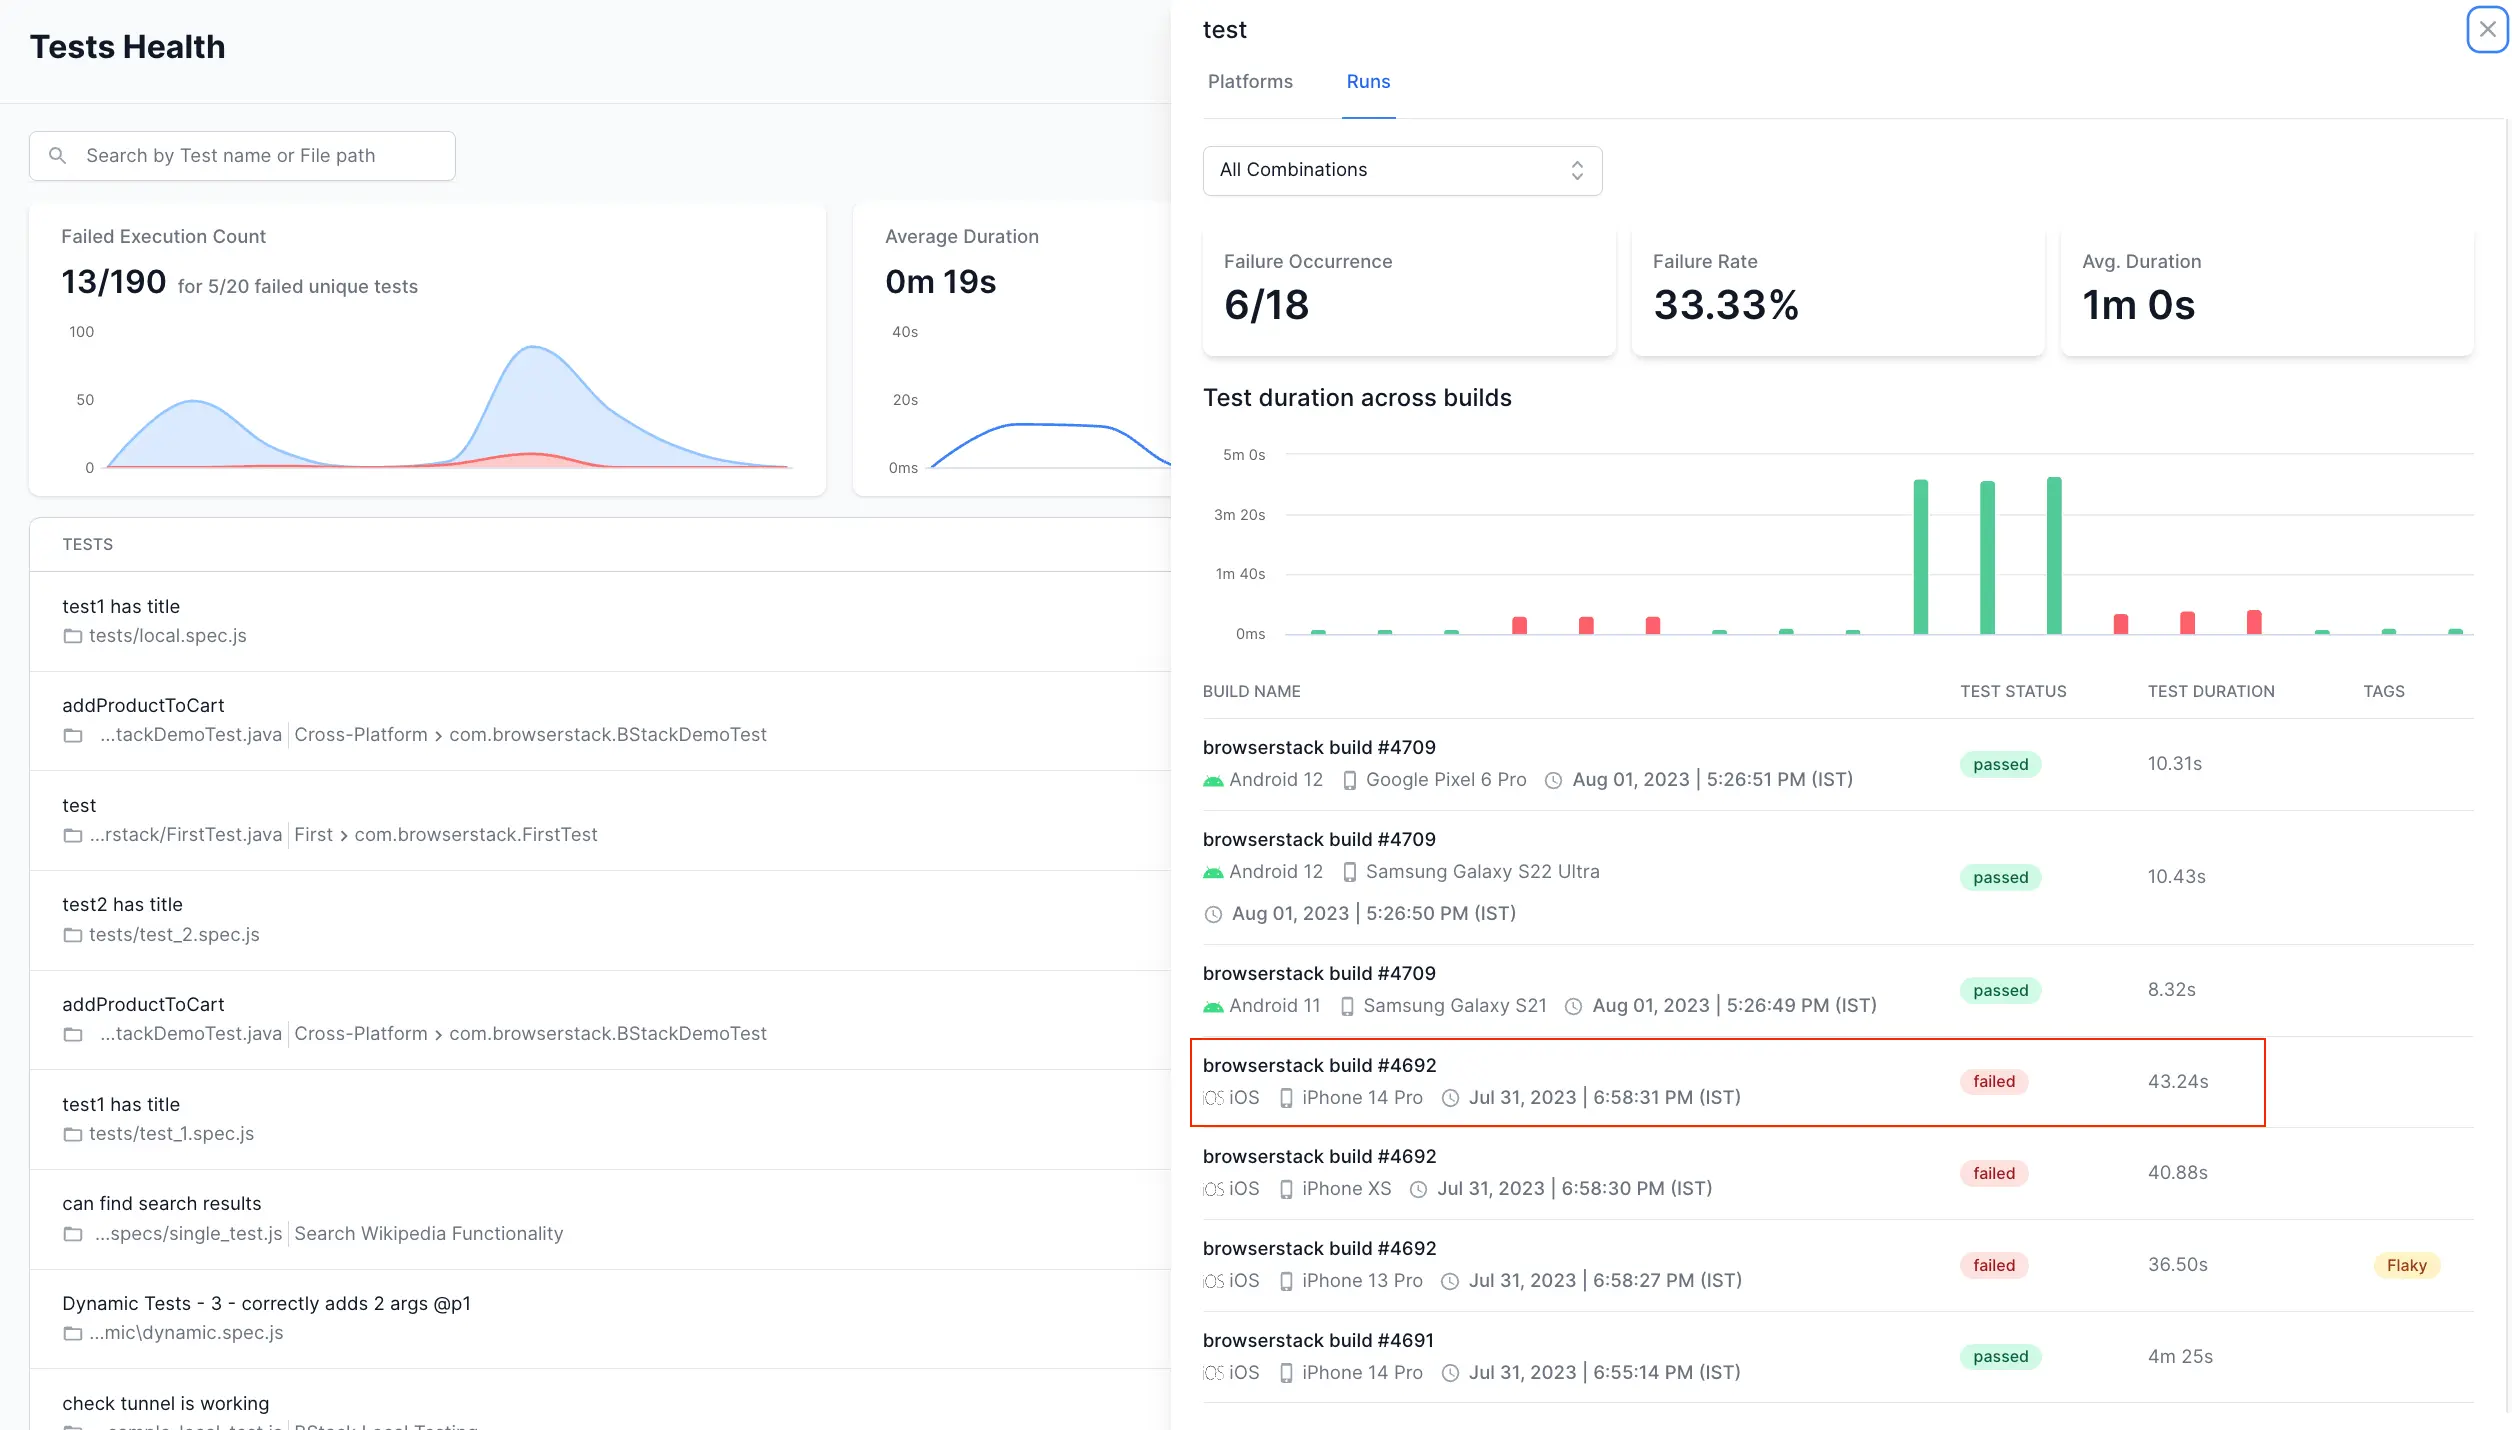
The Timeline Debugging view opens on the right-hand side of your screen.
Navigating to Timeline Debugging from Unique Errors
While in the Unique Errors view:
- Click the error you want to debug and select one of the tests in it.
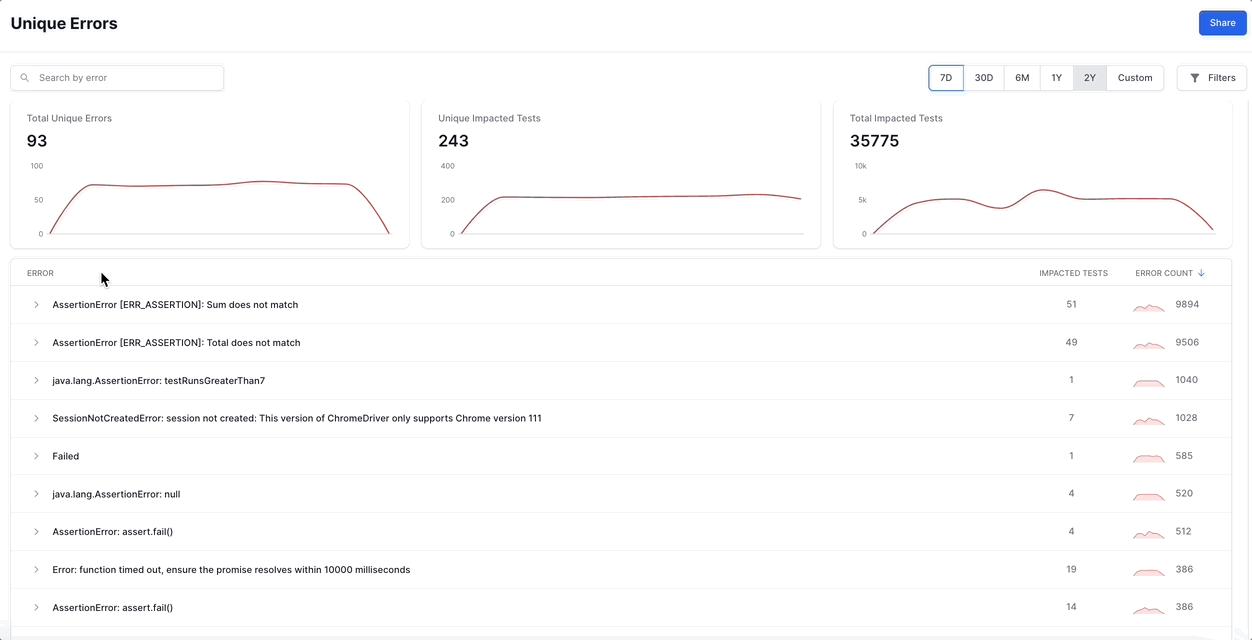
- Select the build for which you want to open Timeline Debugging.
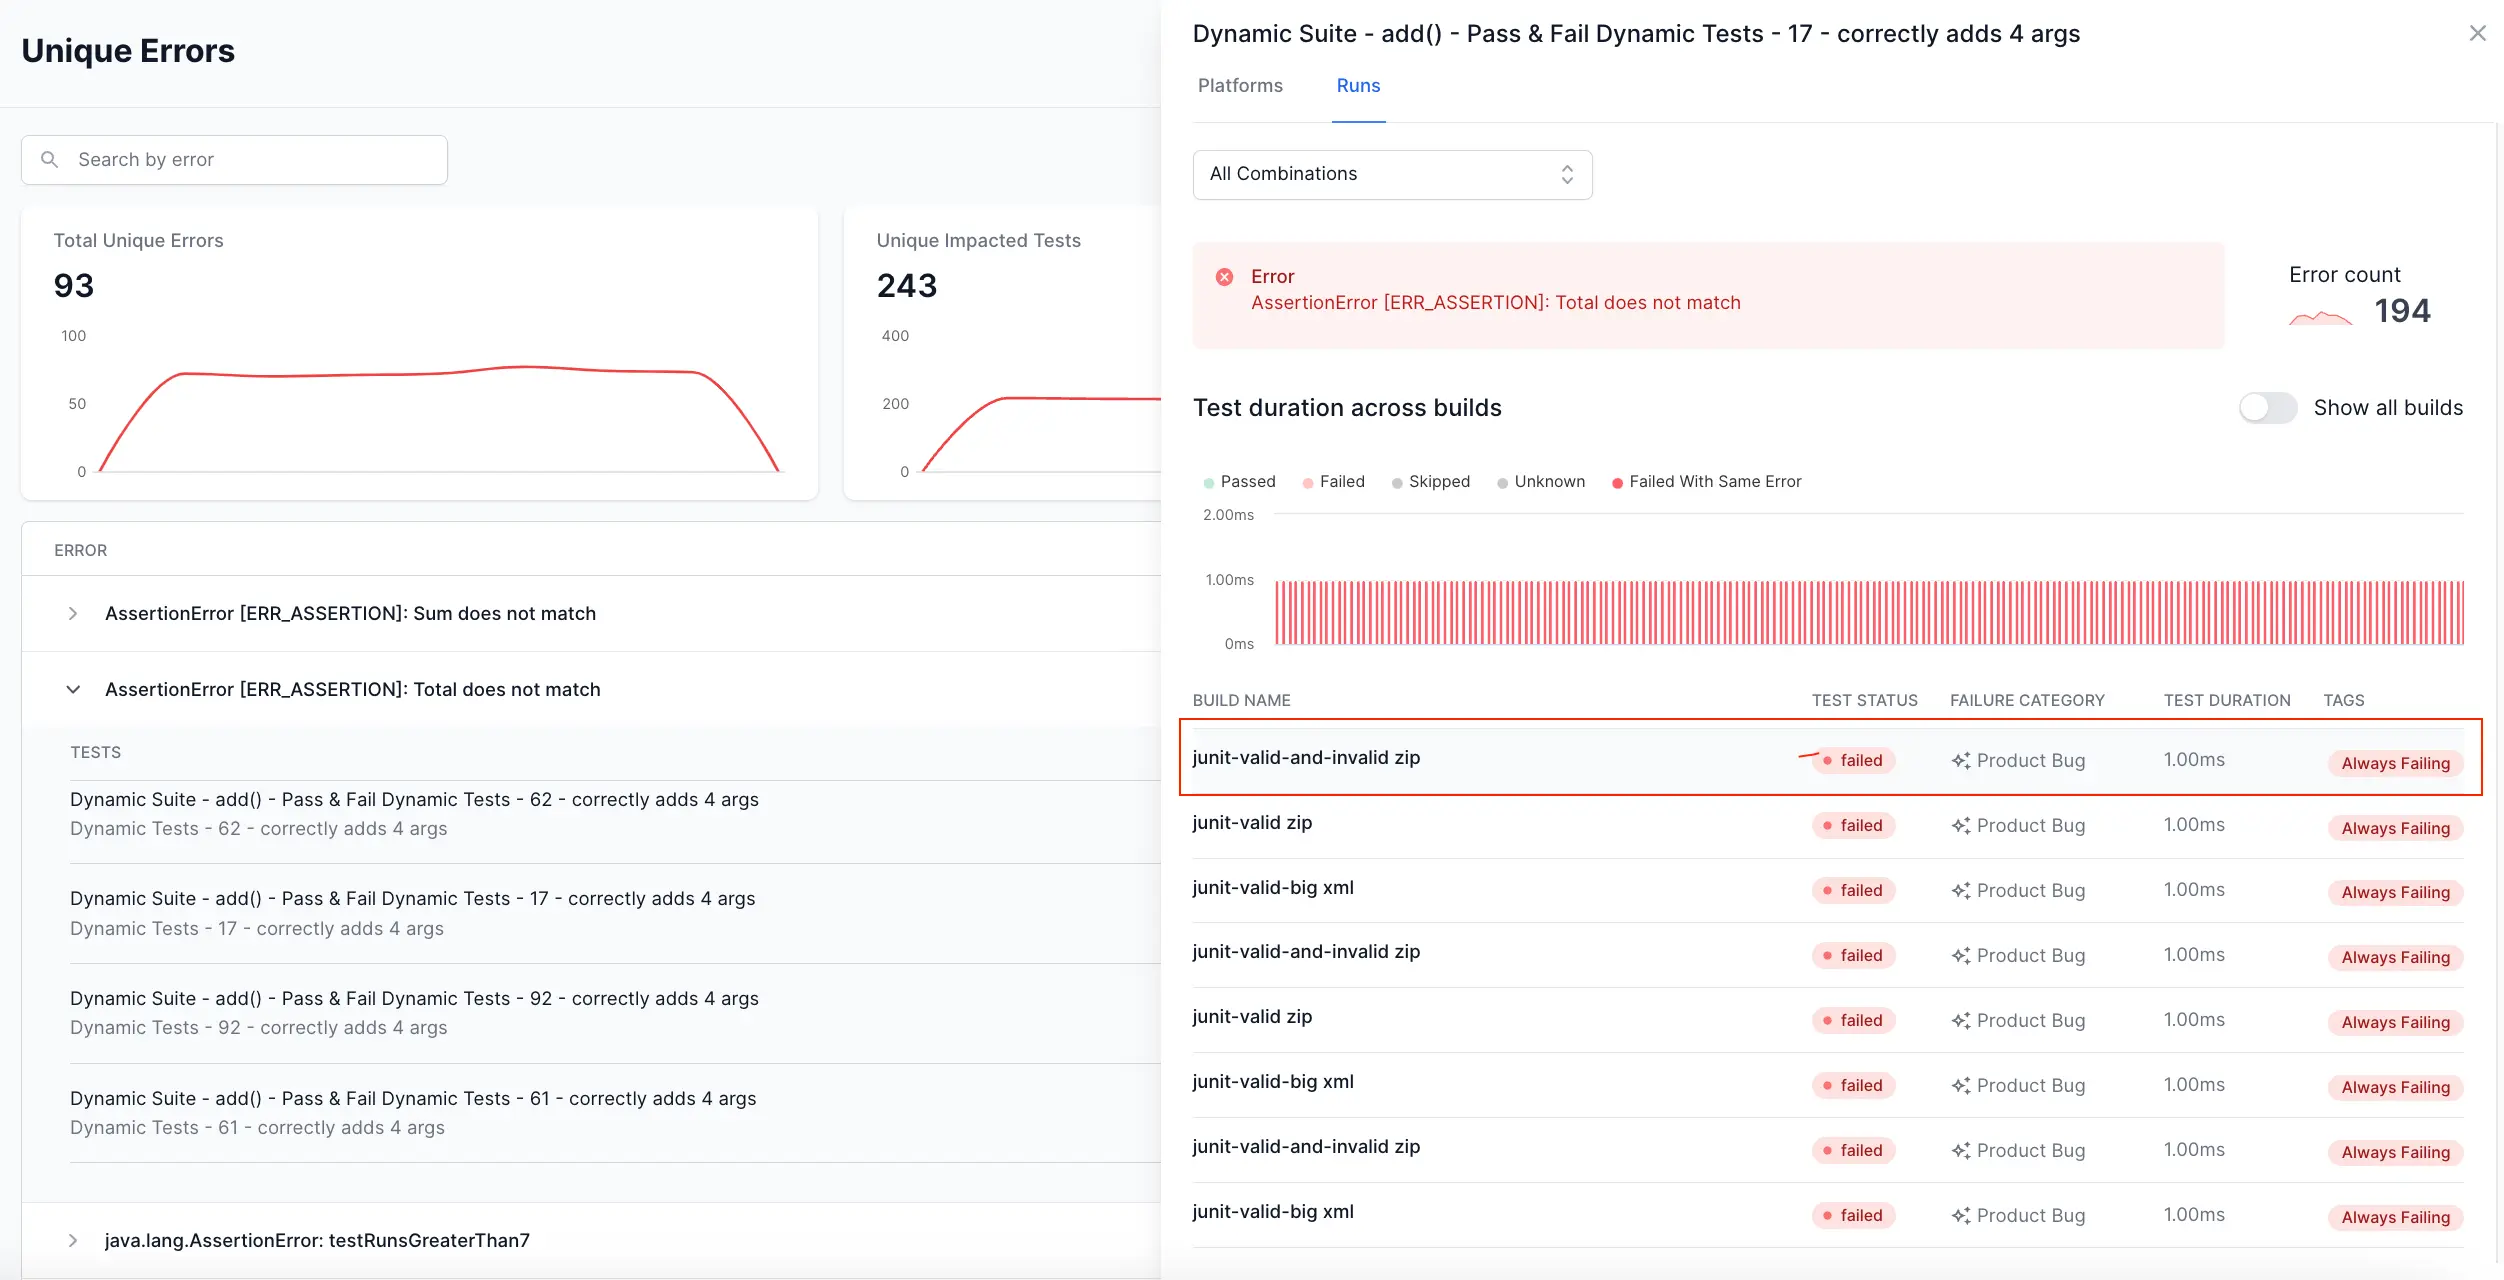
The Timeline Debugging view opens on the right-hand side of your screen.
Deep dive into Timeline Debugging
Let’s look at the capabilities of Timeline Debugging in detail.
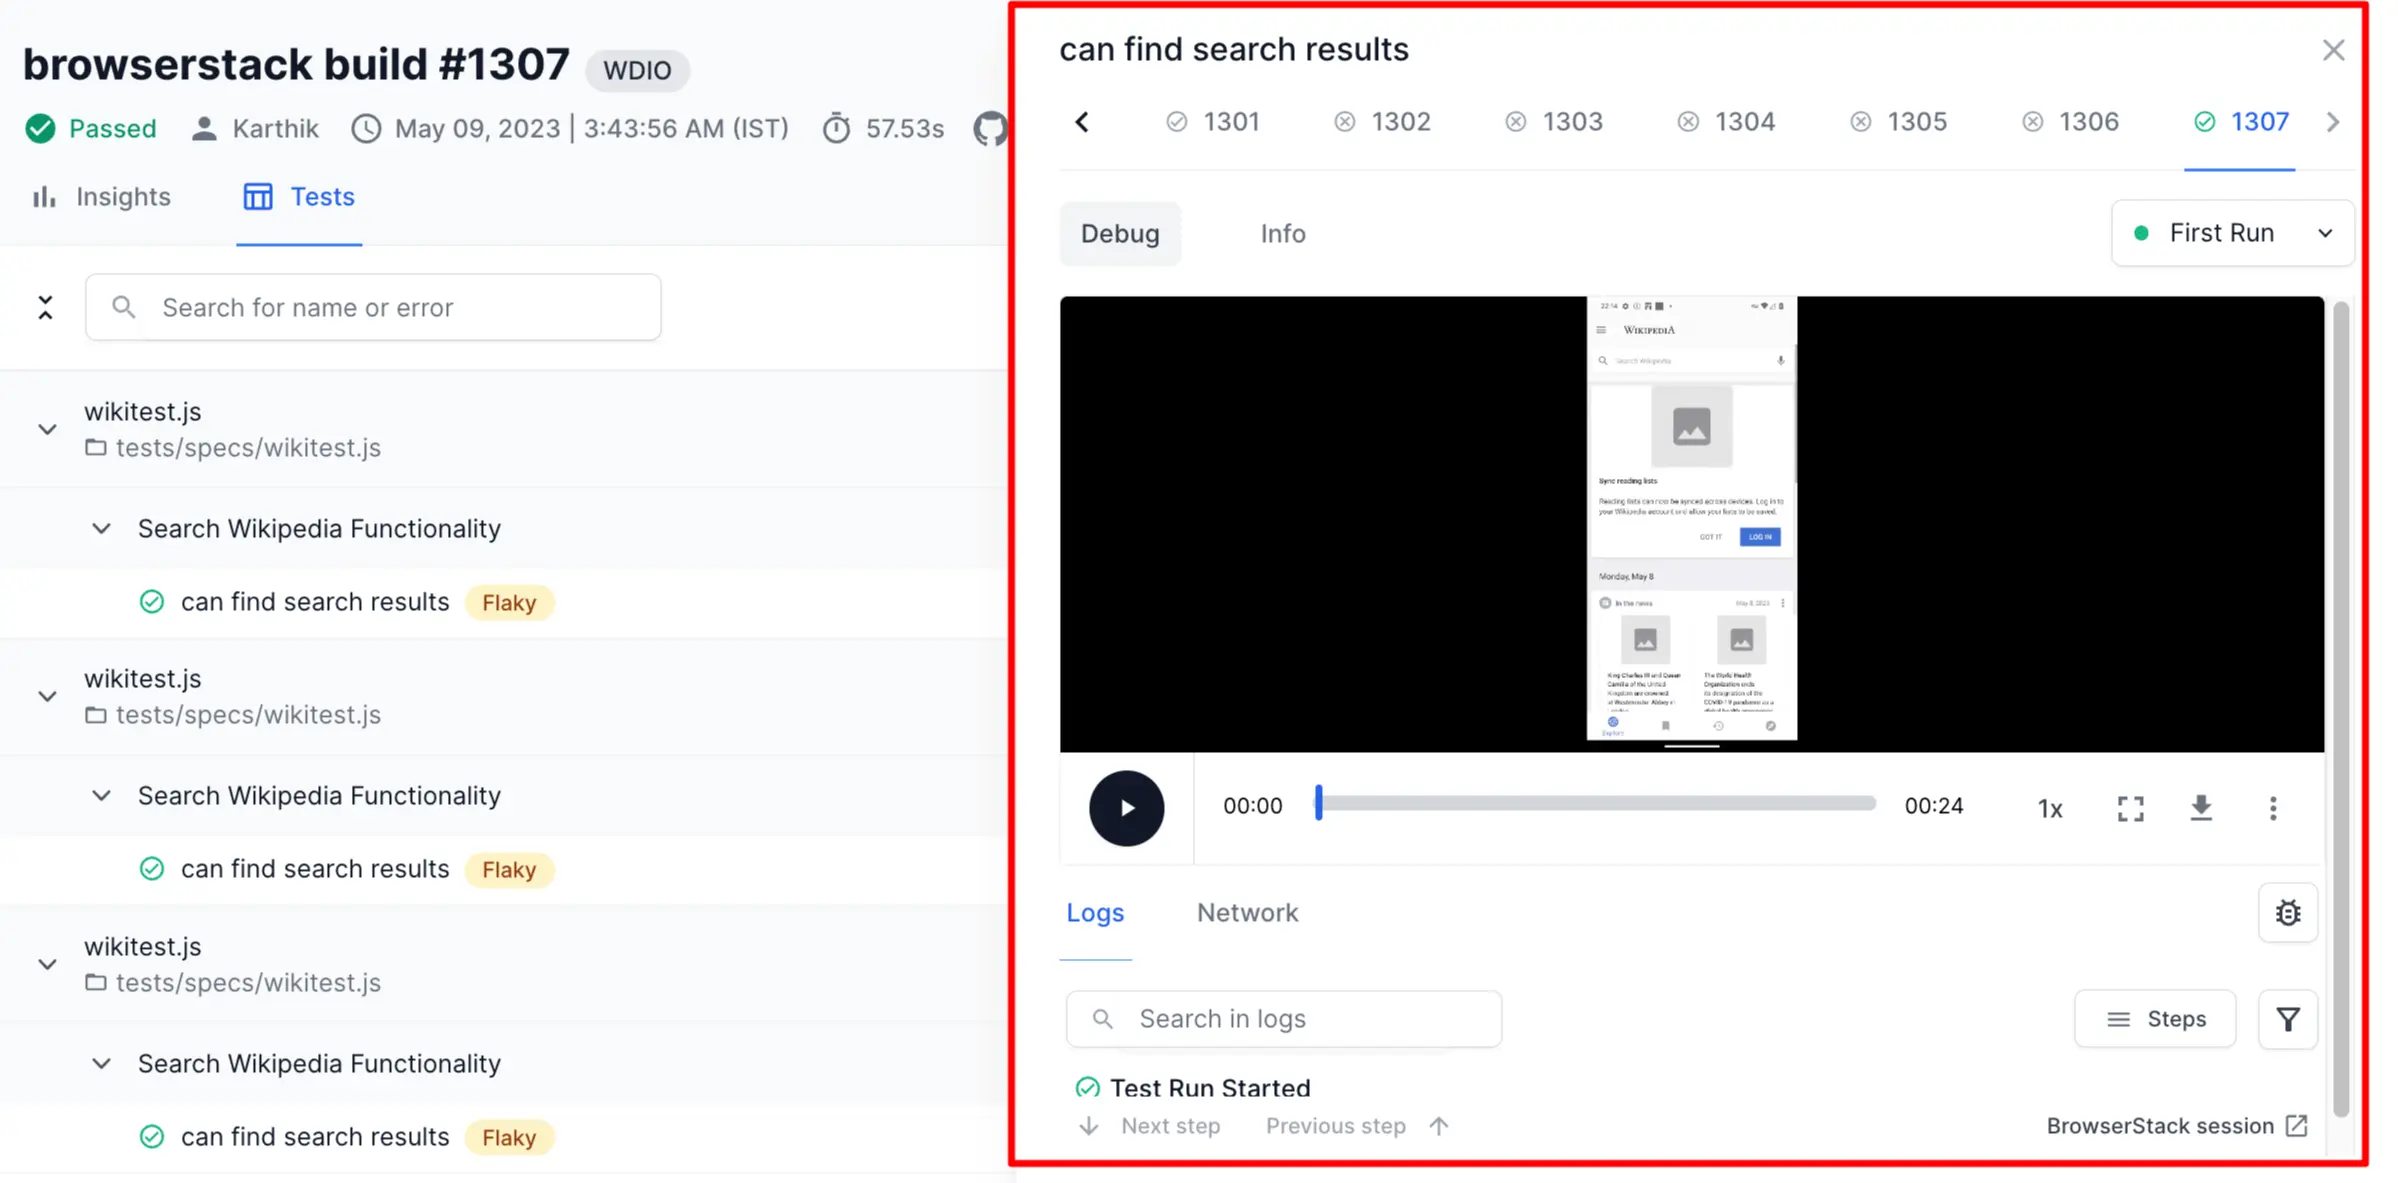
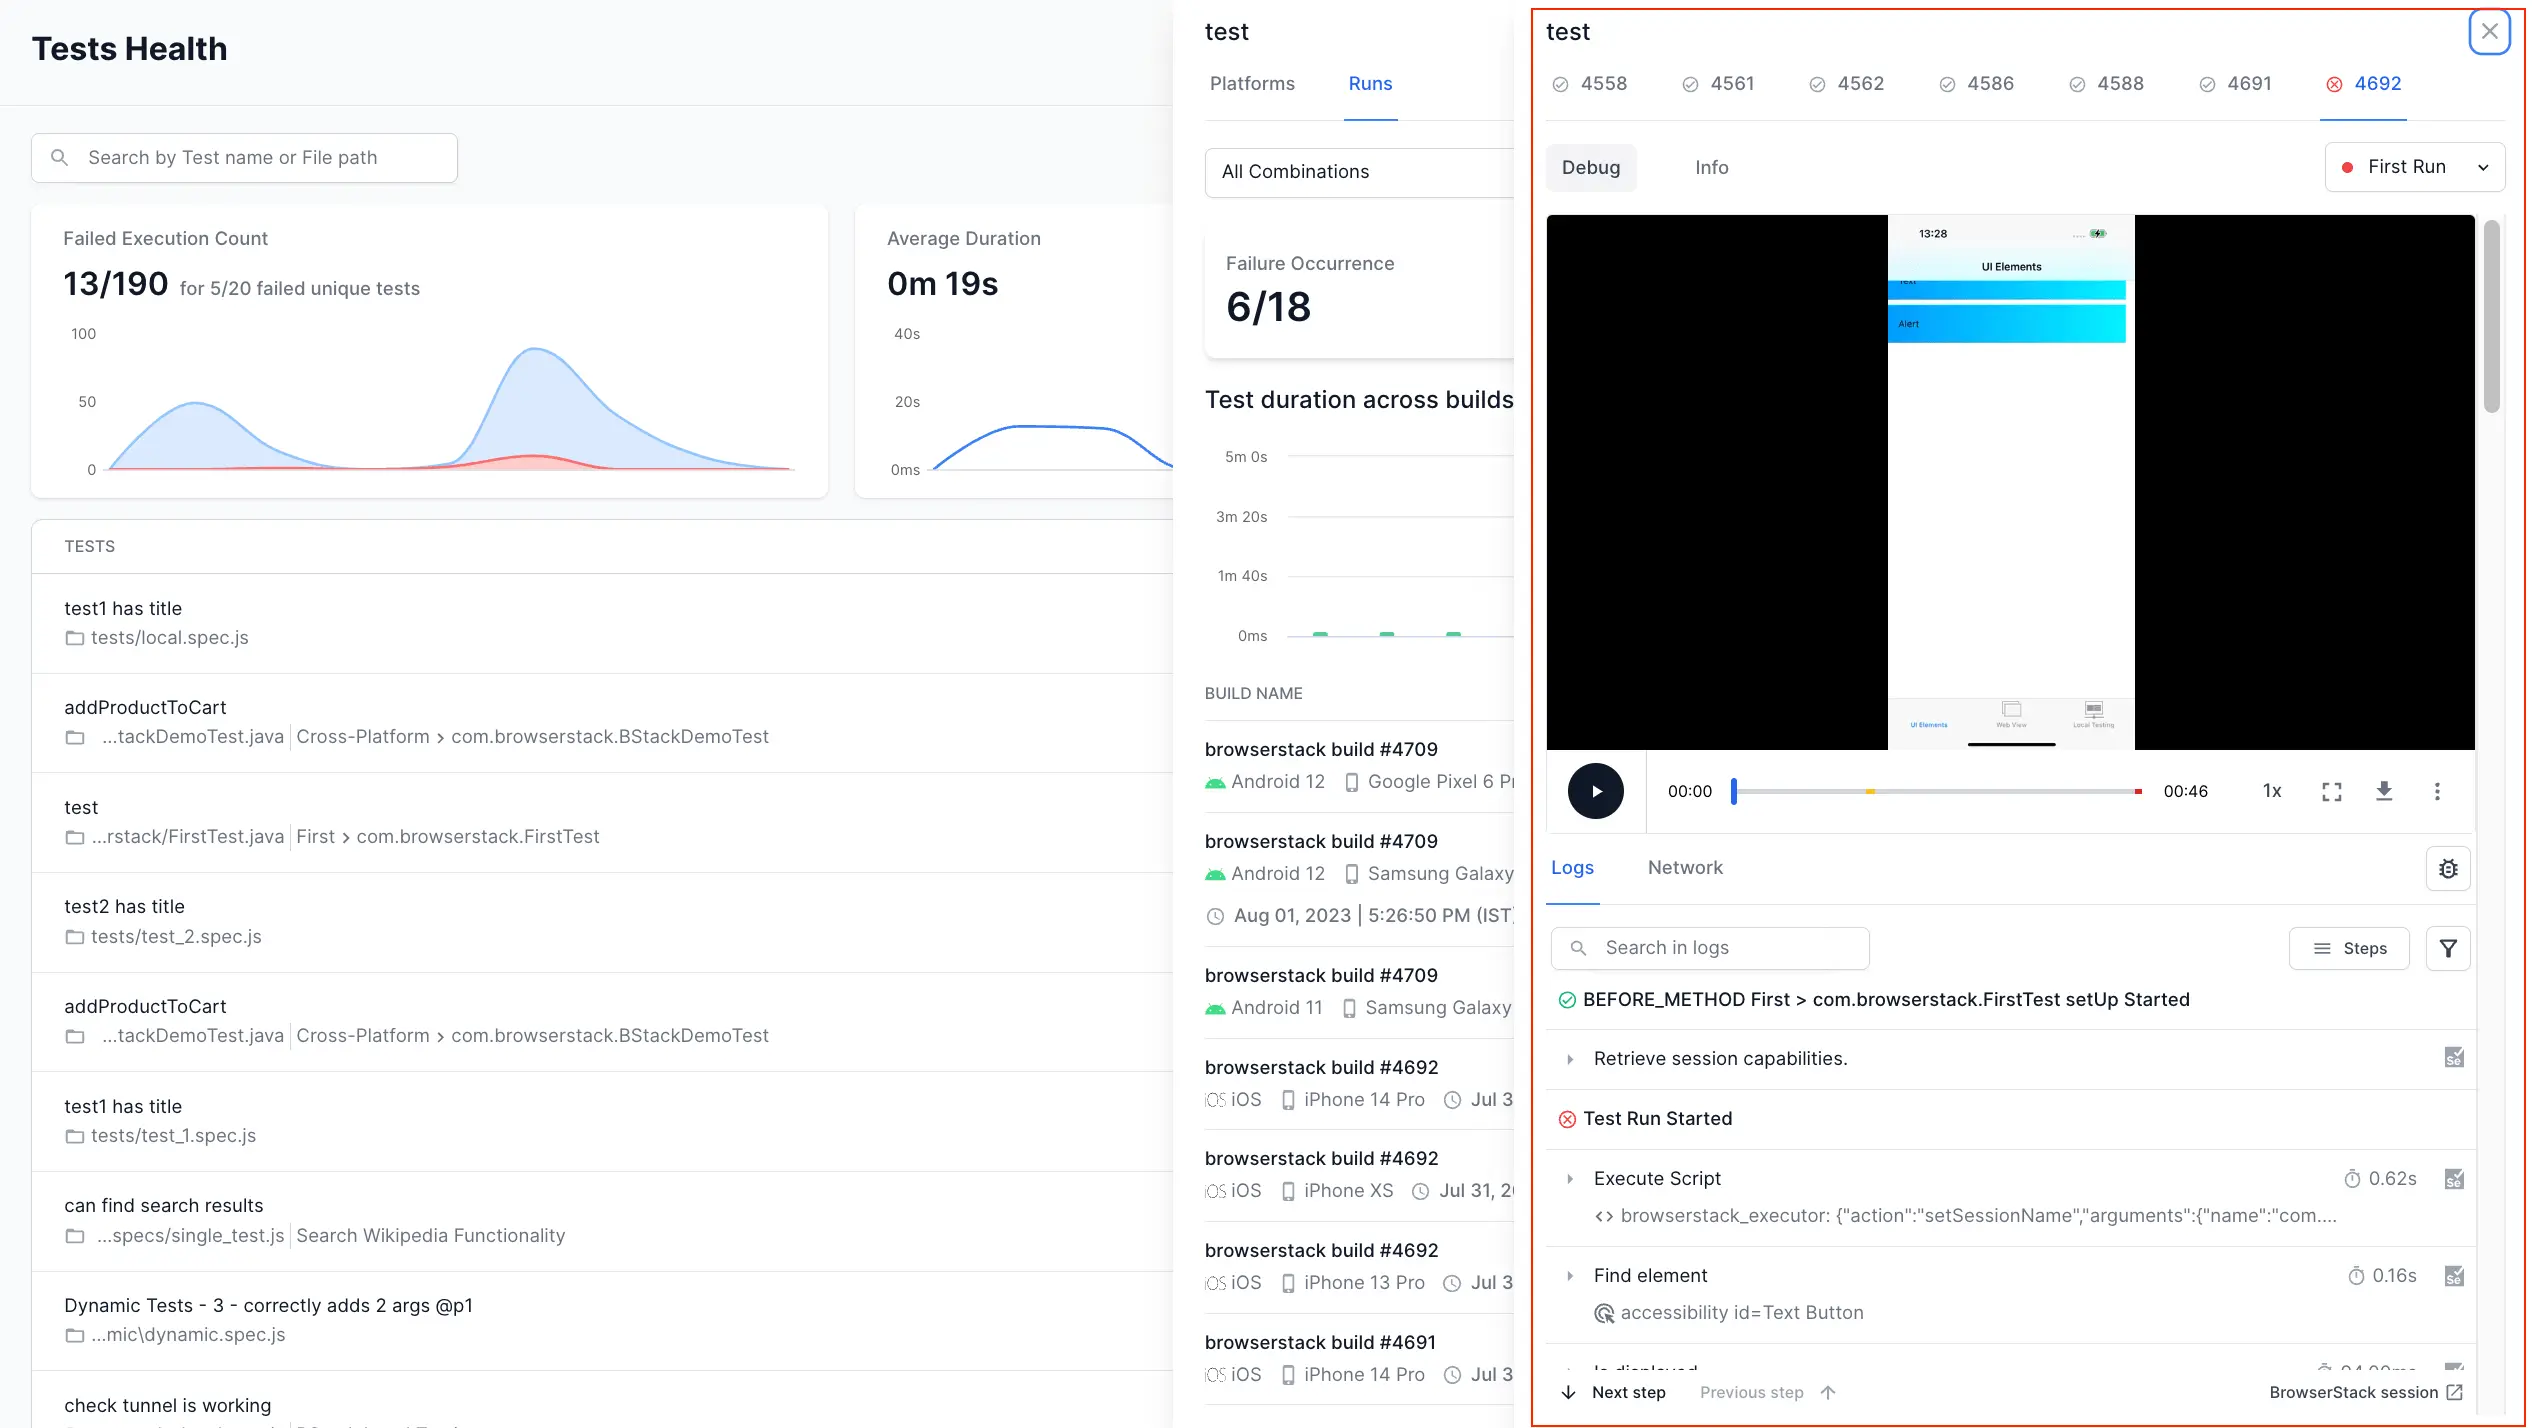
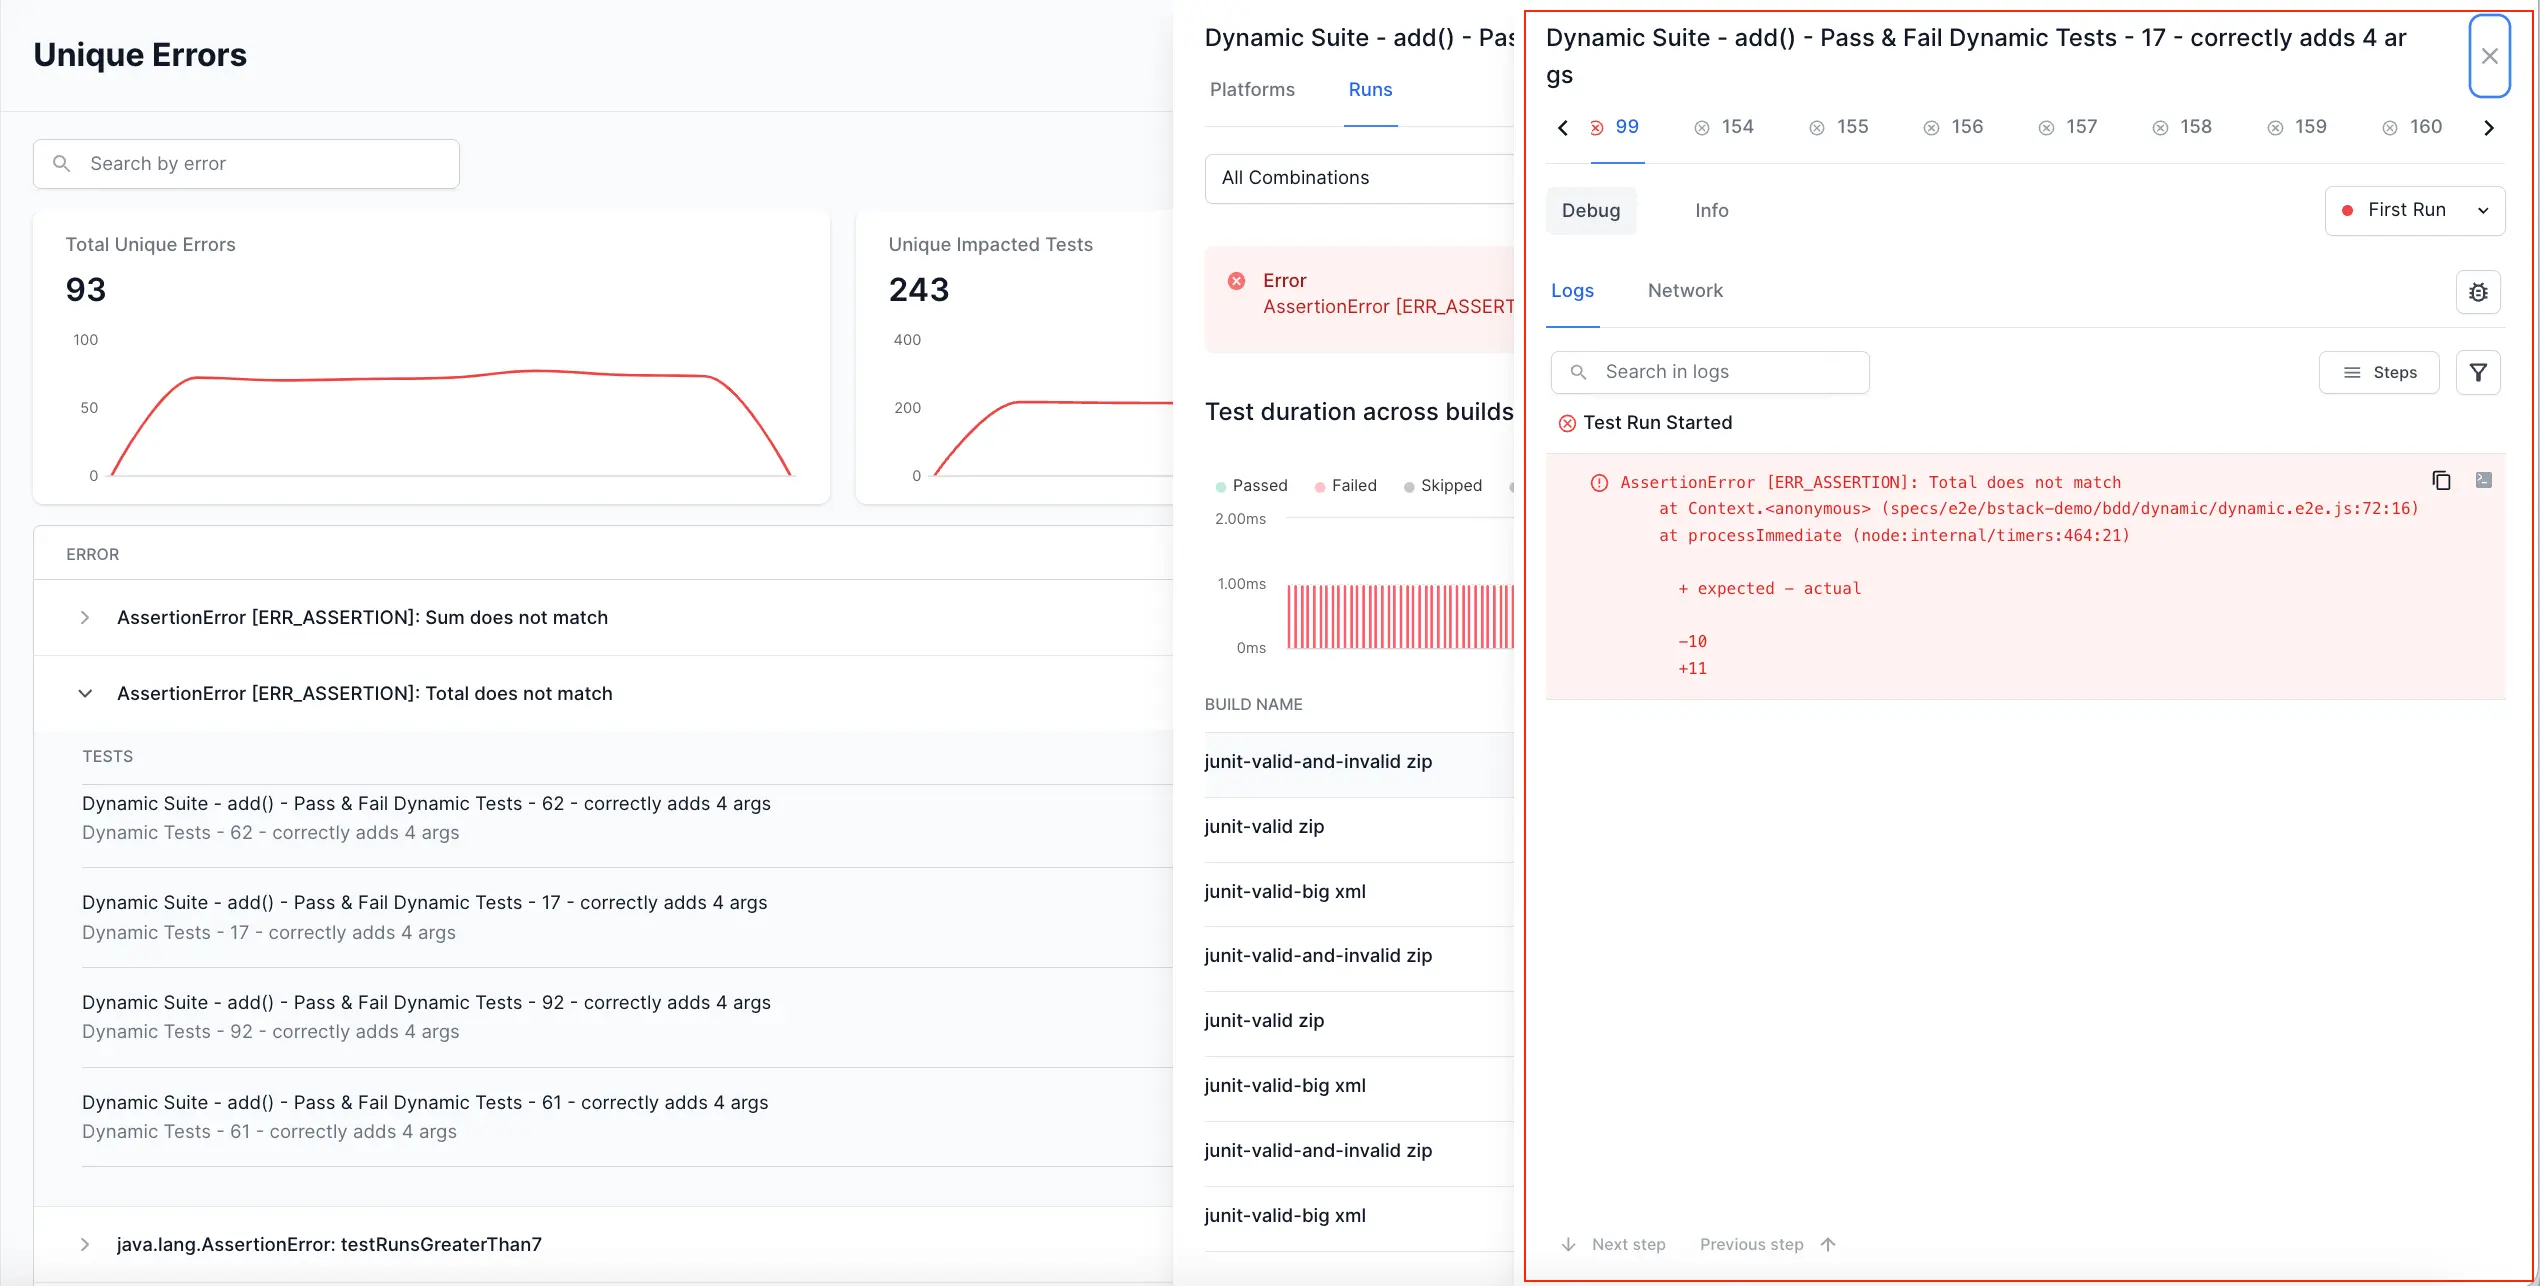
Debug view
When you access the Timeline Debugging feature, the Debug view opens by default. This view provides a comprehensive overview of your test failures, allowing you to debug them effectively. It offers various types of logs, previous test runs, and relevant information about the test, all conveniently accessible in a single location. By utilizing this view, you can make well-informed decisions to enhance your test suite.
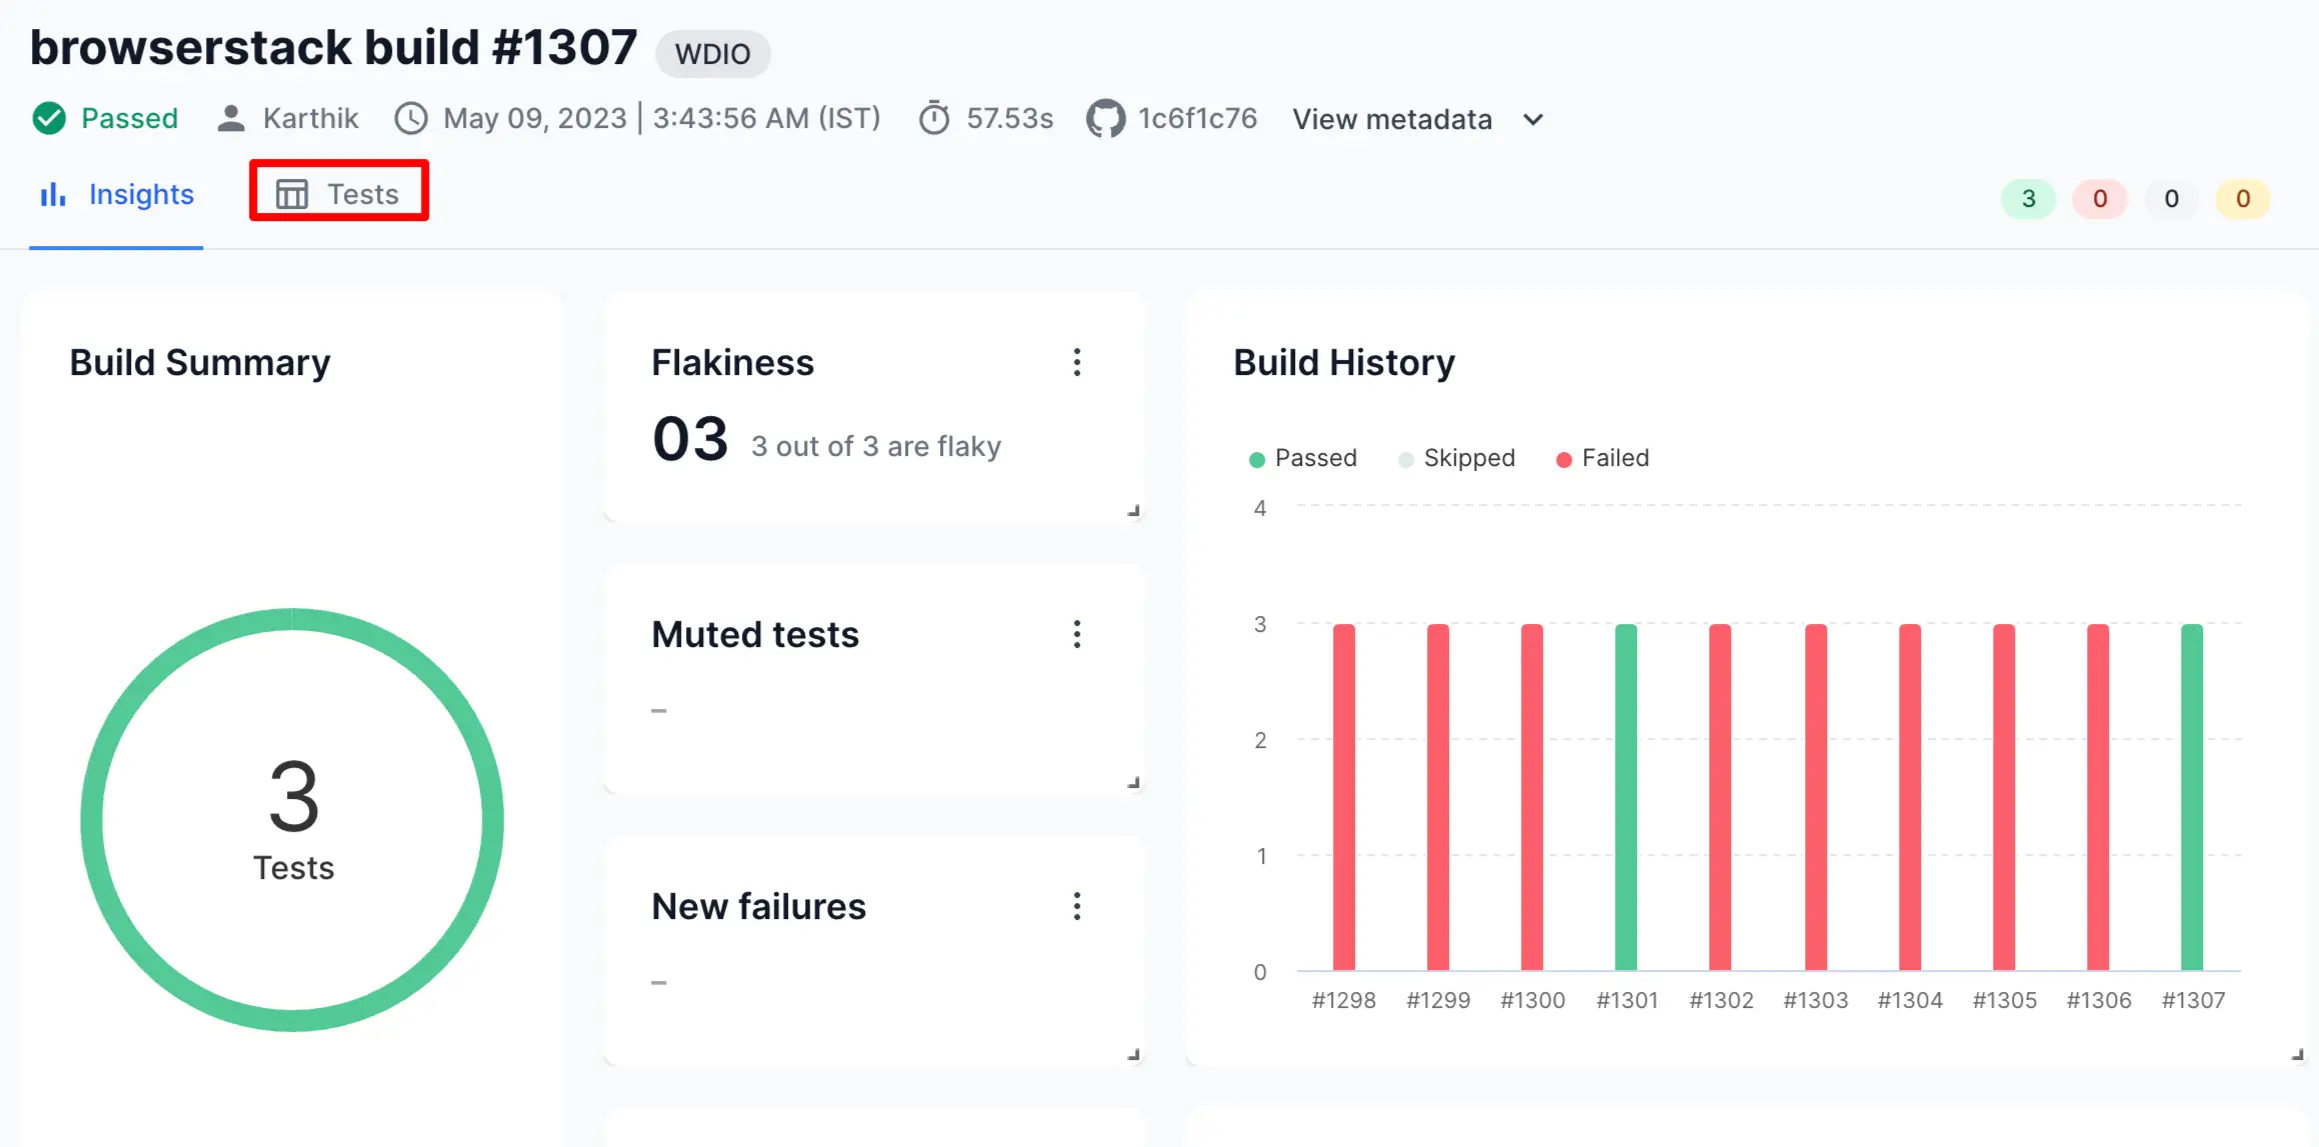
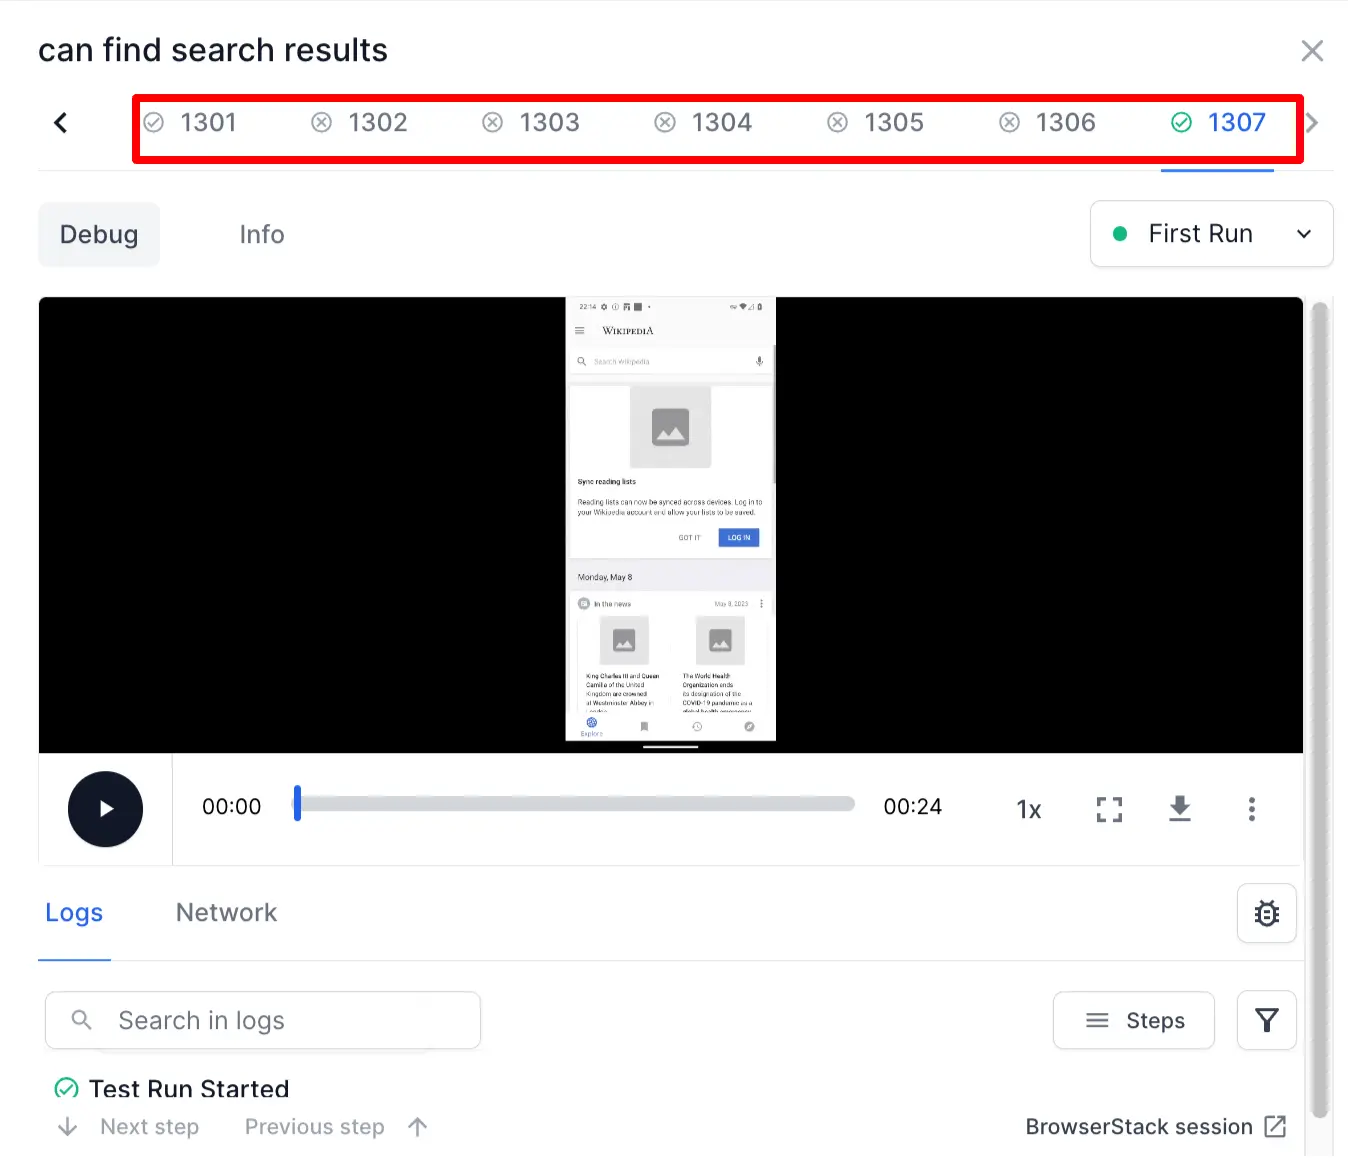
Historical test runs
In addition to seeing the test run in a timeline, you can also go back in time to see the previous runs of a test case. This feature allows you to understand the context of a test by examining its past runs. By easily switching between the latest and earlier test runs, you can save time and effort in figuring out why a test is failing and take the appropriate corrective measures.
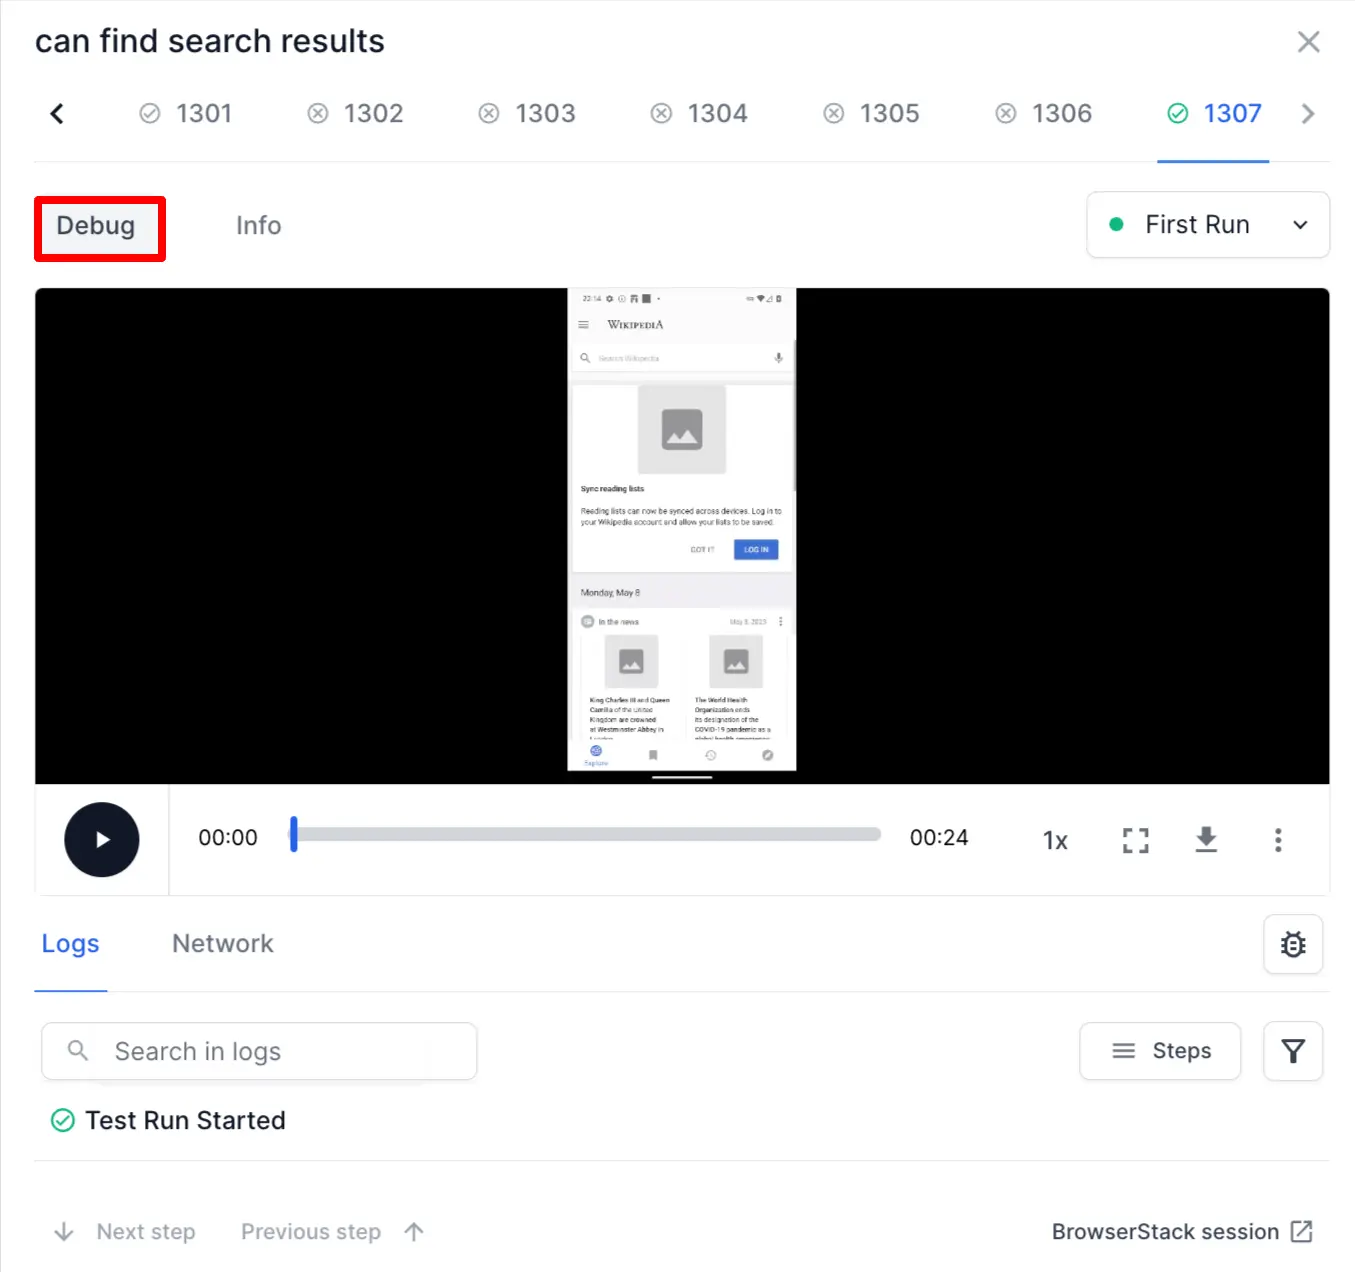
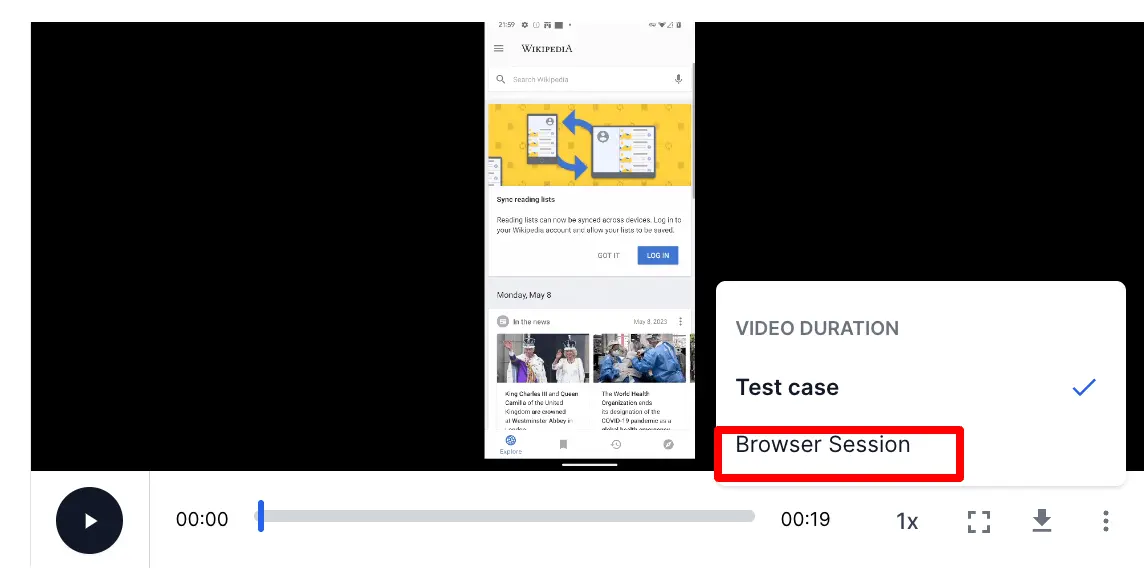
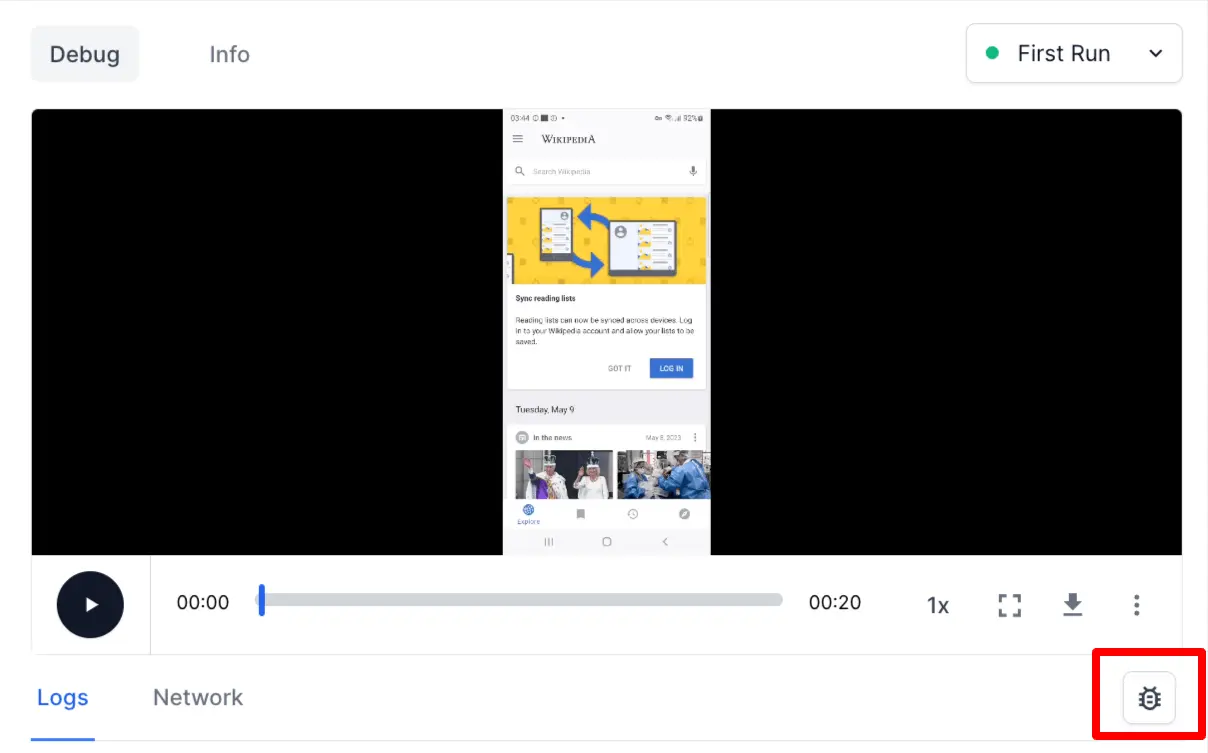
Video log
Test Reporting & Analytics provides access to video recordings of your test runs. You can watch video logs in full screen or download them for reference.
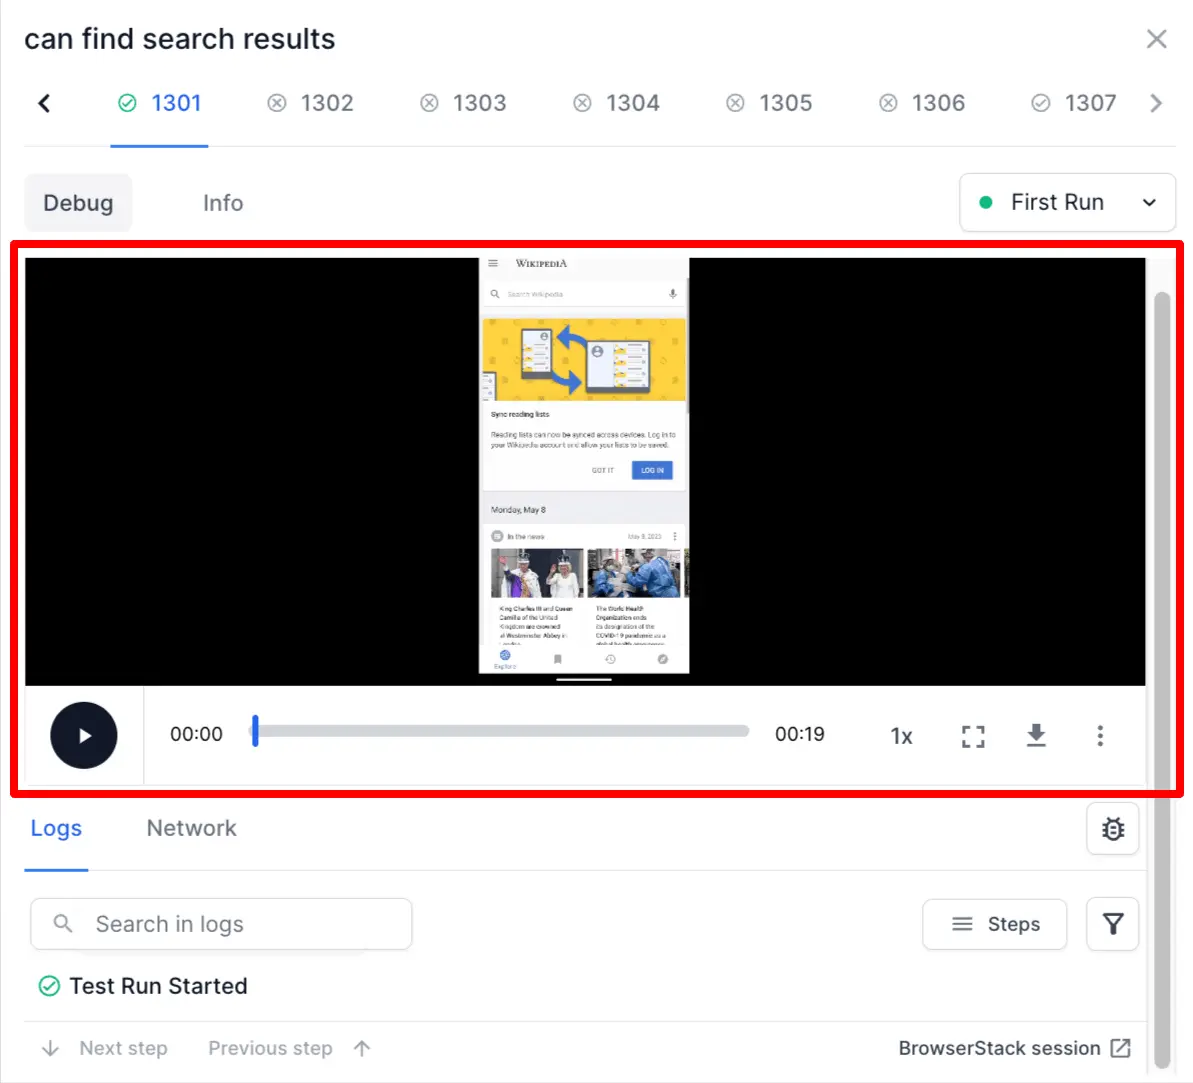
By default, the video player plays the video recording for the test case alone. If you like to view the video of the complete browser or app session (which could have multiple tests), you can switch to the Browser Session view.
Video logs are available only for tests run on BrowserStack Automate or App Automate.
Test view and Session view
You can switch between Test view and Session view while viewing the logs.
The Test view is the default view that lists all the logs specific to that particular test. This view is present regardless of where your tests run.
If your tests ran on BrowserStack Automate or App Automate, the Session view lets you view the logs from all tests that were run on that particular session.

View the test steps
Clicking the Steps button will open a list with the test steps. To quickly jump to a particular step on the timeline, click on that step.
This feature is especially helpful in Cucumber tests, which inherently use a step-based architecture.
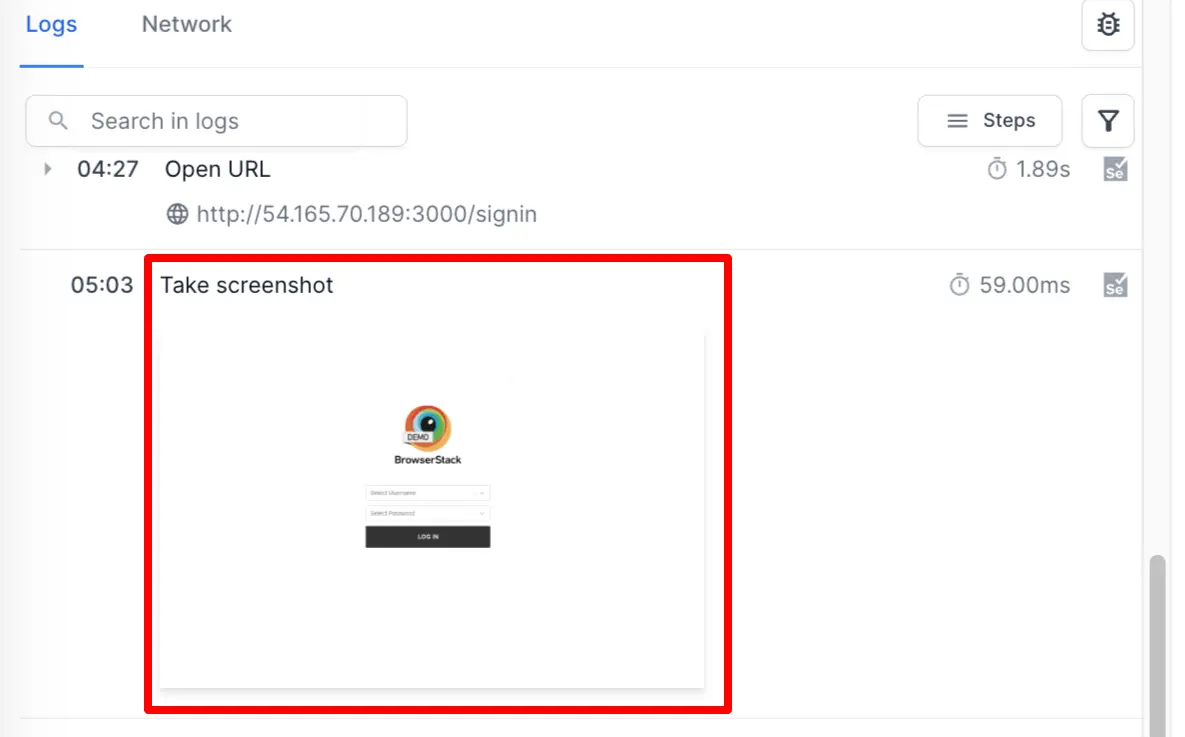
Screenshots in your test logs
You can also view the screenshots included in your test case, right on the timeline.
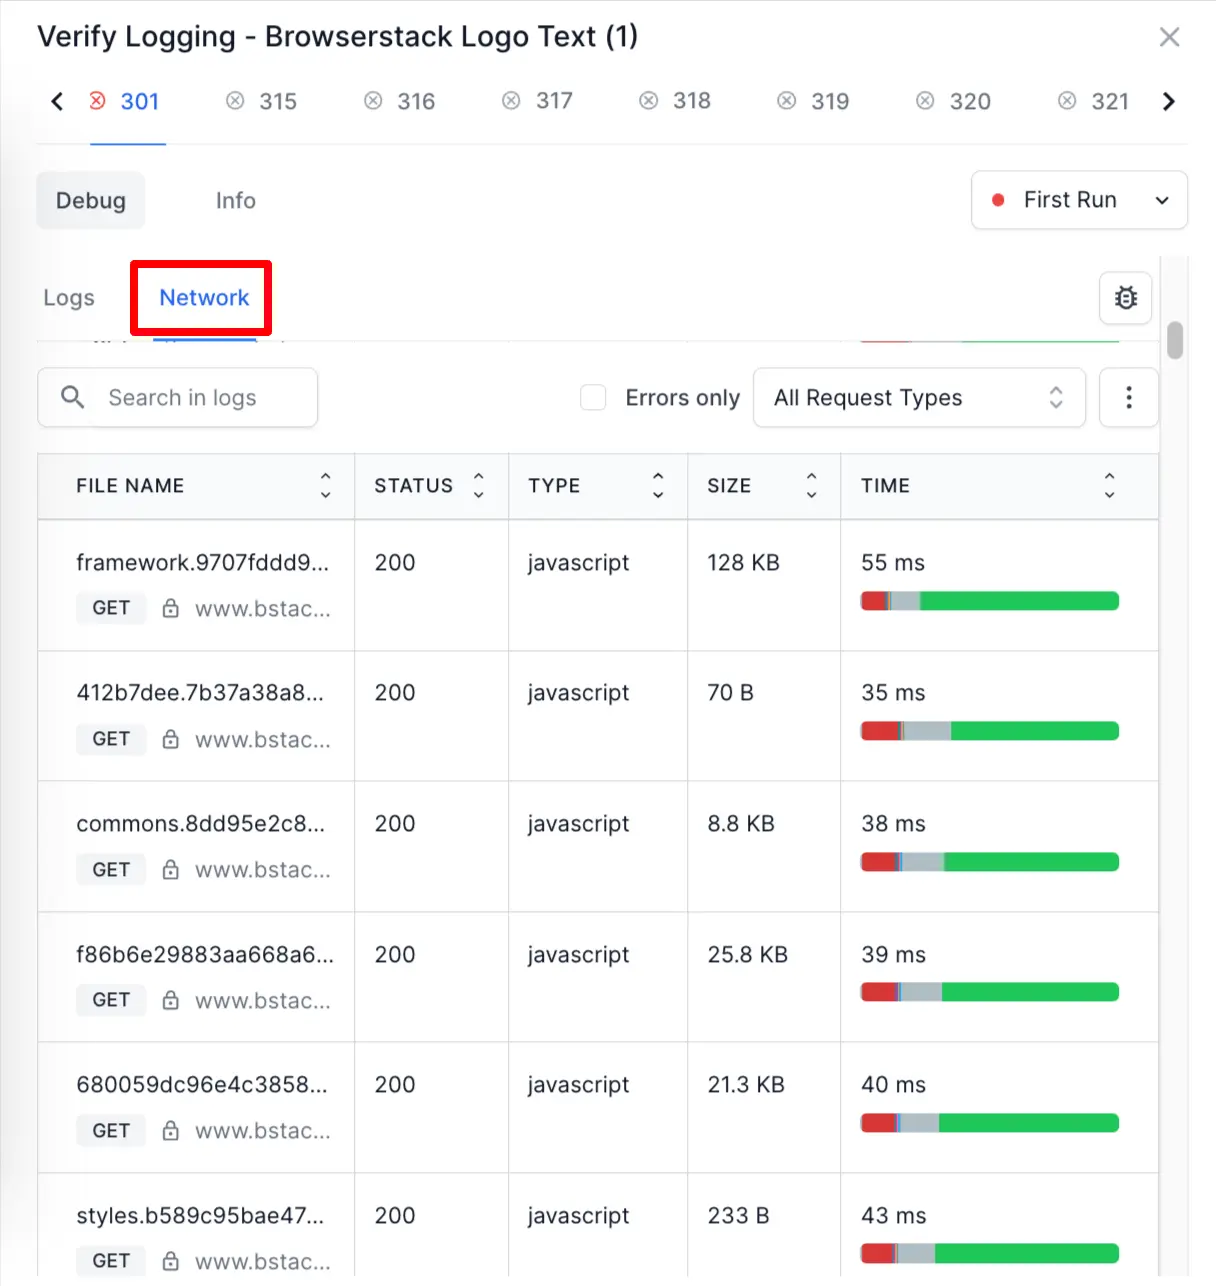
View different types of logs
Timeline Debugging lists all the different types of logs together so that you can view them side-by-side. To view the network logs separately, you can click on the Network tab.
You can use filters under the Logs tab to view specific types of errors. You can also use the search widget to find a particular step or error quickly.
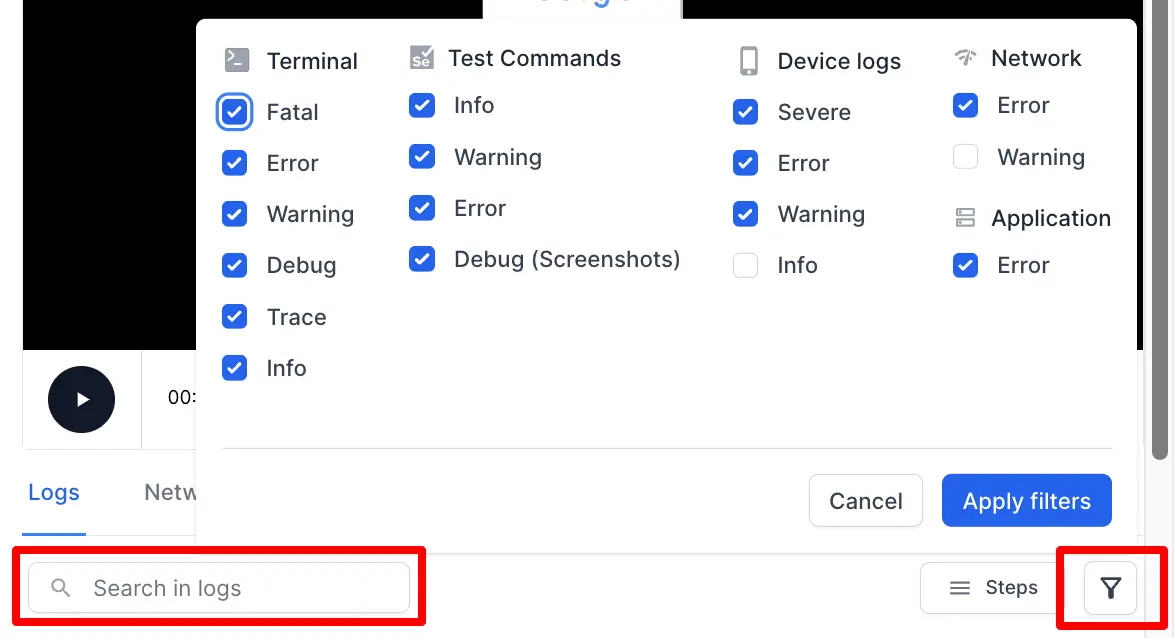
Using these filters, you can choose to view errors related to terminal commands, test frameworks, devices, and networks separately. You can further filter out errors according to the type or severity. For example, you can ignore Warning and Info messages and focus only on Fatal or Severe errors.
Application logs
The filter Application lets you view your backend application logs on Test Reporting & Analytics. To enable this feature, you must integrate your application logs collector with Test Reporting & Analytics.
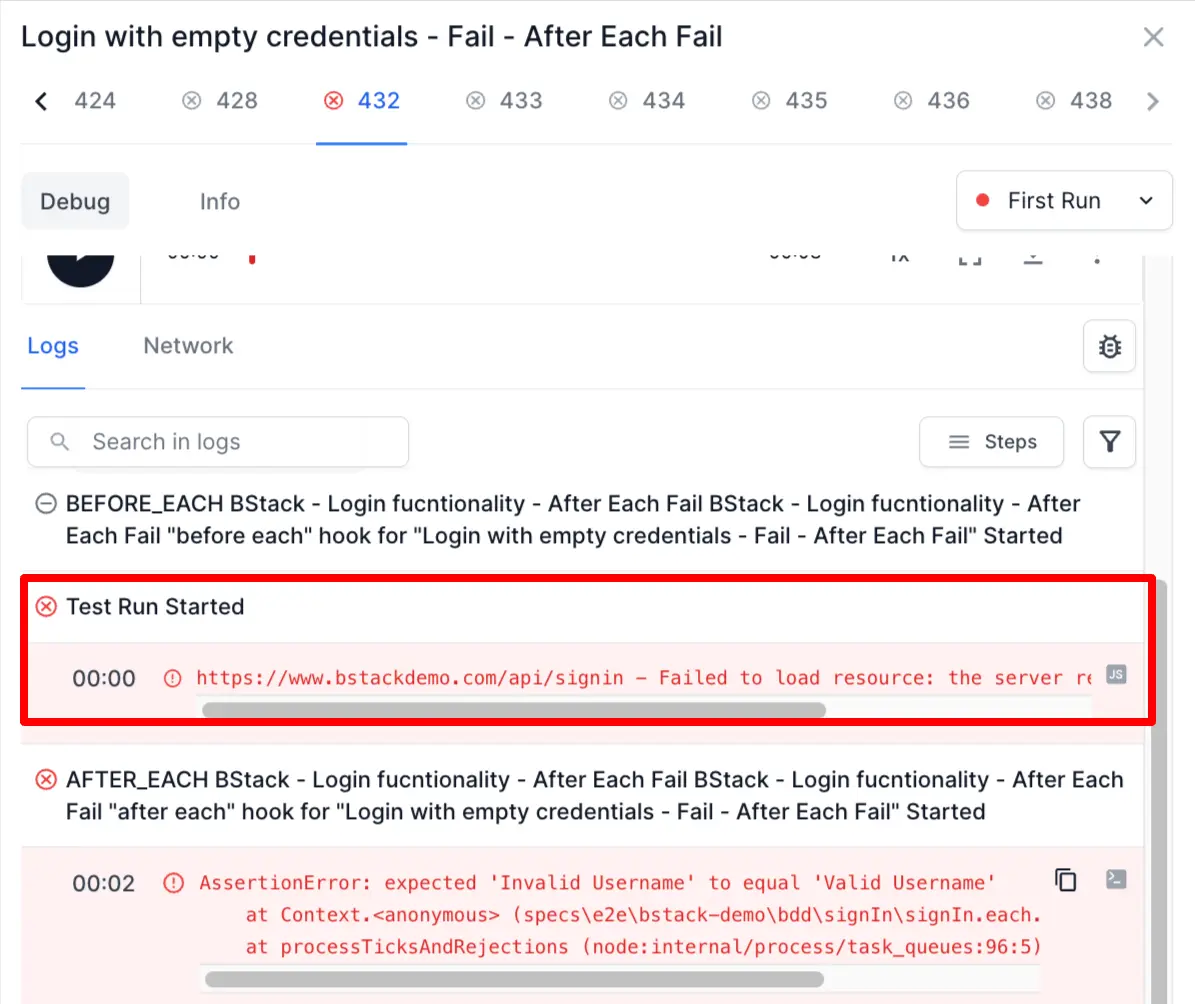
In the following example, you can see the application logs on the timeline view. With the logs from the application directly available, you can precisely debug issues and fix test failures easily.
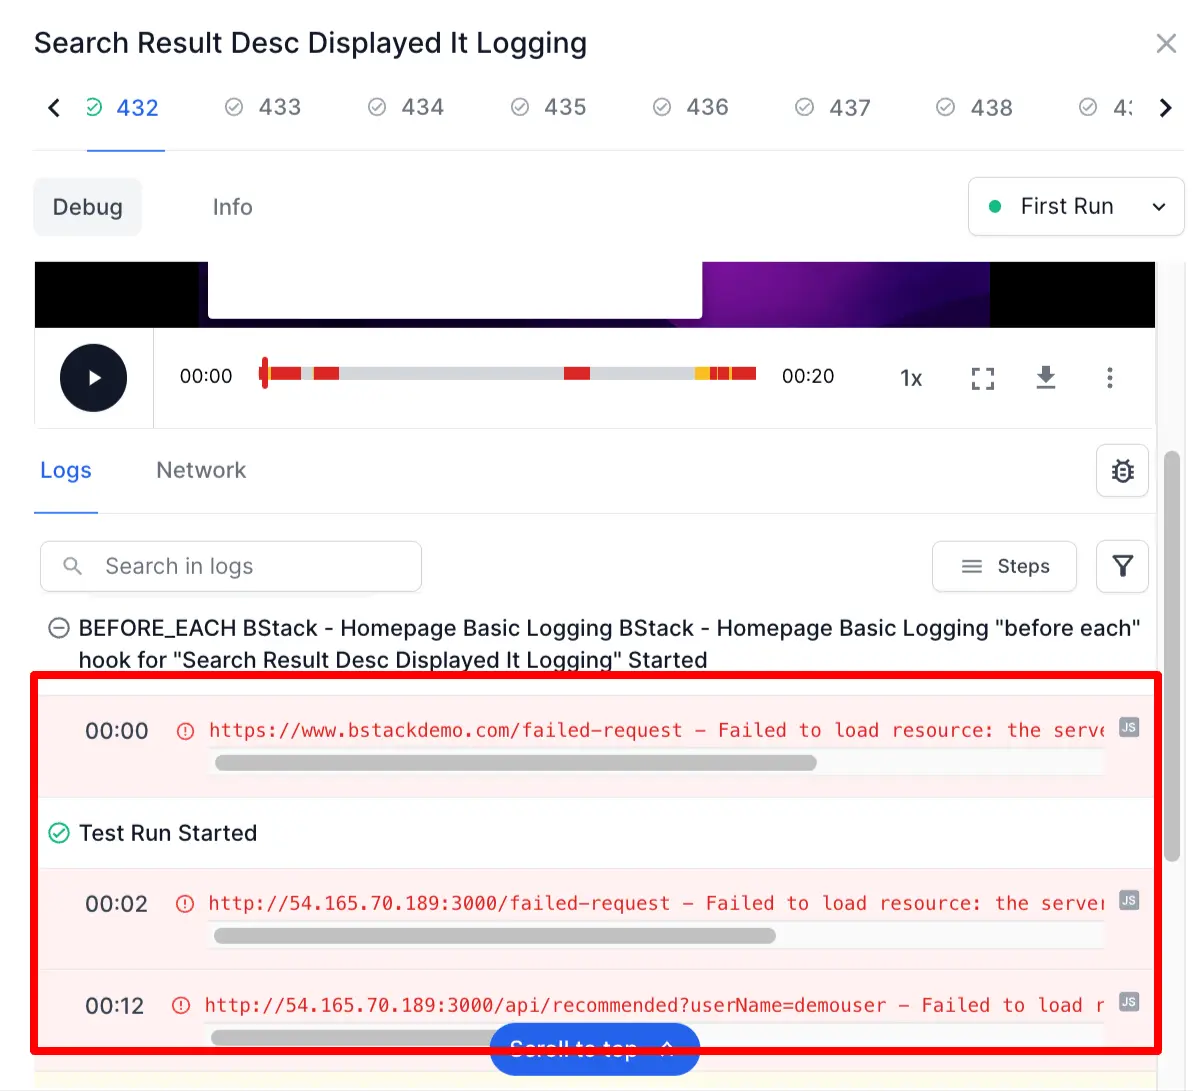
In the following example, you can see that there is an application error just before the test assertion. With such critical information available on a timeline, you can perform the root cause analysis in seconds.
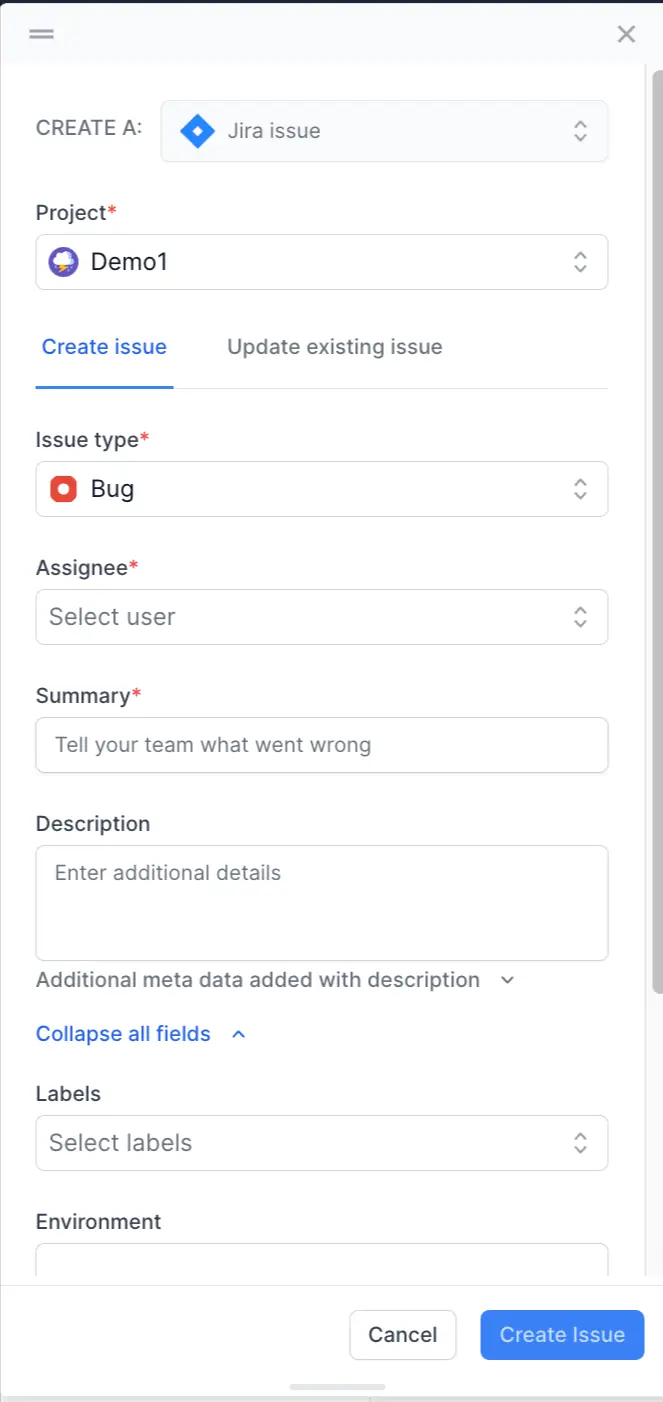
Report a bug on Jira
Once you have analyzed a test failure, you can report a bug on Jira without having to leave Test Reporting & Analytics.
You can choose to open a new Jira bug or update an existing one. You can fill in all the fields in the Jira bug without leaving Test Reporting & Analytics. Click here to get detailed instructions to report a bug on Jira.
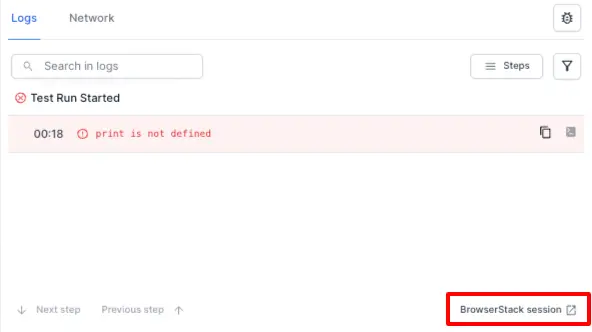
View BrowserStack Session
With Test Reporting & Analytics, you have access to all the information related to your tests in one place, eliminating the need to navigate to separate product dashboards for debugging your test suite. However, if your tests run on BrowserStack Automate or App Automate, you can directly jump to the BrowserStack Automate or App Automate session your tests ran in.
You can navigate to the Logs tab and click on the BrowserStack Session link at the bottom-right corner of your screen to leave Test Reporting & Analytics and view your tests on the BrowserStack product dashboard.
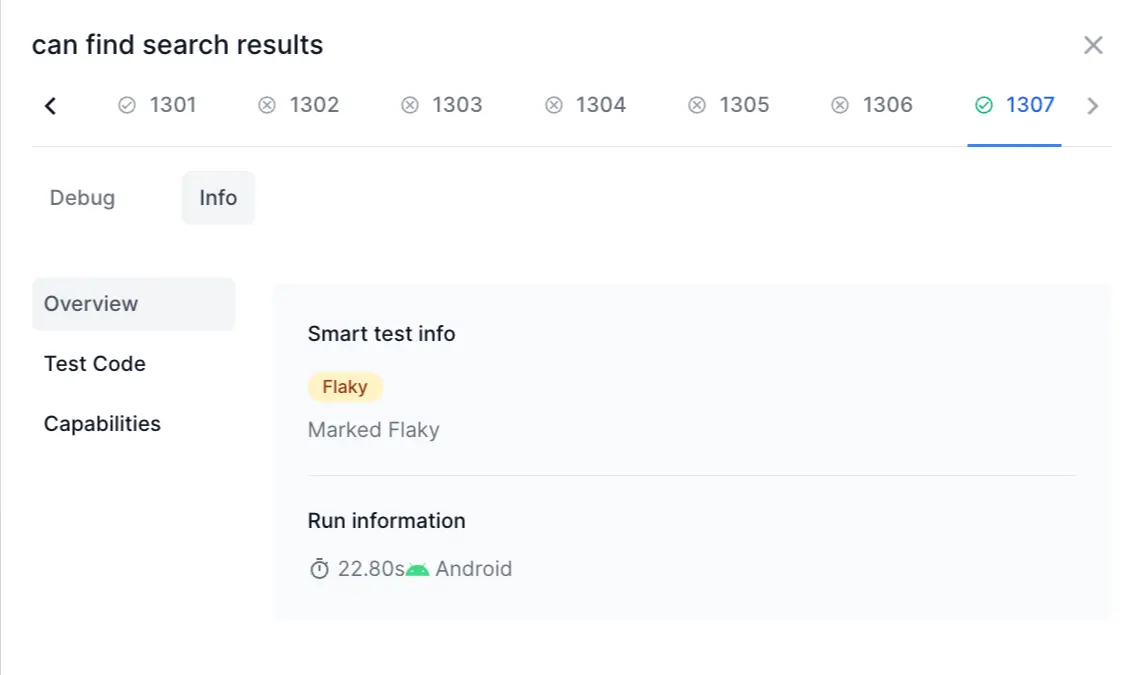
Info view
Along with the Debug view, Timeline Debugging also provides an Info view. This view provides an overall summary of your test, along with some details to assist you in enhancing your test suite.
Under Info view, you can see the following information:
-
Overview - Under this tab, you can see basic details about the test. The Smart Tags lets you know important information about the test like if it’s flaky, always failing, or a new failure. Under Run Information, you can view the duration of the test run and the browser, operating system, or device on which the test runs.
-
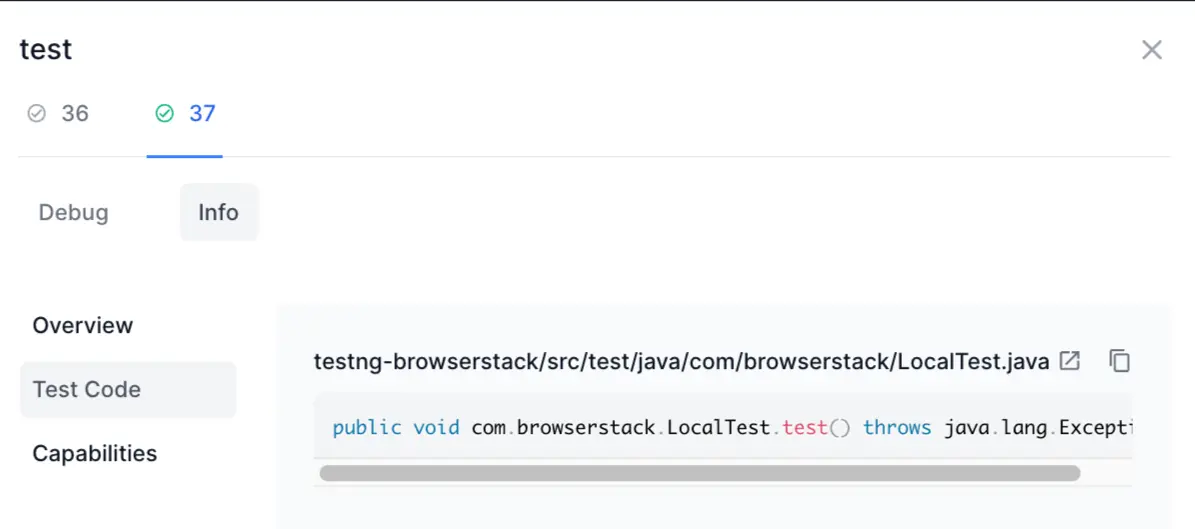
Test Code - Here, you can view the test code. Also, there is a link with the file name of the test code. You can click the link and navigate to your SCM (Source Code Management) tool to verify the test code.
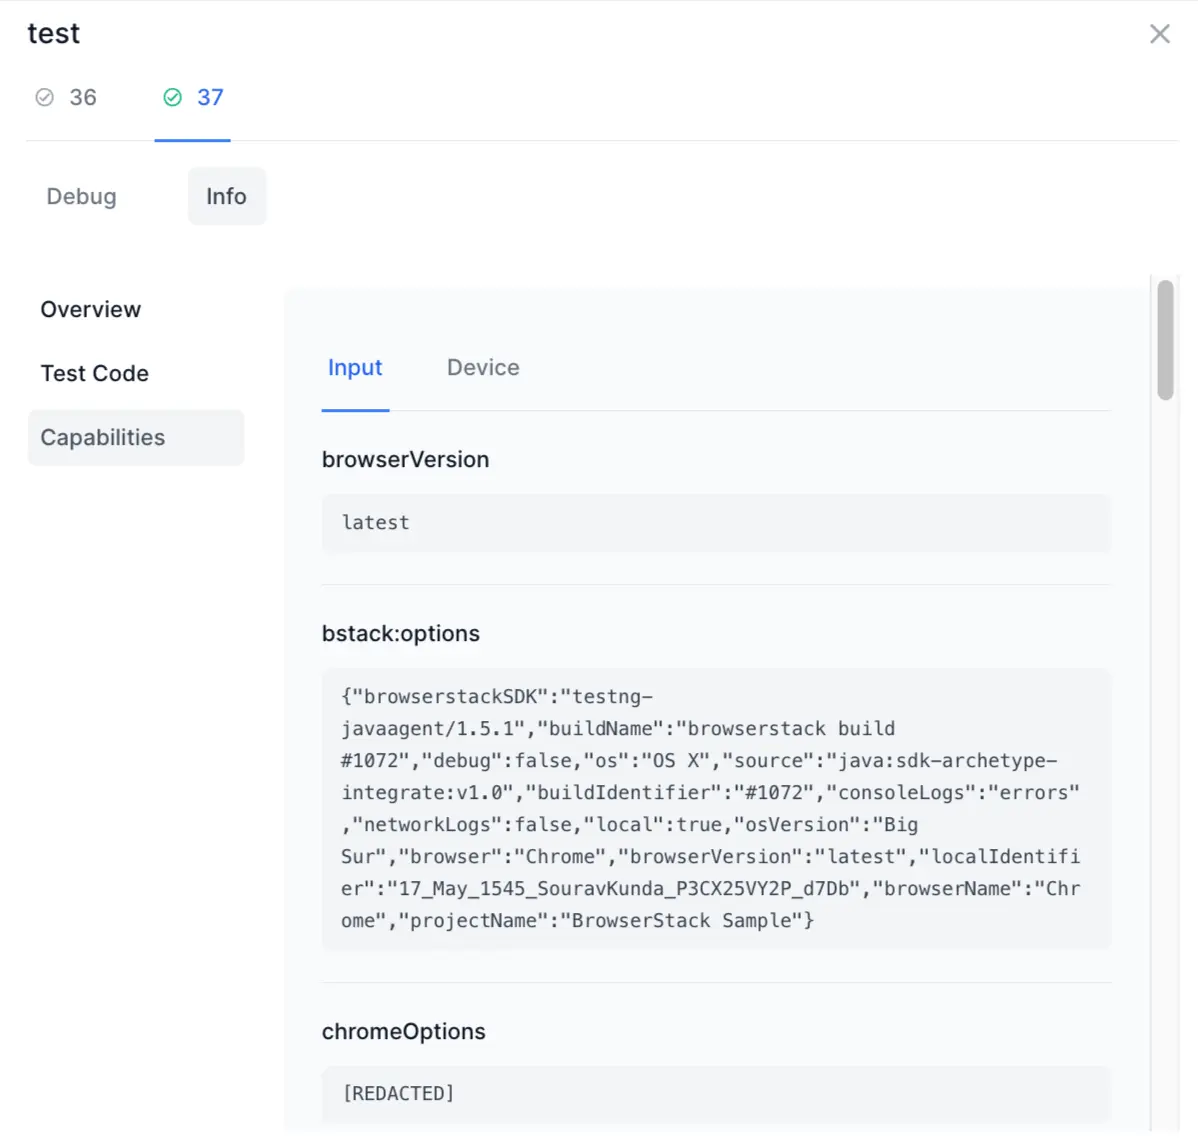
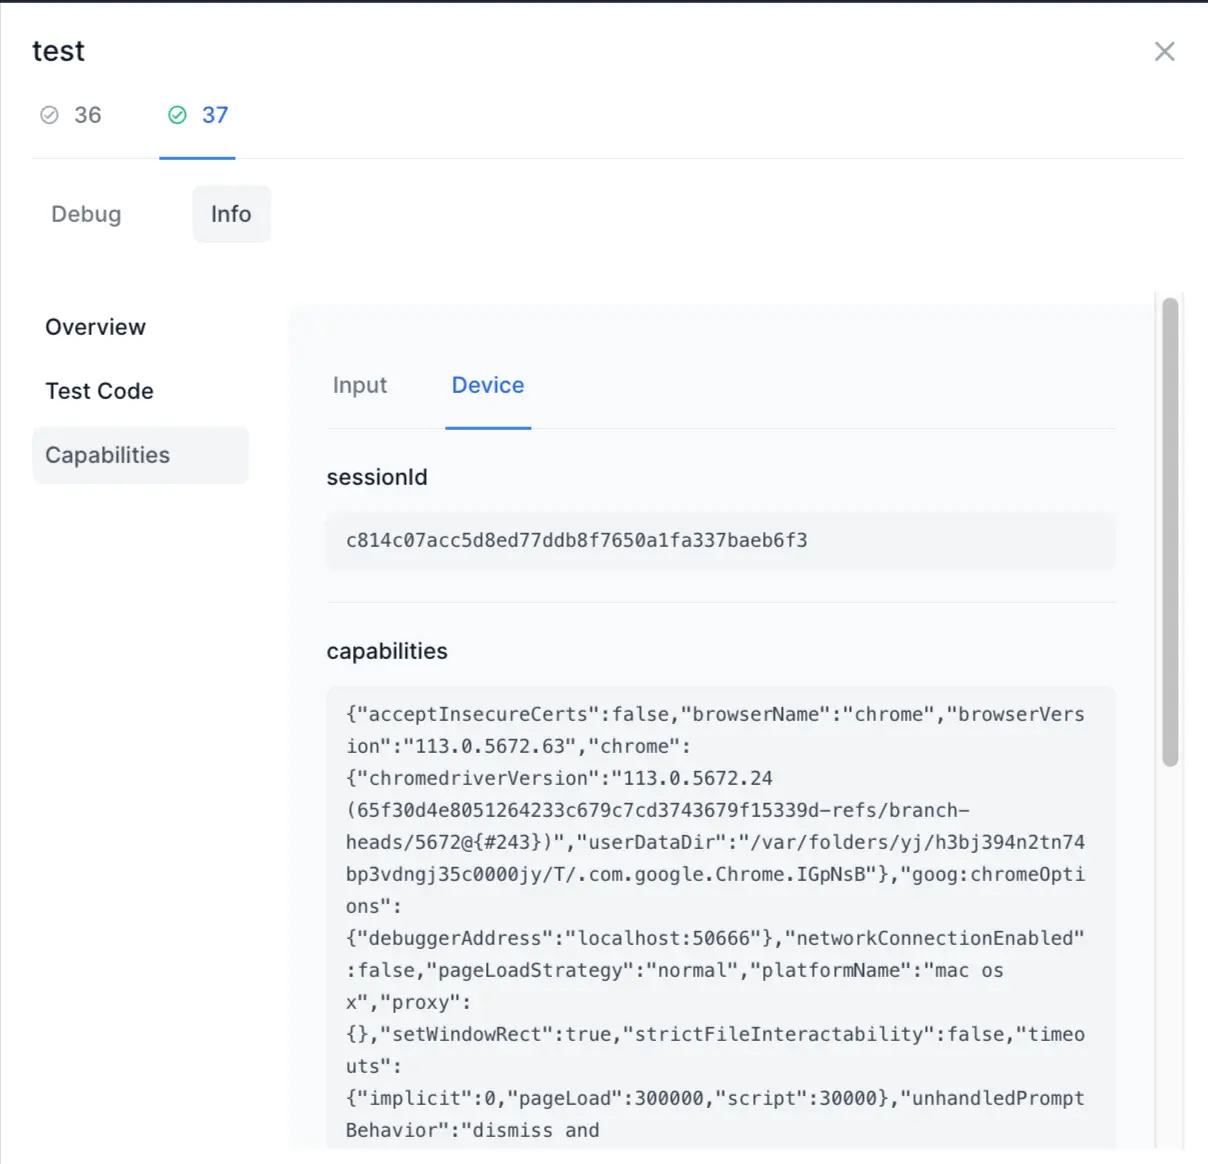
- Capabilities - Under this tab, you can view the Input capabilities and the Device capabilities defined for the test.
Upcoming features
Here are a couple of exciting new features in the making:
- Mute a test case directly from the Timeline Debugging view.
- Tag the failure category of a test directly from the Timeline Debugging view.
We're sorry to hear that. Please share your feedback so we can do better
Contact our Support team for immediate help while we work on improving our docs.
We're continuously improving our docs. We'd love to know what you liked
We're sorry to hear that. Please share your feedback so we can do better
Contact our Support team for immediate help while we work on improving our docs.
We're continuously improving our docs. We'd love to know what you liked
Thank you for your valuable feedback!