
What is Test Observability?
Learn how you can debug faster with Test Observability to improve the quality of your automation suites.
A sneak peek at Test Observability
Get Started Now!
What problems does Test Observability solve?
Test Observability answers the following questions faced by SDETs worldwide:
- Among the tests that failed, what are the genuine failures and what is just noise?
- Can I ensure that genuine defects do not get masked by flaky tests?
- Is there a way to debug only the unique & genuine errors that caused the failures?
- Is it possible to get to the root cause of a failure in a matter of seconds without reproducing the failure locally?
- What are the top issues plaguing my automation?
- How can I keep track of stability and performance metrics of my test suite over time and get alerted of regressions in behavior, and many more…
Debug & verify automation runs in minutes not hours
Test Observability is the go-to tool for all Quality Engineers using which they can debug & verify automation runs in a matter of minutes through the following:
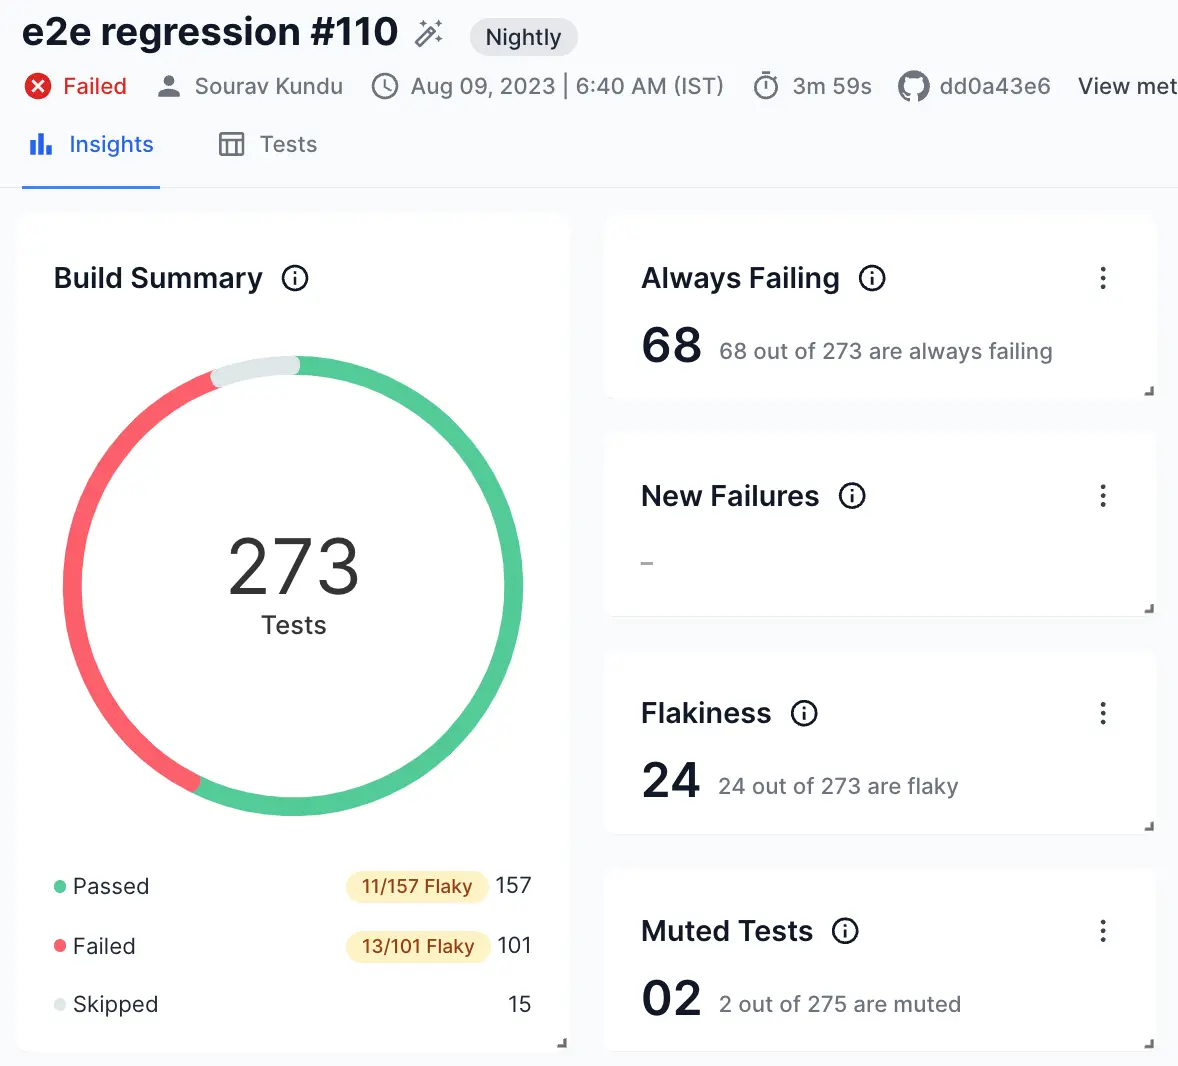
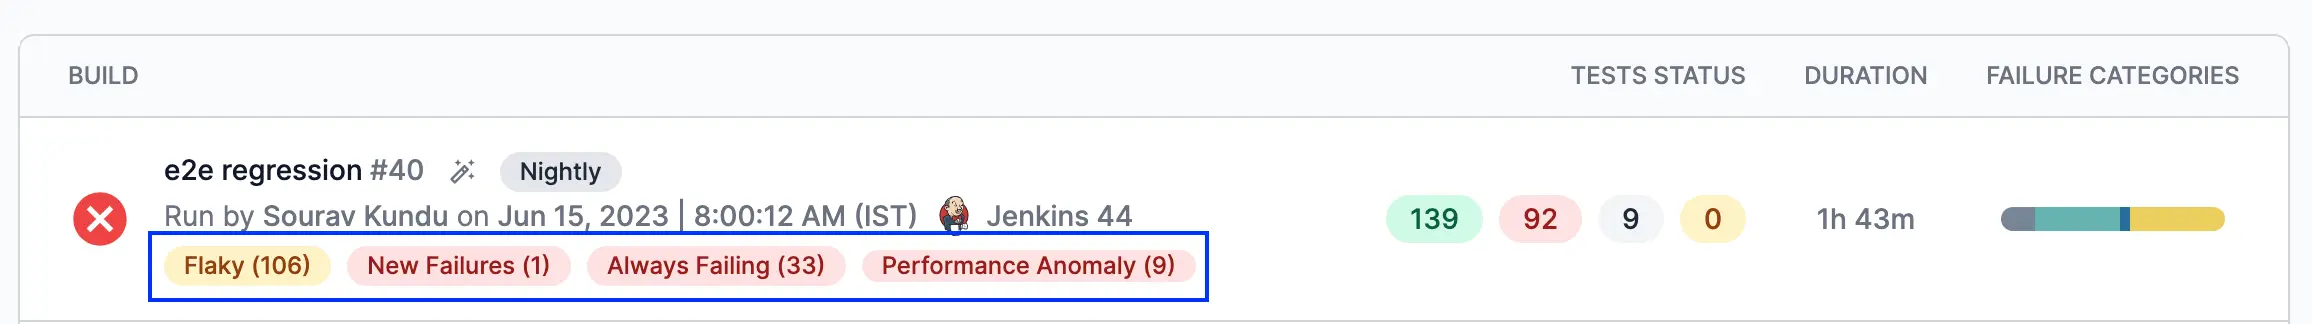
1. Auto-identify false failures with Smart Tags
Smart Tags for flakiness, new test failures, always failing tests, performance anomalies make real failure identification super intuitive and fast. Learn more about these and more such Build Insights.
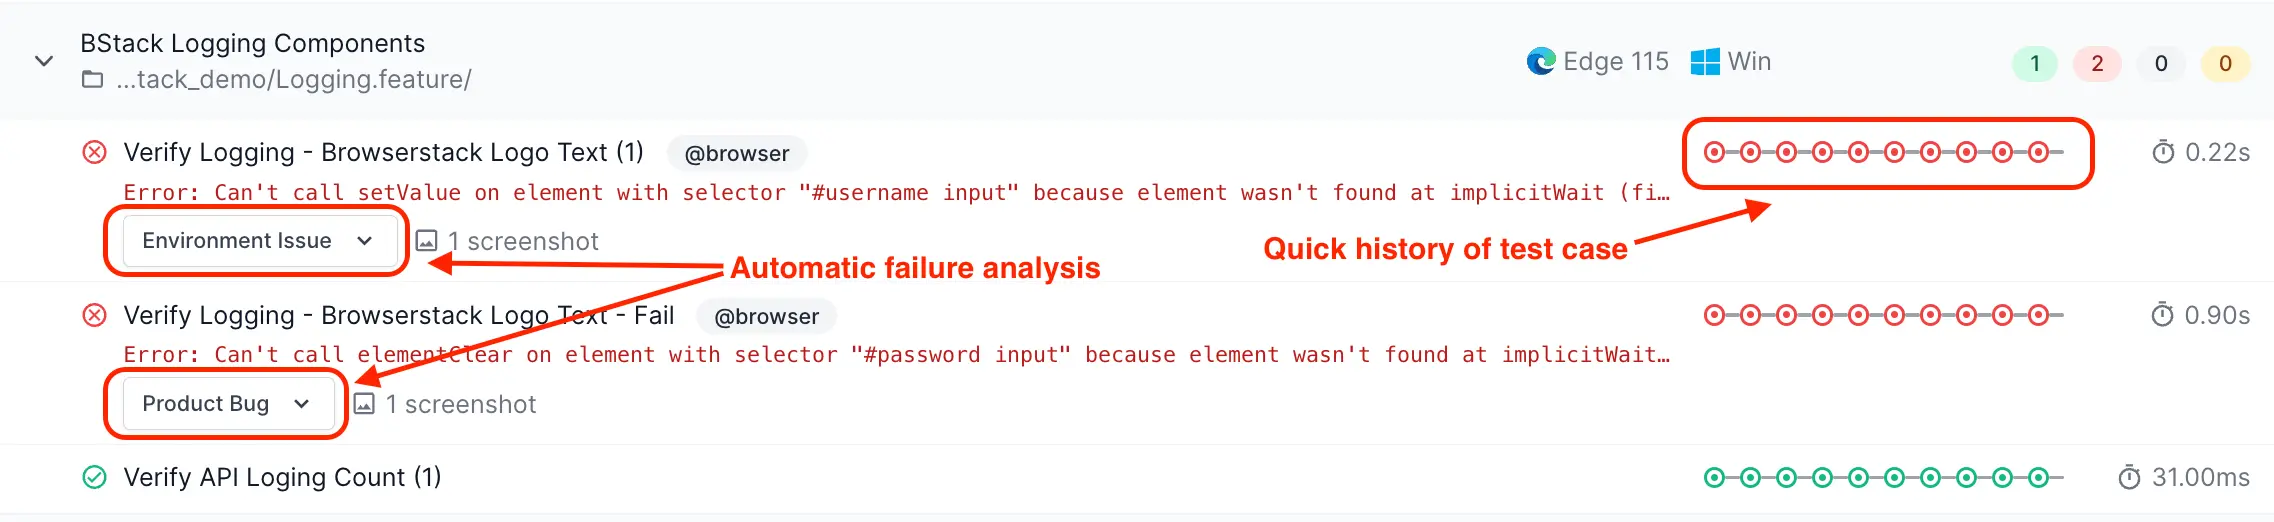
2. Intelligent & automatic failure analysis with quick view of test history
Test Observability employs machine learning algorithms to automatically categorize failures into different failure reasons for faster and more intuitive identification of real failures. The test report also shows a quick-history of the test case for you to take a quick decision on the legitimacy of the failure. A classic example is shown below:
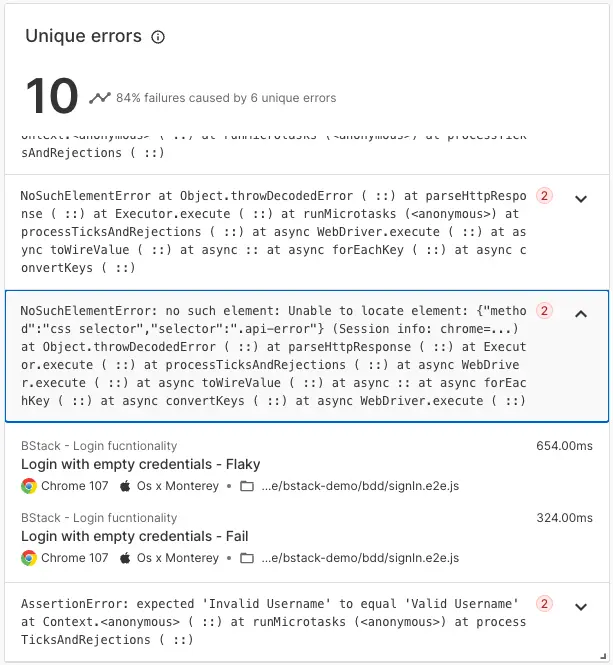
3. Unique error analysis to detect common-cause failures
Test Observability analyzes all error occurrences in a build run, and groups similar failures together so that you can only debug the unique causes and not all the occurrences of failures:
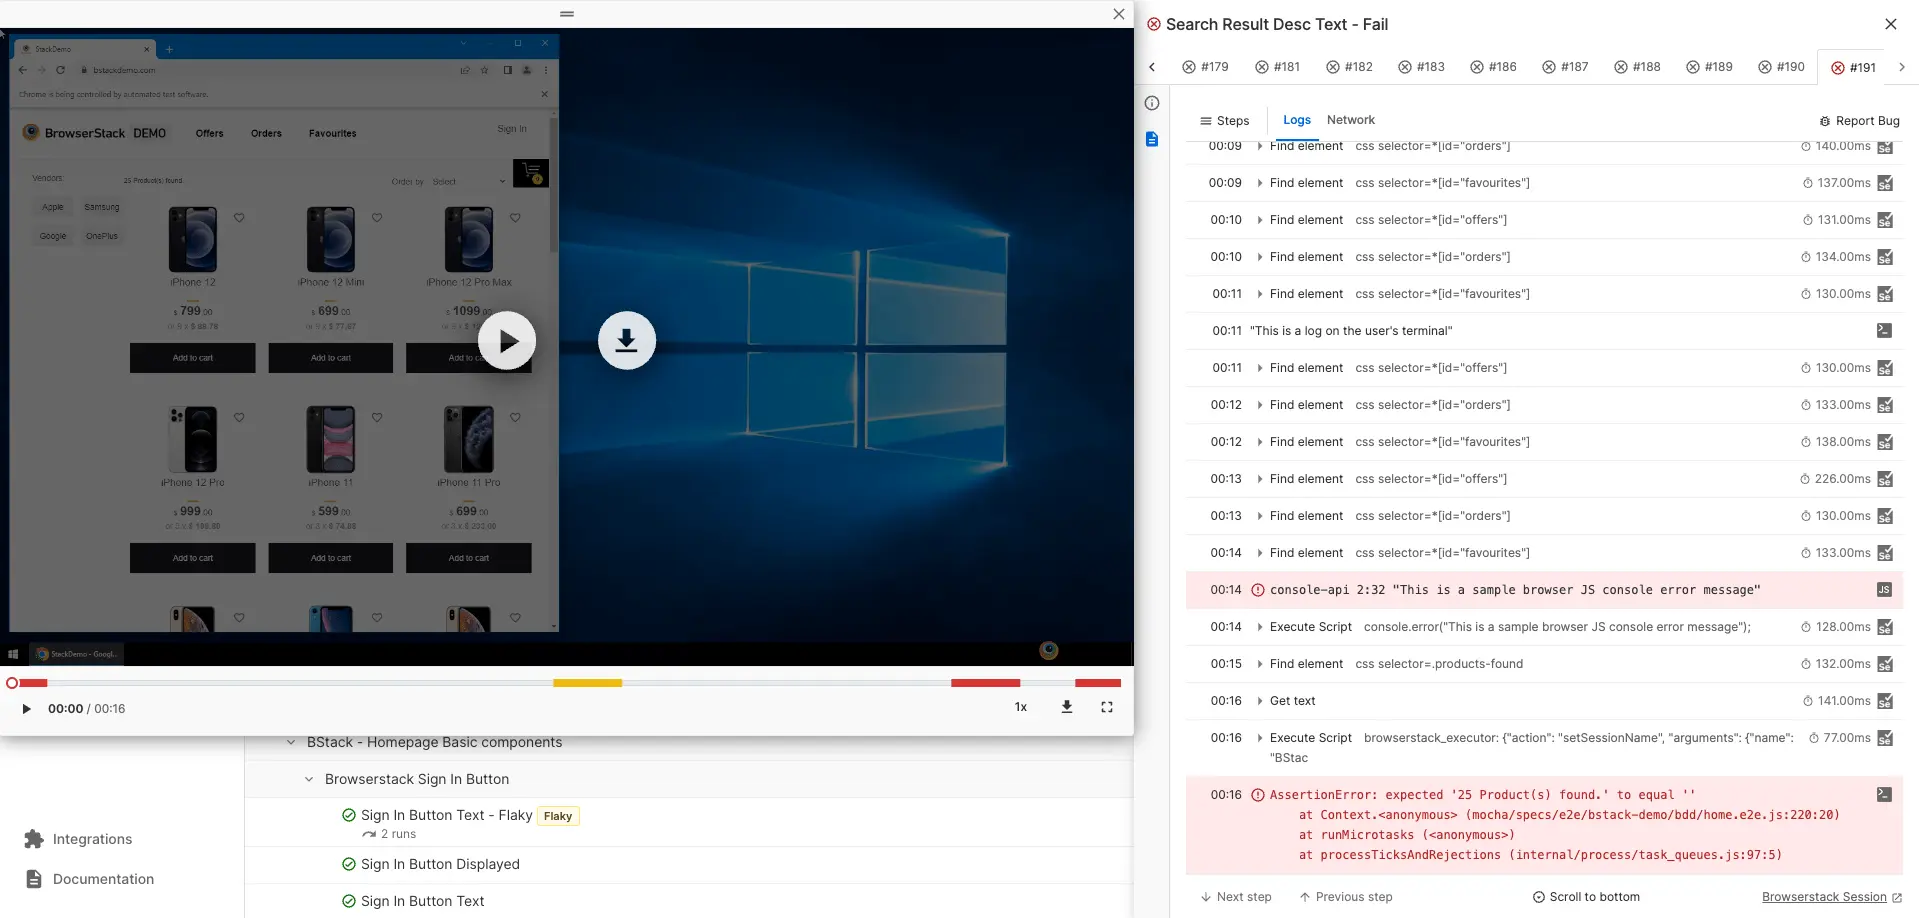
4. Timeline debugging with consolidated logs
Test Observability provides a combination of Timeline and Time Travel Debugging. Timeline Debugging consolidates logs from various sources such as framework, screenshots, browser’s JS console, network, and backend application, along with a video of the execution, into a single timeline. This makes it easy to perform root-cause analysis. In addition, Test Observability allows users to travel back in time and debug at the source of an issue. An example of this is shown below:
Integrated end-to-end testing operations
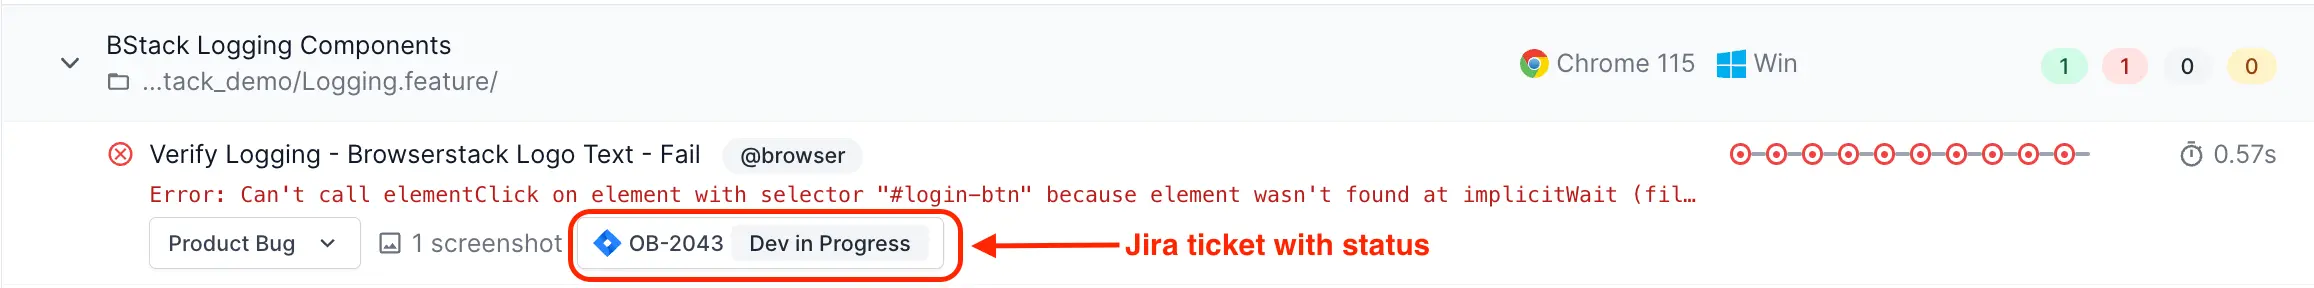
1. File defects on Jira and maintain mapping against test cases
Right after you complete debugging and identify the product bugs/defects, you can file defects on Jira with rich metadata information. The beauty of the the integration is the fact that that the mapping is maintained in future as well as long as the Jira ticket is open so that you don’t needlessly spend time debugging a failed test when in future if you know that it is being worked upon.
2. Mute noisy test cases to have clean reports from next time
Test Observability not only detects noisy tests like flaky or always failing ones, it also allows you to mute such noisy tests so that their results do not show up in the report from next run onwards. You can fix them and un-mute them at a later point of time.
3. Trigger re-run of selective tests on CI and get one single report
You can pick and choose test cases and trigger a re-run on your CI environment right from Test Observability. The cherry on top is the fact that the same build report gets updated with the latest status of tests after the re-run.
4. Jump to code or commit seamlessly
Test Observability integrates with SCM tools such as GitHub and GitLab, allowing users to access the source code or git commit related to a failed test case. The tool provides deep integration with git, enabling mapping of the source code and test case execution. This allows users to easily access the test case code within the tool when needed.
Get things done faster through advanced customizations
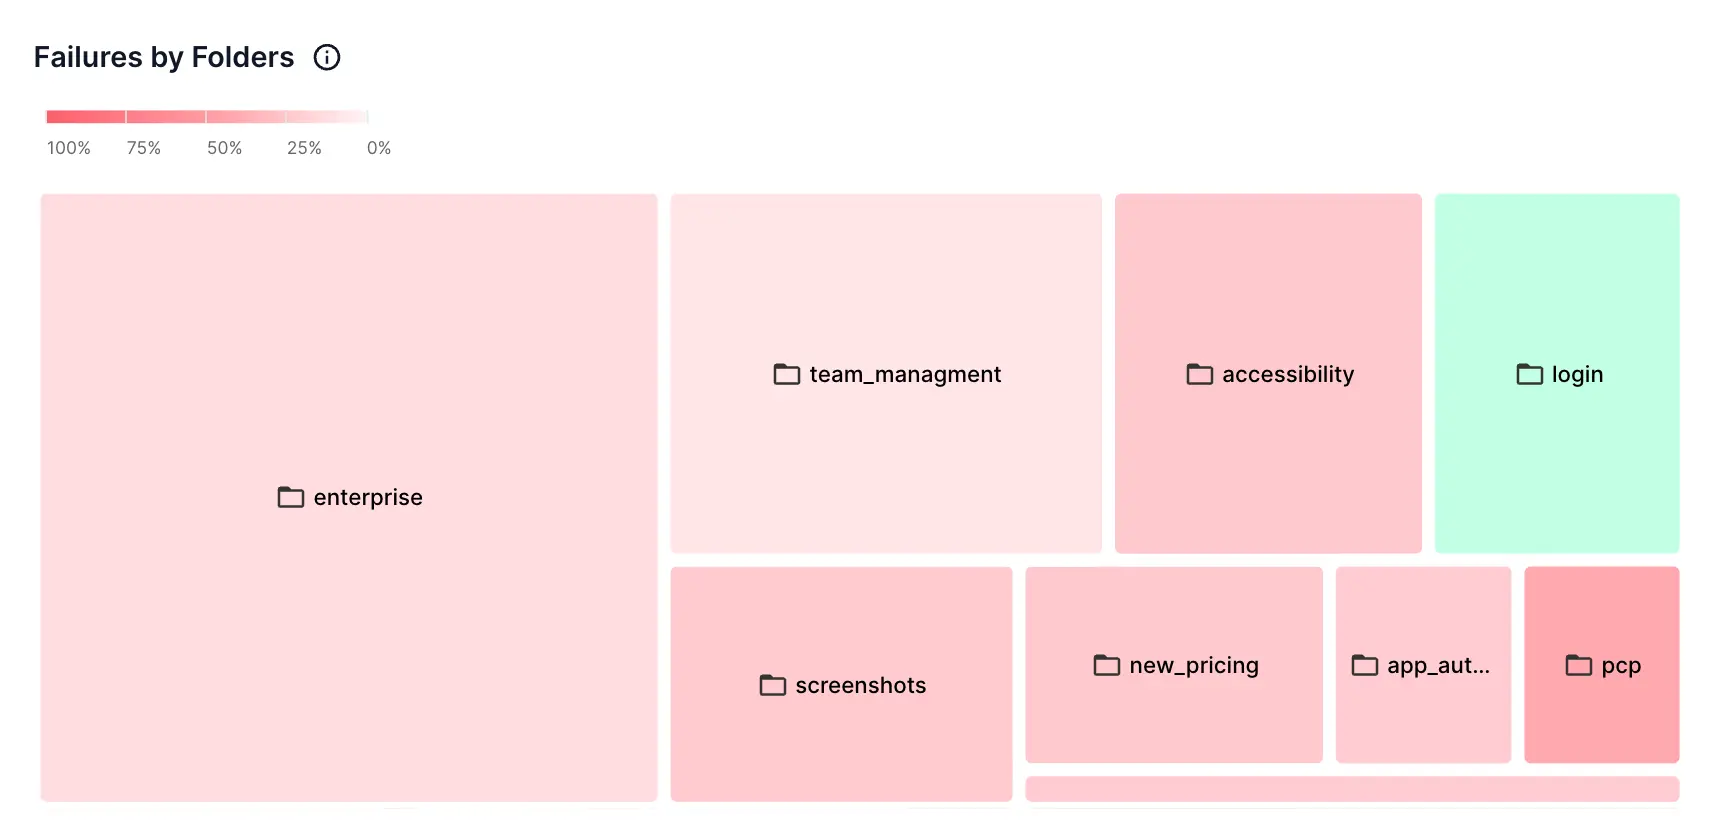
1. Module level heatmaps to understand which modules are failing
Test Observability automatically understands your entire project hierarchy and modules through the folder structure. With that, we’re able to create heatmaps of each folder and you could drill-down further into it and see only the tests from the folder that matters.
2. User specific Custom Views
We understand that each build will not be debugged by a single quality engineer and also understand that you might want to look at certain things only every time to come to view a test report. Hence we built the ability to save a combination of filters as Custom Views.
3. Customize the definition of Smart Tags
Test Observability automatically detects flakiness, new failures, always failing tests, and performance anomalies. These Smart Tags have a default definition in Test Observability. But you may also configure your own definitions for these smart tags to suit your project’s needs.
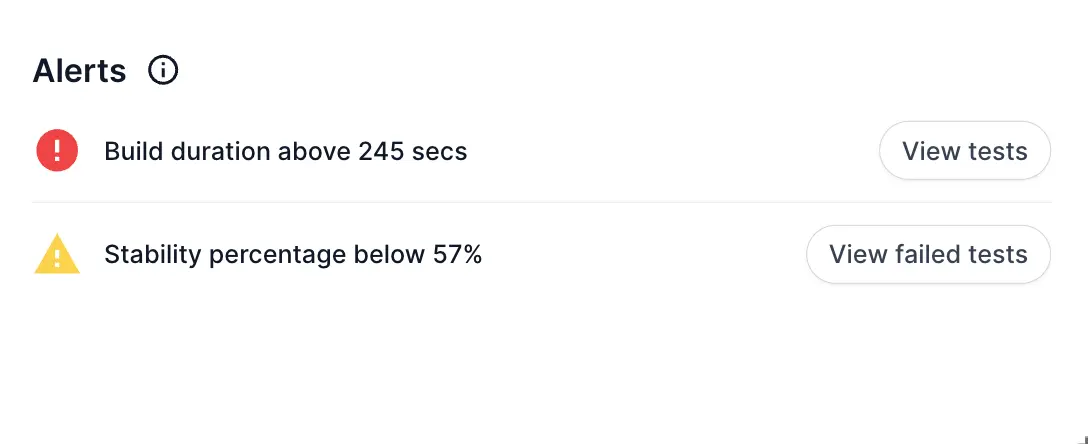
4. Set up custom Alerts on quality metrics
Test Observability allows you to set up various kinds of Alerts on quality metrics with thresholds for critical and warning levels. Keep track of what’s important and get alerted for the right reasons.
Track quality of automation and identify bottlenecks
1. Integrated Testing Trends for all QA metrics
Test Observability calculates and consolidates all important QA metrics like stability, performance, flakiness, always failing percentages, frequency of runs, and many more into easy-to-use centralized Testing Trends for enhanced visibility.
2. Tests Health for all tests
Test Observability offers Tests Health that displays a detailed view of all tests that ran in a project, including their stability and performance regressions over time. The tool also provides x-ray views of test cases from a consolidated run standpoint, enabling users to analyze tests over a period of time to identify what needs to be fixed and determine the source of issues through a timeline view. An example view is shown below:
3. Top Unique Errors
Test Observability offers Unique Errors, a feature that allows users to view all the unique errors in a project sorted by their occurrence rate or impacted tests count. This feature enables users to identify and prioritize fixing the most impactful errors to improve test suite stability. An example view is shown below:
2-min SDK integration
Test Observability integrates with your existing test suite in minutes via the BrowserStack SDK, with zero-code changes necessary. Harness the power of Test Observability by getting started for free in less than 2 minutes.
Get Started Now!
Who is it for?
BrowserStack Test Observability is meant for anyone who runs and wants to analyze their automation tests. That said, these are the primary personas who will find the maximum use for the product:
- SDETs who run functional tests and want to analyze and improve the quality of their suites.
- Developers who want to improve the quality of their unit testing suites.
- QA managers who want to analyze the suite health issues to be able to know what’s broken and needs to be fixed.
- QA leaders who want to get a general idea about the testing trends in their QA org to find issues and plan ahead of time.
Supported frameworks
BrowserStack Test Observability currently supports the following automation test frameworks:
- WebdriverIO
- TestNG
- Cypress
- Jest
- CodeceptJS
- MochaJS
- Playwright
- Nightwatch.JS
- Serenity
- JUnit5
- NUnit
- MSTest
- Pytest
- Robot
- JUnit XML Report Upload
We are building support for more frameworks soon.
What next?
Test Observability works for all your tests irrespective of where they run. Simply put, you need not run your tests on existing BrowserStack grids (Automate / App Automate) to use Test Observability. Test Observability also works for tests that you run locally on your laptop or on any CI tool or for that matter any other cloud solutions provider as well.
Curious to learn more?
Check out the demo sandbox to experience advanced testing using Test Observability.
We're sorry to hear that. Please share your feedback so we can do better
Contact our Support team for immediate help while we work on improving our docs.
We're continuously improving our docs. We'd love to know what you liked
We're sorry to hear that. Please share your feedback so we can do better
Contact our Support team for immediate help while we work on improving our docs.
We're continuously improving our docs. We'd love to know what you liked
Thank you for your valuable feedback!