Try interactive testing trend charts on a live demo or our Sandbox
No sign-up needed
Interactive testing trends charts
Hold your teams accountable with end-to-end visibility into
automation metrics for all teams, projects and modules.

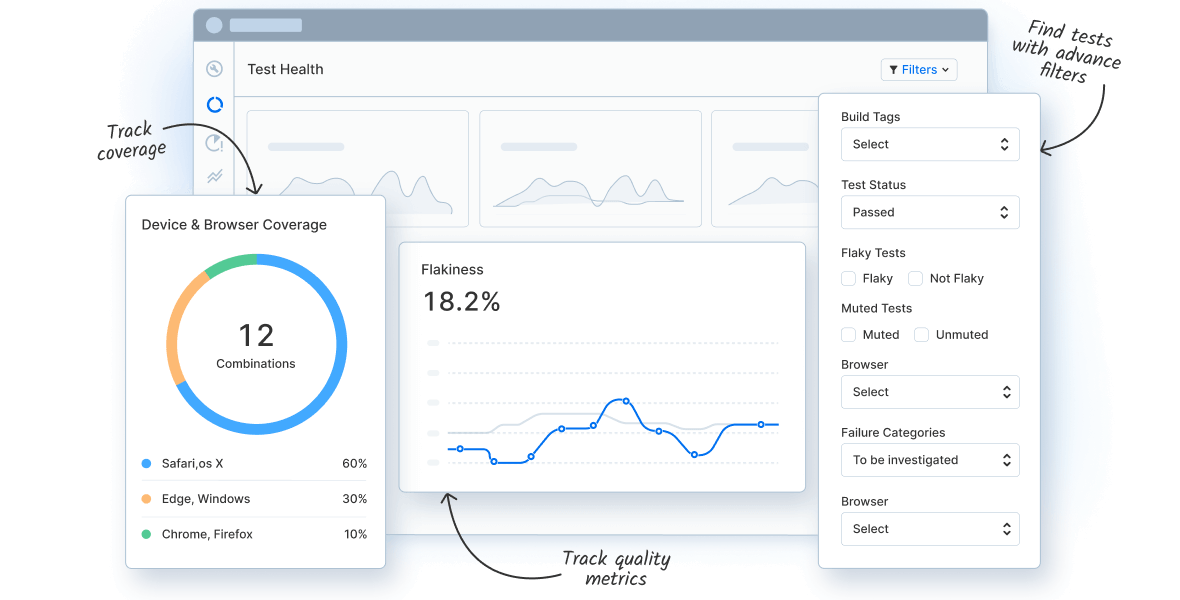
Test suite health dashboard
Quality metrics, like failure rate & performance, computed and visualized

Custom Dashboards
Build your own dashboards from scratch to compare, track and analyze QA metrics
across projects, builds, modules & a lot more.

Top unique errors
View how many tests each error impacts to easily
prioritize what you want to fix first.

Try everything on Sandbox
No sign-up needed
