Network logs
Leverage the full range of debugging tools provided by BrowserStack to easily debug your test automation for native and hybrid mobile apps.
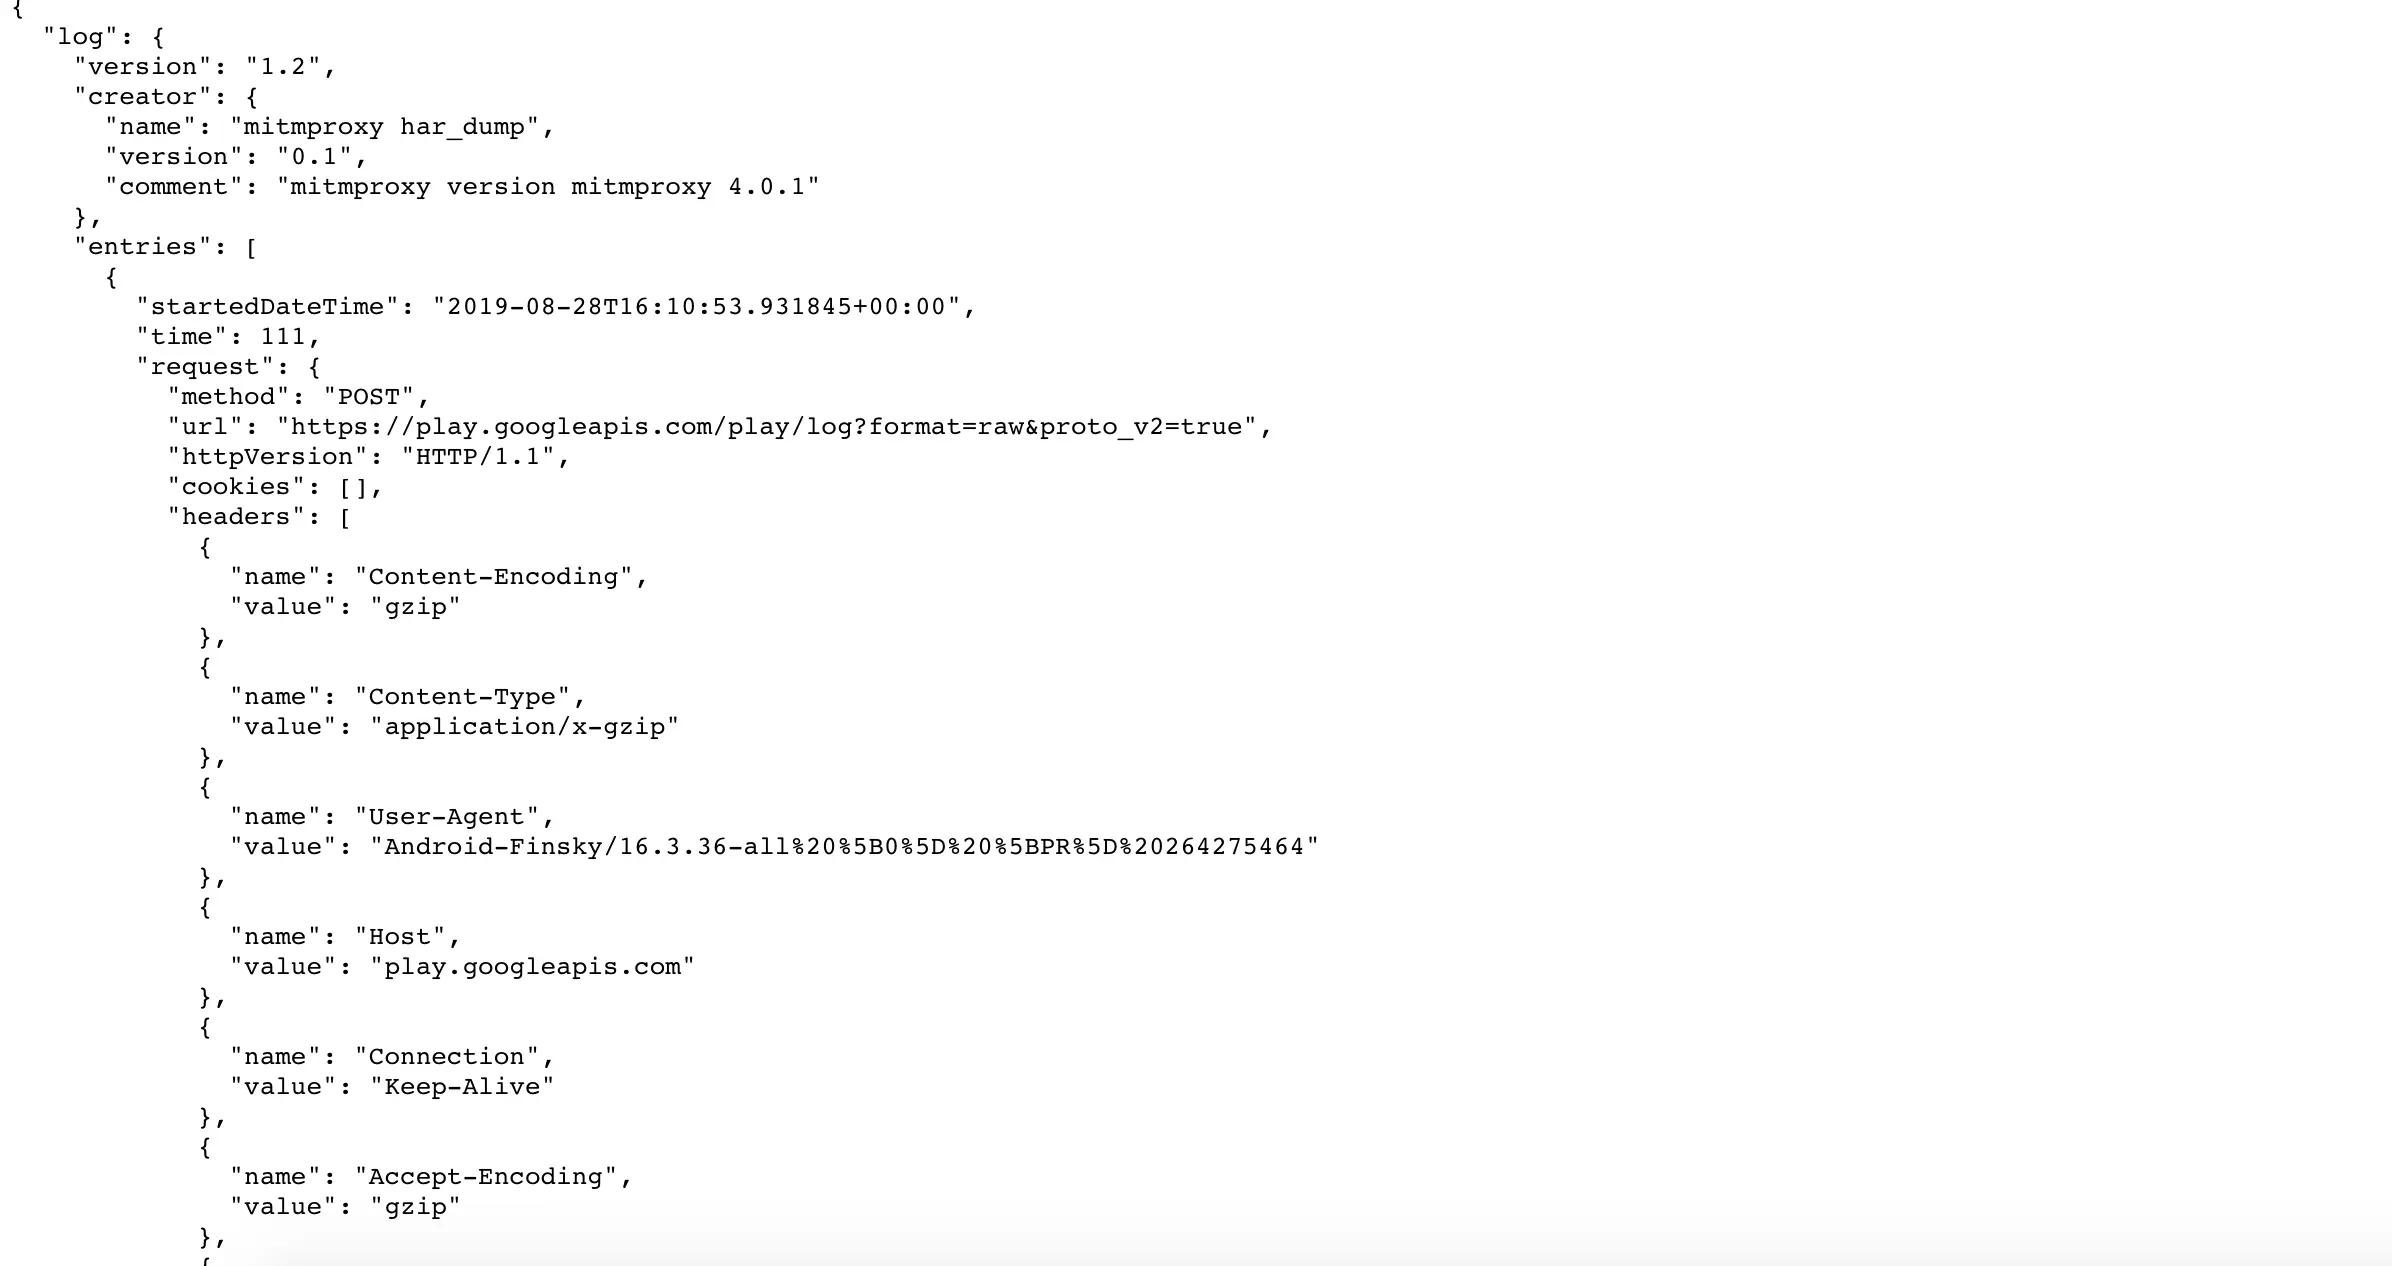
Network Logs capture the app’s performance data such as network traffic, latency, HTTP requests and responses in the HAR format. You can leverage Network logs to get a clear picture of all the requests your app is making, and the time taken for each of these requests.
Network Logs are disabled by default. To enable Network Logs update the API parameter networkLogs with the value true in your execute test API:
curl -X POST "https://api-cloud.browserstack.com/app-automate/earlgrey/build" -d "{"devices": ["iPhone 8 Plus-11"], "appDir": "bs://<hashed appid>", "networkLogs" : "true"}" -H "Content-Type: application/json" -u "YOUR_USERNAME:YOUR_ACCESS_KEY"
You can download network logs using the REST API or via the App Automate dashboard under the Network Logs tab
Raw Network Logs:

Retrieve Network Logs using REST API:
curl -u YOUR_USERNAME:YOUR_ACCESS_KEY https://api.browserstack.com/app-automate/earlgrey/builds/<build-id>/sessions/tests/<test-id>/networklogs
We're sorry to hear that. Please share your feedback so we can do better
Contact our Support team for immediate help while we work on improving our docs.
We're continuously improving our docs. We'd love to know what you liked
We're sorry to hear that. Please share your feedback so we can do better
Contact our Support team for immediate help while we work on improving our docs.
We're continuously improving our docs. We'd love to know what you liked
Thank you for your valuable feedback!