Android network usage
The Network Usage metric measures the amount of data the device uploads and downloads (in KB) through the network during a session.
In App Performance, Network Logs are available for manual (App Live) sessions. The Network Data Usage graph is available for all profiled sessions. When Network Logs are enabled, the data captured there also feeds into the totals shown in the Network Data Usage graph.
-
Network Data Usage graph:
Visualizes total data uploaded and downloaded by your device over the session timeline (X-axis: seconds since start; Y-axis: KB transferred). Great for spotting spikes and correlating with user actions. -
Network Logs (manual App Live only):
A request-level table with per-API details;method,URL,status,response time,payload/headers, andbytessent/received. Use it to confirm what was transferred and why.
Example
In the following example, you can see that the total data uploaded to the internet throughout the session was 5162.05 KB and the total data downloaded was 216.88 KB. You can also see the graph for the uploaded and downloaded data by the device at a particular time during the session since the session started.
To identify the actions or workflows that caused excessive network usage, you can play the session video. Alongside the video, a bar moves on the graph to help you identify the actions or workflows of your interest. To view uploads or downloads individually, use the legends given on the graph.
Impact on user experience
Excessive network data usage can cause user experience issues in Android apps by slowing down device performance, increasing battery drain, and incurring additional data charges. This can lead to frustration and dissatisfaction among users, ultimately resulting in decreased device usage and negative reviews.
Threshold guidelines
Recommended thresholds are:
- Total Network Uploads to be less than 5000 Kb in a session
- Total Network Downloads to be less than 20,000 Kb in a session
If your device exceeds these thresholds, App Performance Testing flags an issue in the performance report. To know more about the issue, see App performance issues - Network Usage.
If network logs are not enabled, network data usage graphs will still be populated.
View Android Network Logs for Manual App Tests
- In App Live, after starting a session, open the DEVTOOLS pane and select NETWORK.
- Under Configure Network Tracking, choose Enable for all traffic or Enable for specific domains. If you choose Enable for specific domains, enter the domains in the text field, separated by commas.
- Click Save configuration. This action will restart the device to apply the changes. It will also display the message: Network Tracking enabled successfully. Note that if device profiling is already in progress and you modify the network configuration, the device will restart.
- You can now go to the PERFORMANCE tab and run the device performance test. Now, click View Full Report and scroll to the Network Logs section.
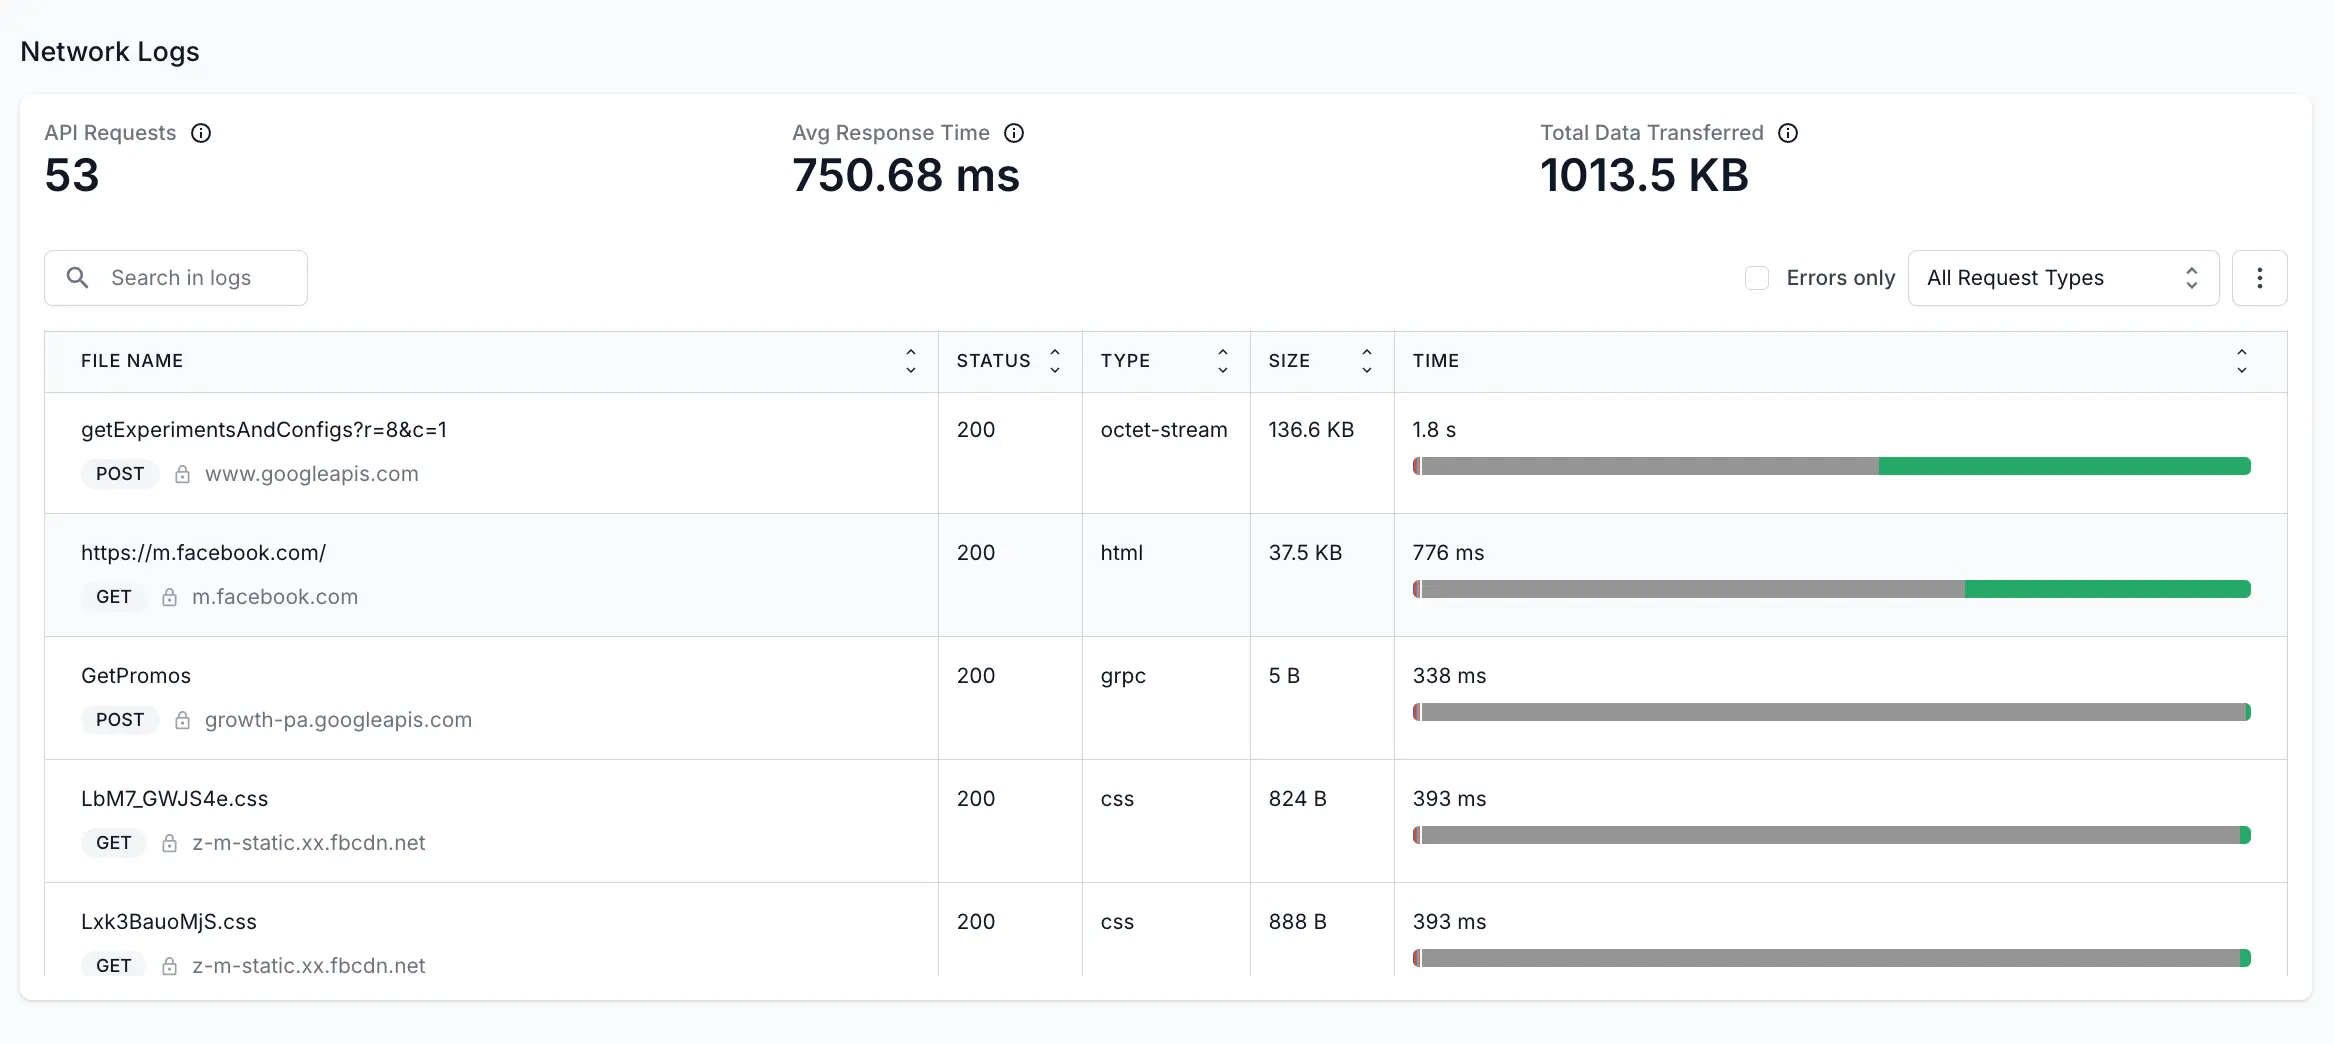
In the Network Logs section, you can view the following details:
- API Requests: The number of API requests made throughout the session.
- Avg Response Time: The average of the time taken by the APIs to take the request, process it, and send back the response to the device.
- Total Data Transferred: The total data exchanged (uploaded or downloaded) from the internet by the device throughout the session.
- API requests table: Click one of the APIs to access the API requests table. This table lists all the requested APIs, the response status, the size of the data transferred, and the time taken to process the request. For individual APIs, it also shows details such as response, headers, payload and timing. For more details about the table, see API requests table.
API requests table
In the Network Logs section, you can see a table that lists the APIs that were requested, the method used, response details, and more. The following table explains the details listed in the APIs table:
| Field | Description |
|---|---|
| File Name | Name or identifier of the API. |
| Status | The HTTP status code in the response header that indicates the general classification of the response. For example, the 200 status code indicates that the request was successful. Check out HTTP Status Code for more details. |
| Type | The file format or content type of the response. Possible values include HTML, CSS, PNG, X-Javascript and GIF. |
| Size | The combined size of the response headers plus the response body, as delivered by the server. |
| Time | The total duration, from the start of the request to the receipt of the final byte in the response. The bar shows various colors to represent different aspects of content loading: Blue: Represents the time taken to send the request in milliseconds. Red: Indicates the time during which the request is stalled, possibly due to network latency or server responsiveness in milliseconds. Dark Green: Measures the time taken to resolve the domain name into an IP address in milliseconds. Pink: Indicates the time taken to establish an SSL connection in milliseconds. Orange: Indicates the time taken to send the actual request after the connection was established in milliseconds. Grey: Indicates the Time to First Byte (TTFB), which is the time it takes for the server to start sending data after a request is made. Green: Indicates that a piece of content (like a web page, image, or file) was downloaded in milliseconds. |
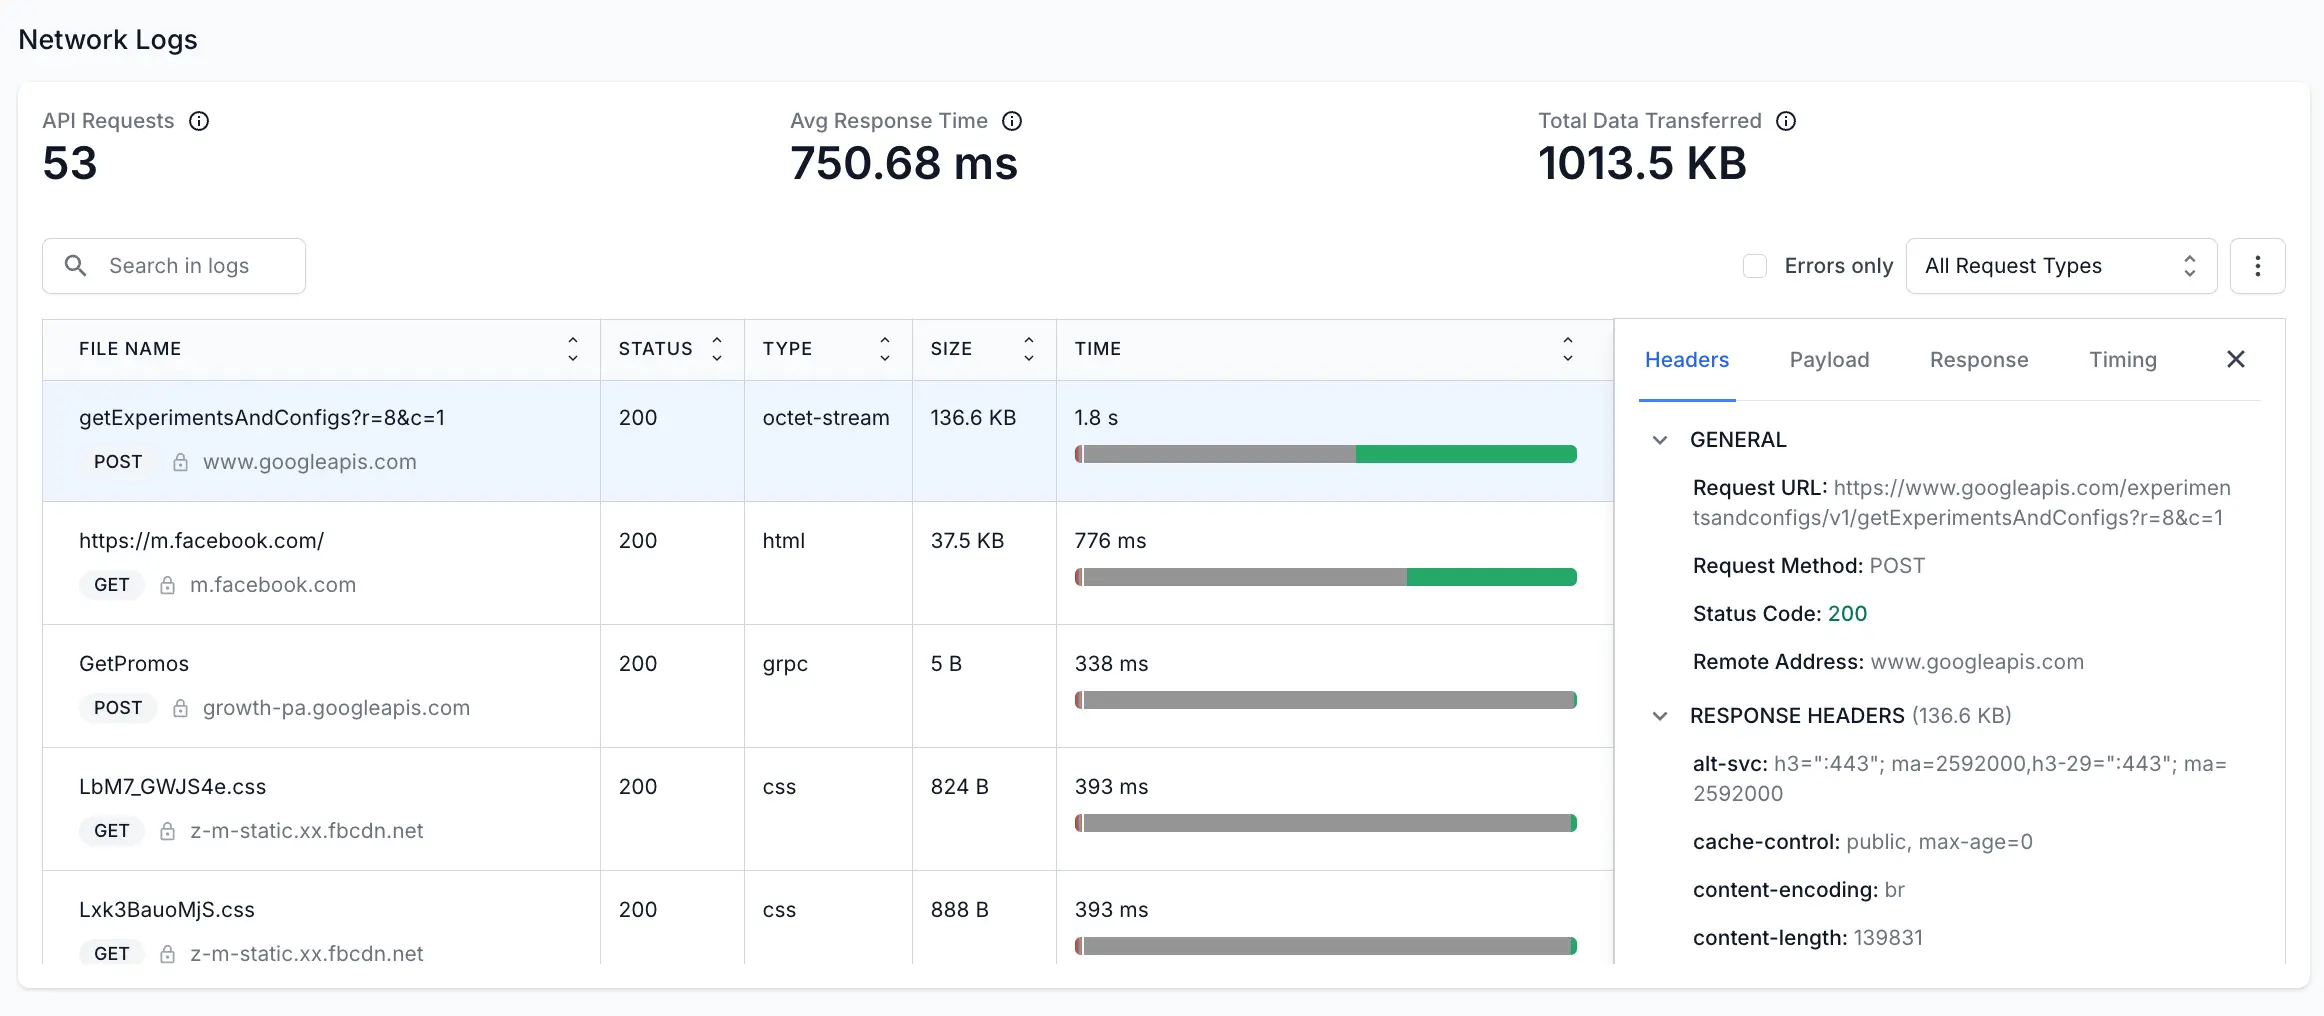
After you click any API entry from the table, another pane opens that shows further details of the API request:
| Field | Description |
|---|---|
| Headers | Information about the request and response, including the status code, the remote address, and the request method used to access the URL. |
| Payload | The data sent in the request, including both the request body and query parameters. |
| Response | The response body containing the requested information by the app. |
| Timing | The breakdown of the time taken to send the request, build connection, and get the response. |
Use filters
To find a particular API request, you can use the search box given at top of the table. Or, you can use the following filters:
- Search in logs: Find specific log entries by searching for text or keywords.
- Errors only: Only shows the APIs that returned error response.
- Request types: Filter the table according to the request type such as XHR, JS, CSS, images, and more.
Download the log file
To download the log file, you can click the three-dot menu and then click View RAW Logs to download the HAR file. The HAR files are stored in JSON (JavaScript Object Notation) format.
Recommendations
The following are the recommendations to improve Network Usage:
- Use network caching: Implement network caching to store frequently accessed data on the device. This helps reduce the number of network requests and improve response time.
- Minimize network requests: Reduce the number of network requests by combining multiple requests into a single request, compressing data, or using other techniques to optimize data transfer.
- Use background threads: Move network operations off the main UI thread to prevent the device from freezing or becoming unresponsive.
- Implement network connection callbacks: Use network connection callbacks to detect changes in network connectivity and adapt the device’s behavior accordingly, such as by pausing network-intensive tasks when the user has a weak or unreliable network connection.
Related topics
We're sorry to hear that. Please share your feedback so we can do better
Contact our Support team for immediate help while we work on improving our docs.
We're continuously improving our docs. We'd love to know what you liked
We're sorry to hear that. Please share your feedback so we can do better
Contact our Support team for immediate help while we work on improving our docs.
We're continuously improving our docs. We'd love to know what you liked
Thank you for your valuable feedback!