Debug failed tests
BrowserStack provides a range of debugging tools to help you quickly identify and fix bugs discovered through your automated tests.
If you are using the older dashboard, refer to the old dashboard documentation.
Interactive Session
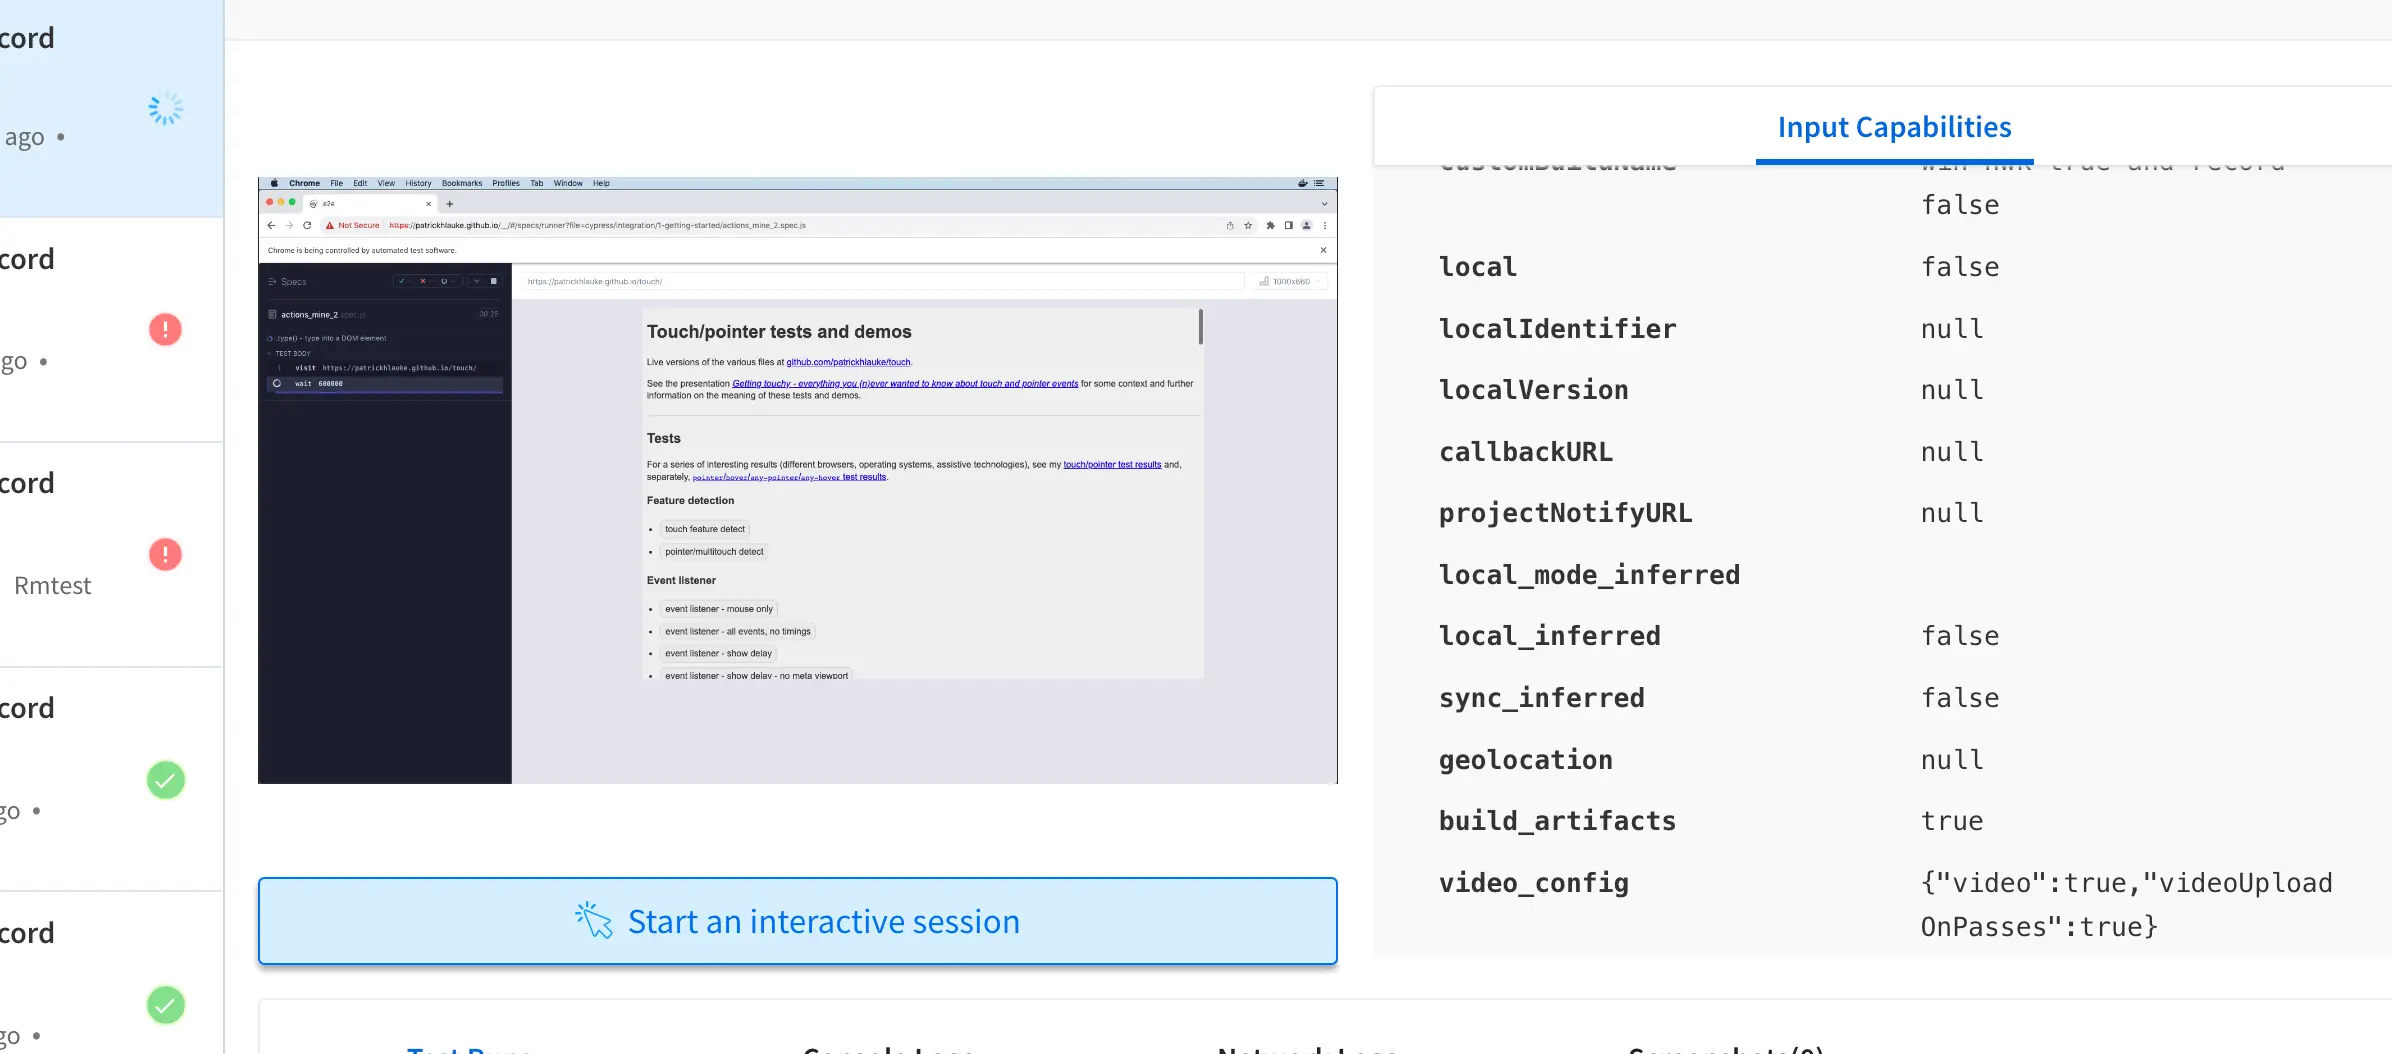
The interactive session feature allows you to control your Cypress test while it is executing on the remote browser.
Consider a use case where you are testing a webapp which requires an input using a mouse pointer. Since testing this functionality with a test script will be difficult, you will need to try it out yourself to test the behavior of your test script.
You can start the interactive session by clicking the Start an interactive session link that appears in the video recording area as you execute your test script. Once the session completes, the option for interactive session will no longer be available.
Perform the following steps to start an interactive session:
- Run the test and view your session running on the BrowserStack Automate dashboard.
- Click the Start an interactive session link that appears in the video recording area.
- Observe and control the ongoing test execution in the remote browser once the interactive session begins.
In order to enable Interactive Debugging you will need to set interactiveDebugging capability to true.
| Capability | Description | Expected values |
|---|---|---|
interactiveDebugging |
Enable interactive debugging | A string or a boolean. Defaults to true true if you want to enable the interactive debugging. false otherwise. |
{
  ...
  "run_settings": {
    ...
    "interactiveDebugging": "true",
    ...
  }
}
Video Recording
Every Cypress test run on BrowserStack is recorded exactly as it is executed on our remote machine. Video recordings are particularly helpful whenever a test fails as they help you retrace the steps which led to the failure. You can access the video recordings from Automate Dashboard for each session. You can also download the videos from the Dashboard.
Define any changes to the video logs configuration in both the browserstack.json and the cypress.config.ts files. Otherwise, the video may not be recorded.
Access video from Automate Dashboard:
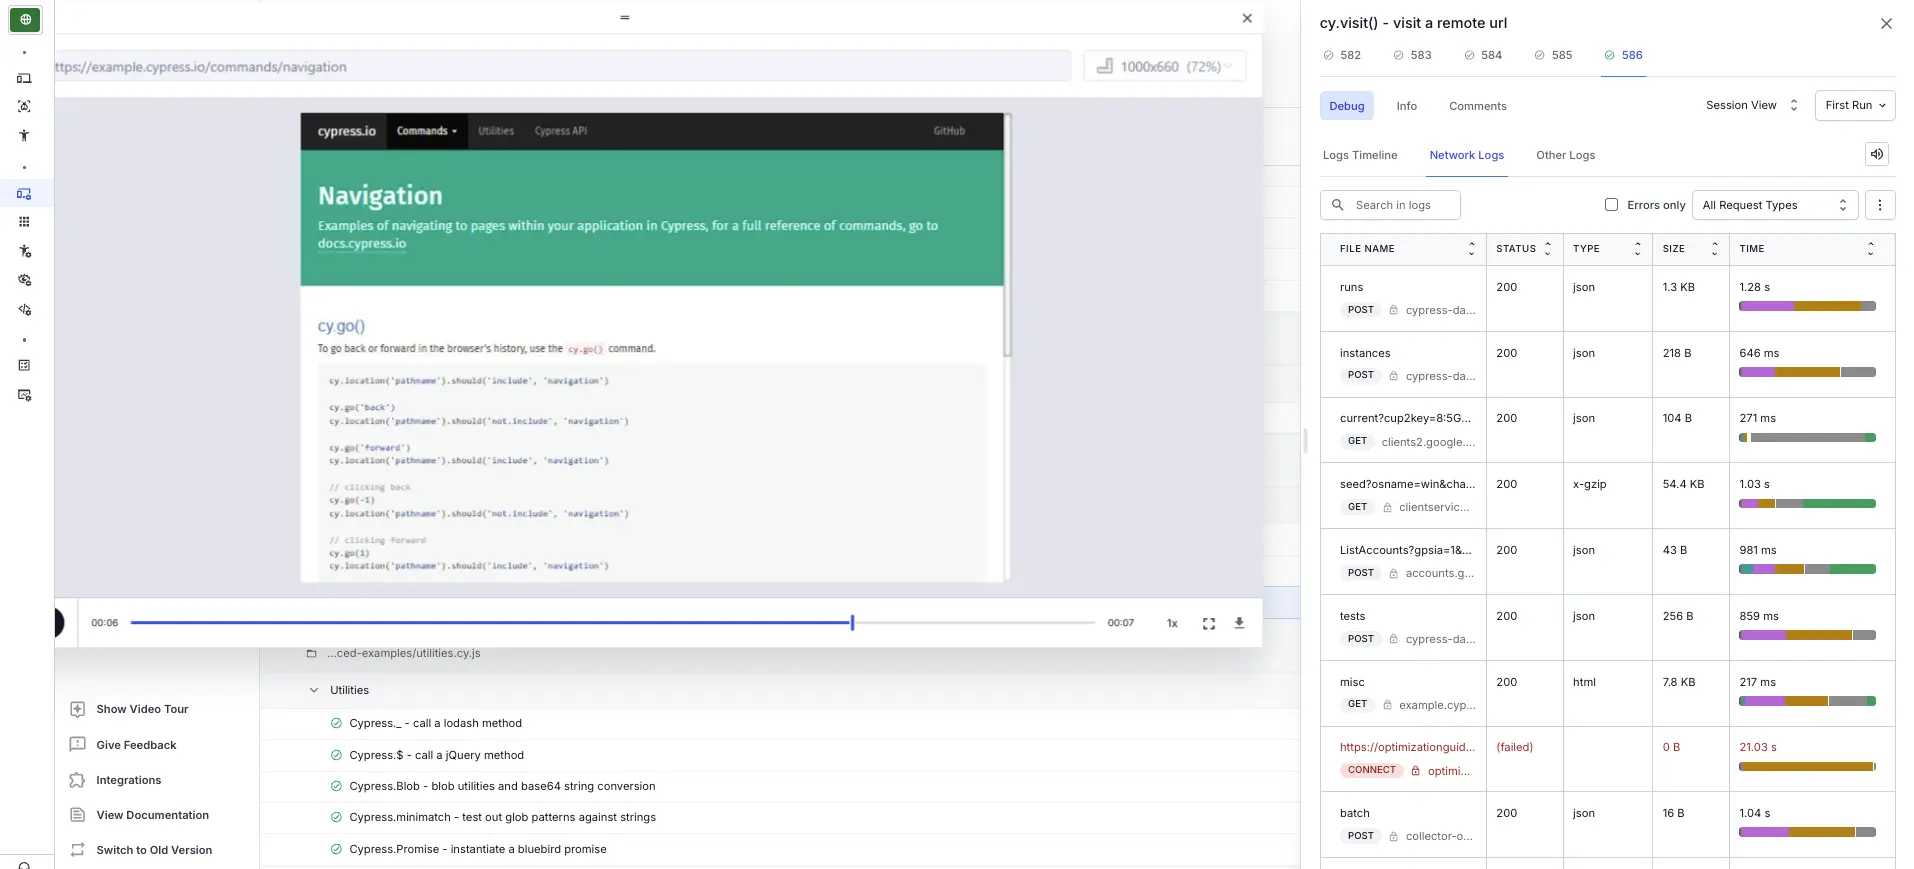
Network Logs
Network Logs capture the browser’s performance data such as network traffic, latency, HTTP requests and responses in the HAR(HTTP Archive) format. You can leverage Network logs to get a clear picture of all the requests your web page is making, and the time taken for each of these requests. You can download network logs via the Automate Dashboard. You can visualize HAR files using the HAR Viewer.
Install the latest version of BrowserStack Cypress CLI to use network logs: npm install -g browserstack-cypress-cli.
Network Logs are disabled by default. To enable Network Logs use the capability network_logs with the value true in browserstack.json.
| Capability | Description | Expected values |
|---|---|---|
network_logs |
Enable network logs | A string or a boolean. Defaults to false true or "true" if you want to enable the network logs. false or "false" otherwise. |
Network Log configurations
Apart from capturing the Network logs, you can also capture the request and response payload of your test session. You must set the networkLogsOptions capability and the captureContent configuration as true.
Use the following example code snippet to set the network log configurations:
The following table provides information about the capability:
| Capability | Configuration | Expected values |
|---|---|---|
networkLogsOptions |
captureContent |
Defaults to false. By default, network logs do not capture request and response payload. Set captureContent to true. |
We're sorry to hear that. Please share your feedback so we can do better
Contact our Support team for immediate help while we work on improving our docs.
We're continuously improving our docs. We'd love to know what you liked
We're sorry to hear that. Please share your feedback so we can do better
Contact our Support team for immediate help while we work on improving our docs.
We're continuously improving our docs. We'd love to know what you liked
Thank you for your valuable feedback!