Custom Dashboard
Create custom dashboards with BrowserStack to track key metrics for QA, health, and release readiness.
The Custom Dashboard feature provides users with the flexibility to create personalized dashboards tailored to their specific needs. Users can customise layouts, add various metric widgets, and redefine metric parameters to track key performance indicators, offering a comprehensive view of user-specific targets.
Use cases
It solves the following use cases:
- QA Team performance: Custom dashboards provide real-time visibility into QA activities. You can track metrics like test execution times and defect resolution rates. Teams can identify bottlenecks and improve efficiency.
- Health monitoring: Use dashboards to easily track your apps’ health. Spot issues quickly and ensure your system stays stable.
- Release readiness: Custom dashboards offer a comprehensive overview of test coverage and defect counts. It makes it easier to evaluate whether release is on track. This ensures a smoother and more reliable deployment process.
Benefits
It provides the following benefits:
- Personalization: Customize the dashboard’s layout, widgets, and visualizations to reflect your specific test performance criteria.
- Targeted insights: Gain precise insights by configuring the dashboard to highlight key performance indicators and trends. It helps you to identify areas for improvement and make data-driven decisions.
- Shareable dashboard views: Easily share your customised dashboard with team members or stakeholders. It allows you to collaborate and ensure your teams members are aligned with the latest performance metrics.
Create custom dashboards
To create a custom dashboard:
- Log in to Quality Engineering Insights**.
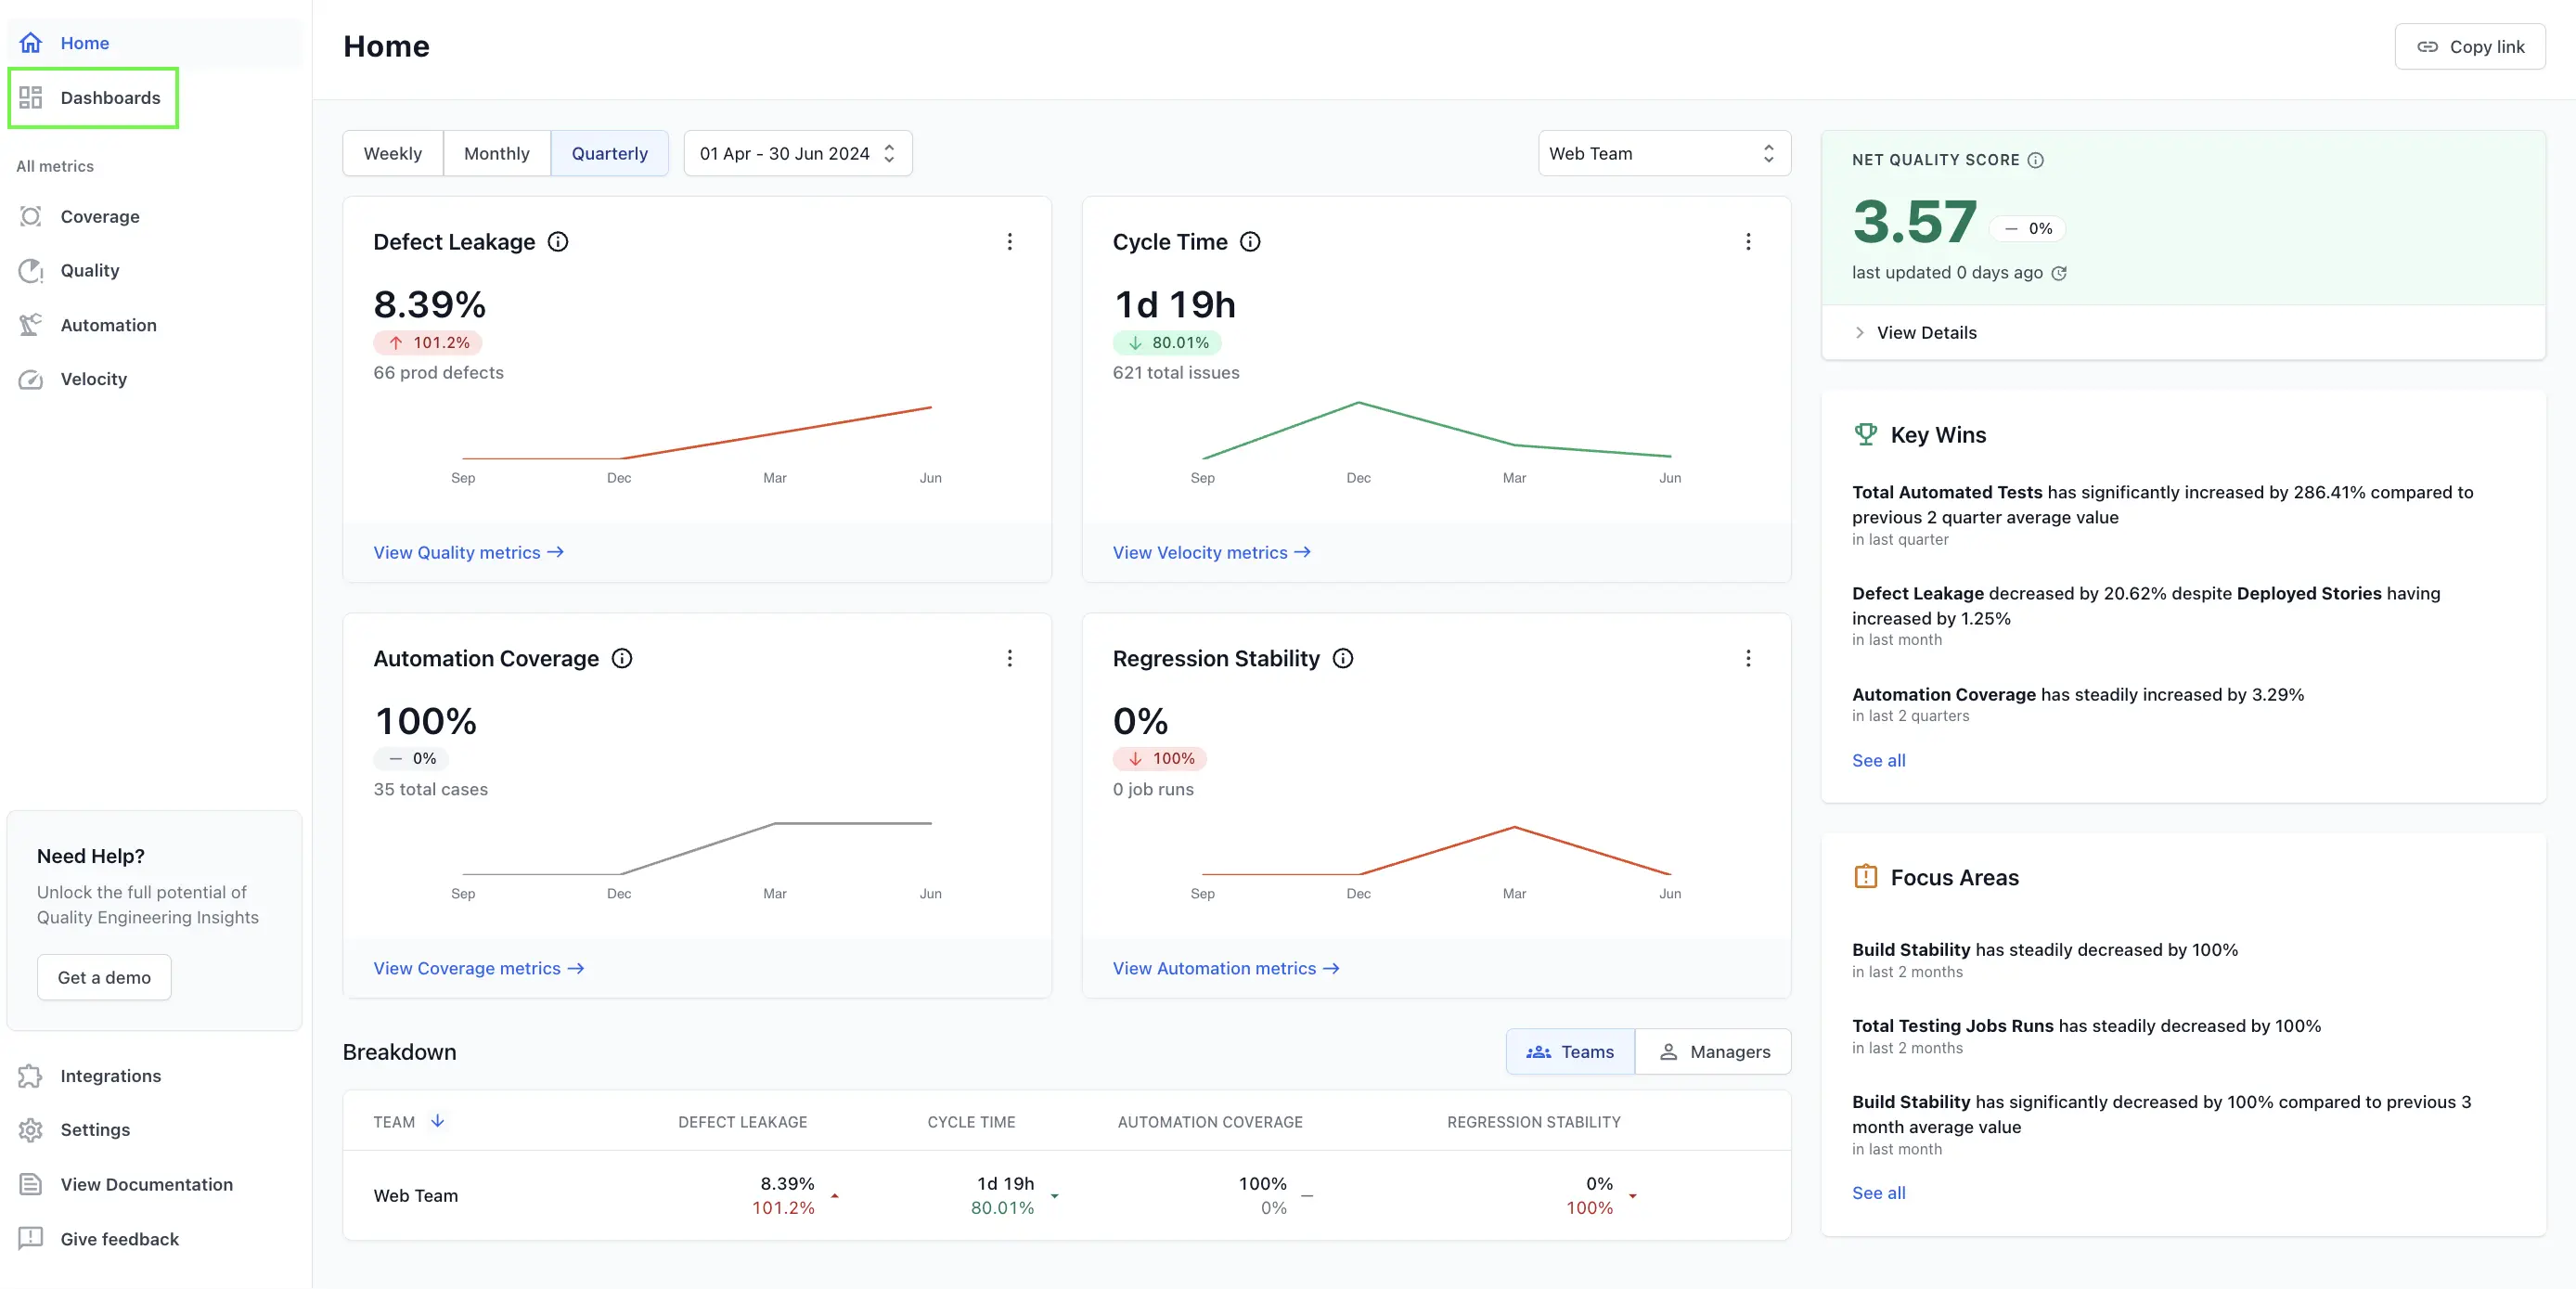
- Click Dashboards.

- Click Create Dashboard.
- Select a widget or click View more widgets.
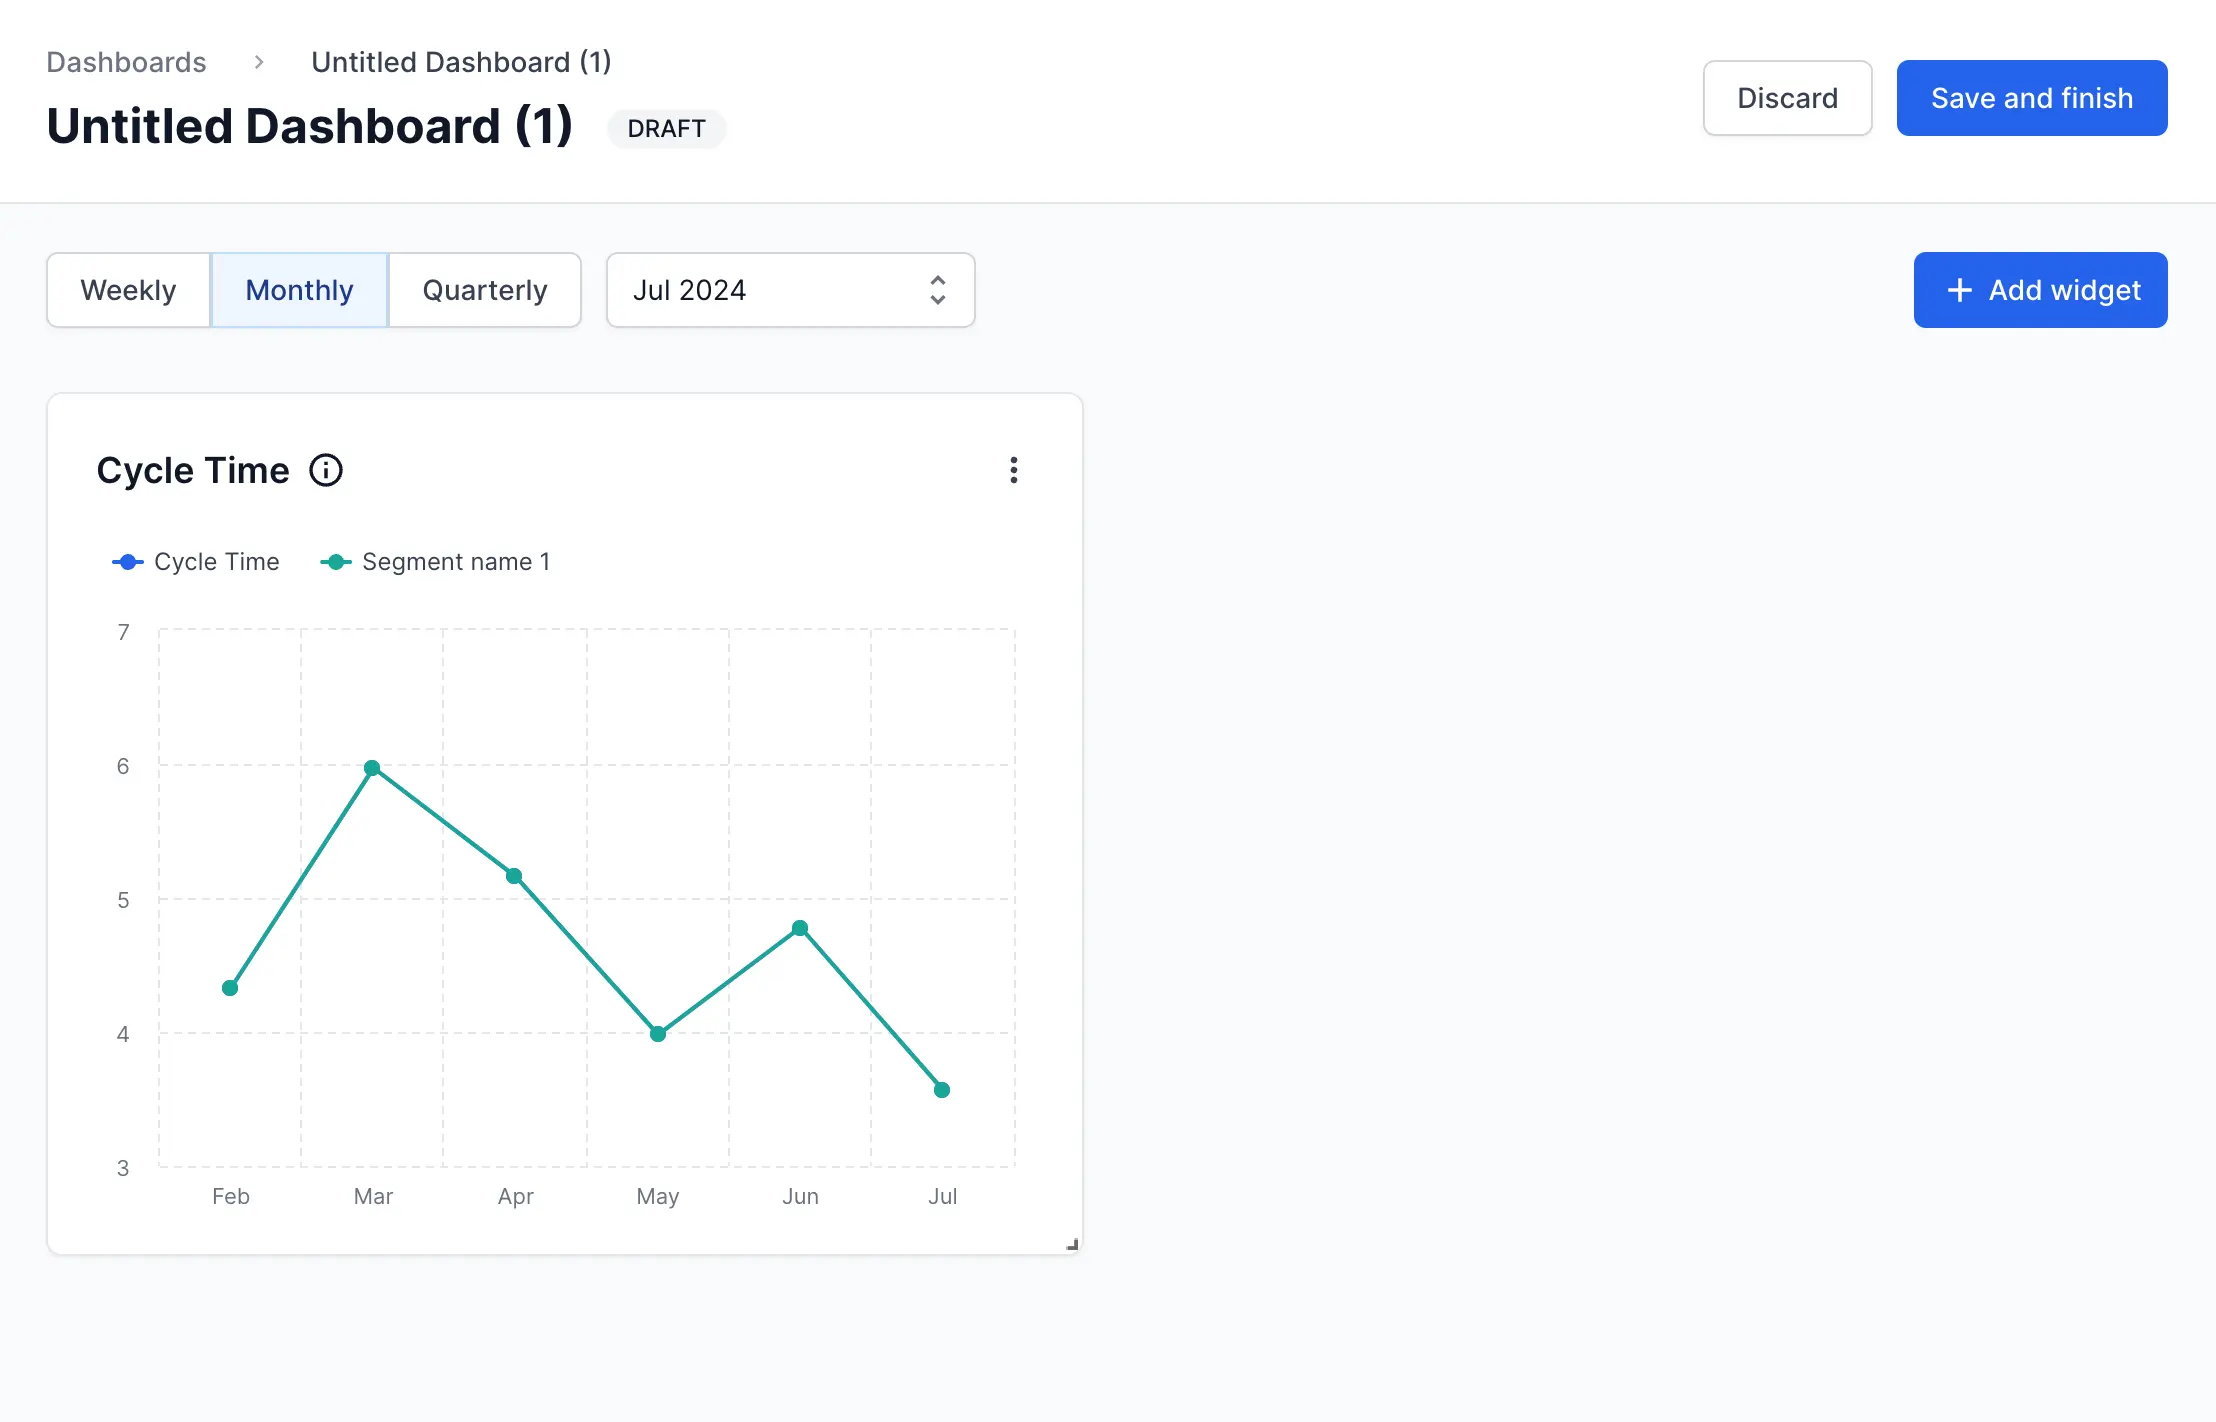
- Select the required widget. For example, Cycle Time.
- Configure the widget to include more data points and click Done. In the Cycle Time widget, you can add a widget name, widget description, enable chart summary, and add segments.

- You can add one or more widgets. Additionally, you can rearrange and resize the existing widgets as needed. Click Save and finish.

- The Save Dashboard window appears. Enter a name for the dashboard and enable the Public Dashboard toggle to make your dashboard accessible to everyone in your team
- Click Done.
Check out Metrics and Insights to know more details about various dashboards.
We're sorry to hear that. Please share your feedback so we can do better
Contact our Support team for immediate help while we work on improving our docs.
We're continuously improving our docs. We'd love to know what you liked
We're sorry to hear that. Please share your feedback so we can do better
Contact our Support team for immediate help while we work on improving our docs.
We're continuously improving our docs. We'd love to know what you liked
Thank you for your valuable feedback!