Unique Errors
Discover an innovative method to improve your test suite by tracking unique errors.
With Unique Errors, you can improve the health of your test suites in a unique, yet highly effective way - fixing one underlying error can fix tens of others. Additionally, Unique Errors helps you understand patterns that could contribute to failures, such as ways to write specific test cases or errors in application code.
This platform feature is available with Automate, App Automate, Test Management, Test Reporting & Analytics, and Automate TurboScale.

How to use Unique Errors?
Accessing Unique Errors
To navigate to Unique Errors, click Unique Errors in the menu bar.
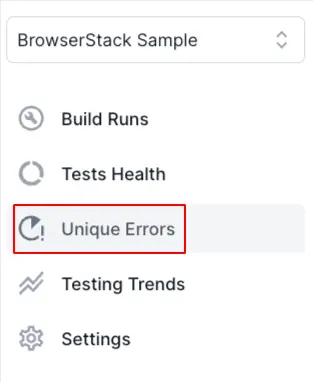
This opens up the Unique Errors view.
Explore Unique Errors
Let’s explore the capabilities and features of the Unique Errors view.
View errors within a specific time window
You can use the date range selector located in the top-right corner to filter the errors encountered within the last seven days, thirty days, or two months. Alternatively, you can specify a custom start and end date to focus on the errors within a specific time frame.
Apply filters based on specific criteria
Unique Errors provides a range of filters for refining the errors. To access these filters, click the Filters button in the top-right corner. A sidebar appears where you can select the desired filters. After you’ve made your selections, click the Apply button to filter the errors based on your chosen criteria.
Search for an error
The search bar allows you to find a specific error based on common keywords.
View graphs on error statistics
Unique Errors displays the following charts based on your chosen filters and date range:
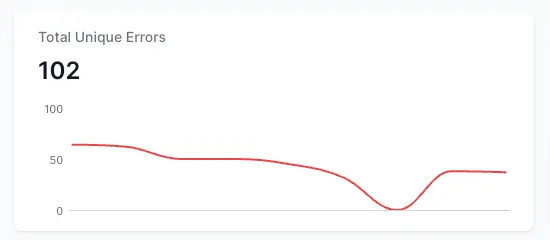
-
Total Unique Errors: This chart illustrates the daily change in the total number of unique errors over time.
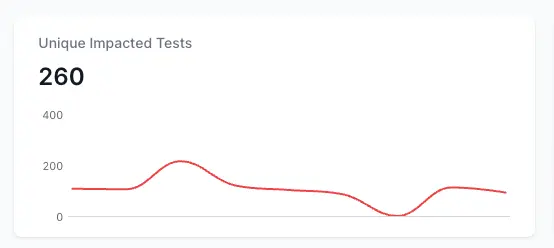
-
Unique Impacted Tests: This chart illustrates the daily change in the number of unique test cases impacted by the errors in your test suite.
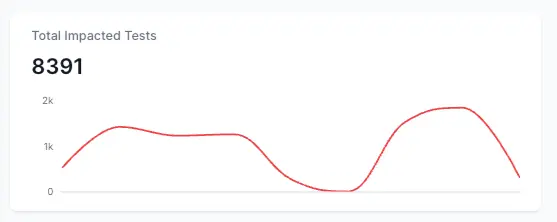
-
Total Impacted Tests: This chart illustrates the change in the total number of test executions that failed due to errors over time.
Inspect errors and the impacted tests
Unique Errors lists all the errors according to the filters that you choose. This list of errors includes the following additional information:
- Impacted tests
- Error count
You can sort the errors by error count or the number of impacted tests.
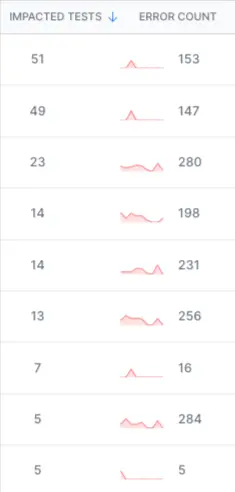
You can hover over an error to view the entire stack trace. Also, you can click an error to view all the tests that are impacted by that particular error.
View detailed information on test runs impacted by an error
You can click on an impacted test to open a detailed view of that test and the error that caused it. The Runs tab of the detailed view opens up by default. In the Runs tab, you can find details about the error and a chart that illustrates the run duration of the impacted test across individual executions. You can interact with the chart by hovering over it or clicking on a particular execution.
You can also view how the impacted test ran across multiple builds. You can use this view to gain insights such as when an error started appearing and under which conditions the error occurs.
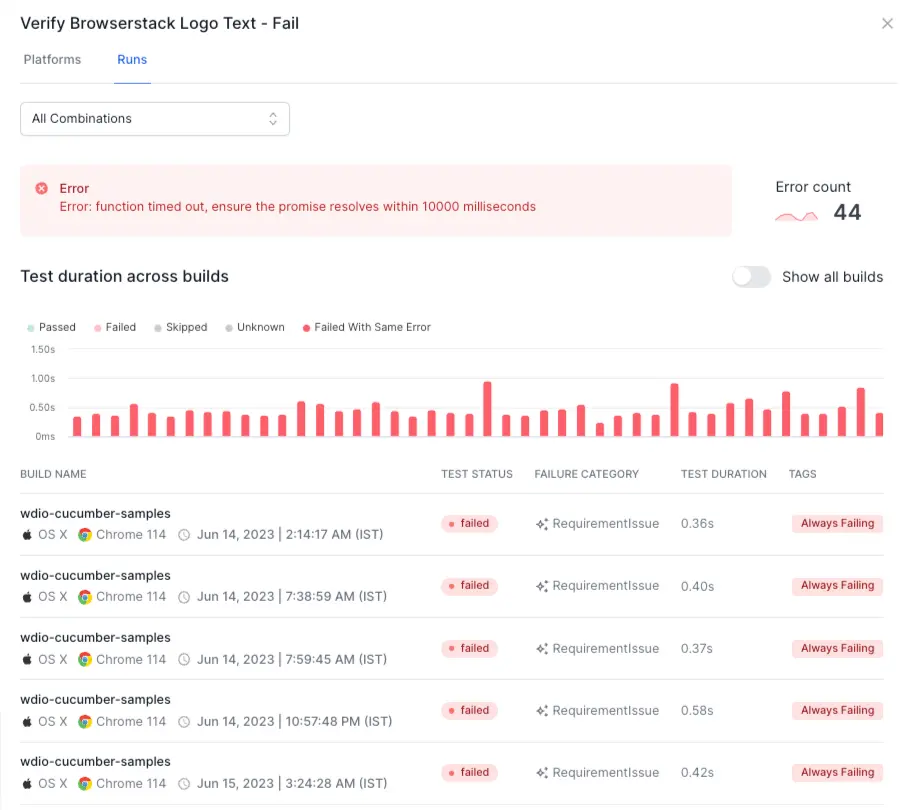
You can click a build to open the Timeline Debugging view and investigate more details.

In the detailed view, you can use the Platforms tab to understand whether the error is specific to a particular browser, device, or operating system. If the error occurs only in some platforms, you can quickly identify it and work towards a solution.
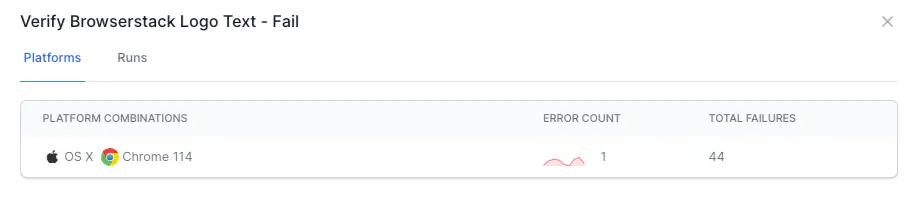
You can click on a platform to view filtered run data for that particular platform.
Explore Unique Errors in the demo sandbox
You can explore Unique Errors in the Test Reporting & Analytics demo sandbox.
We're sorry to hear that. Please share your feedback so we can do better
Contact our Support team for immediate help while we work on improving our docs.
We're continuously improving our docs. We'd love to know what you liked
We're sorry to hear that. Please share your feedback so we can do better
Contact our Support team for immediate help while we work on improving our docs.
We're continuously improving our docs. We'd love to know what you liked
Thank you for your valuable feedback!