View test results
View your Cypress test results on the Automate Dashboard.
After running your Cypress tests on BrowserStack, you can view the test results on the Automate dashboard.
Within a spec, each combination is an execution. The tests are grouped by their build names and further combined into test spec and browser combinations (OS, OS version, browser, and browser version) you selected to run your tests on. The Automate dashboard displays test results, video, and a screenshot of the error in case of a failed test.
You can view the results of the tests, as well as debug the tests using the different logs that are accessible from the dashboard.
Starting CLI v1.6.0 and higher, if you run tests in the sync mode, test results are automatically saved to the results folder as HTML and JSON files. You can attach these files to your CI runs.
Build view in Automate dashboard
The Automate dashboard displays a list of builds that have run through your organization’s account as shown in the following screenshot:
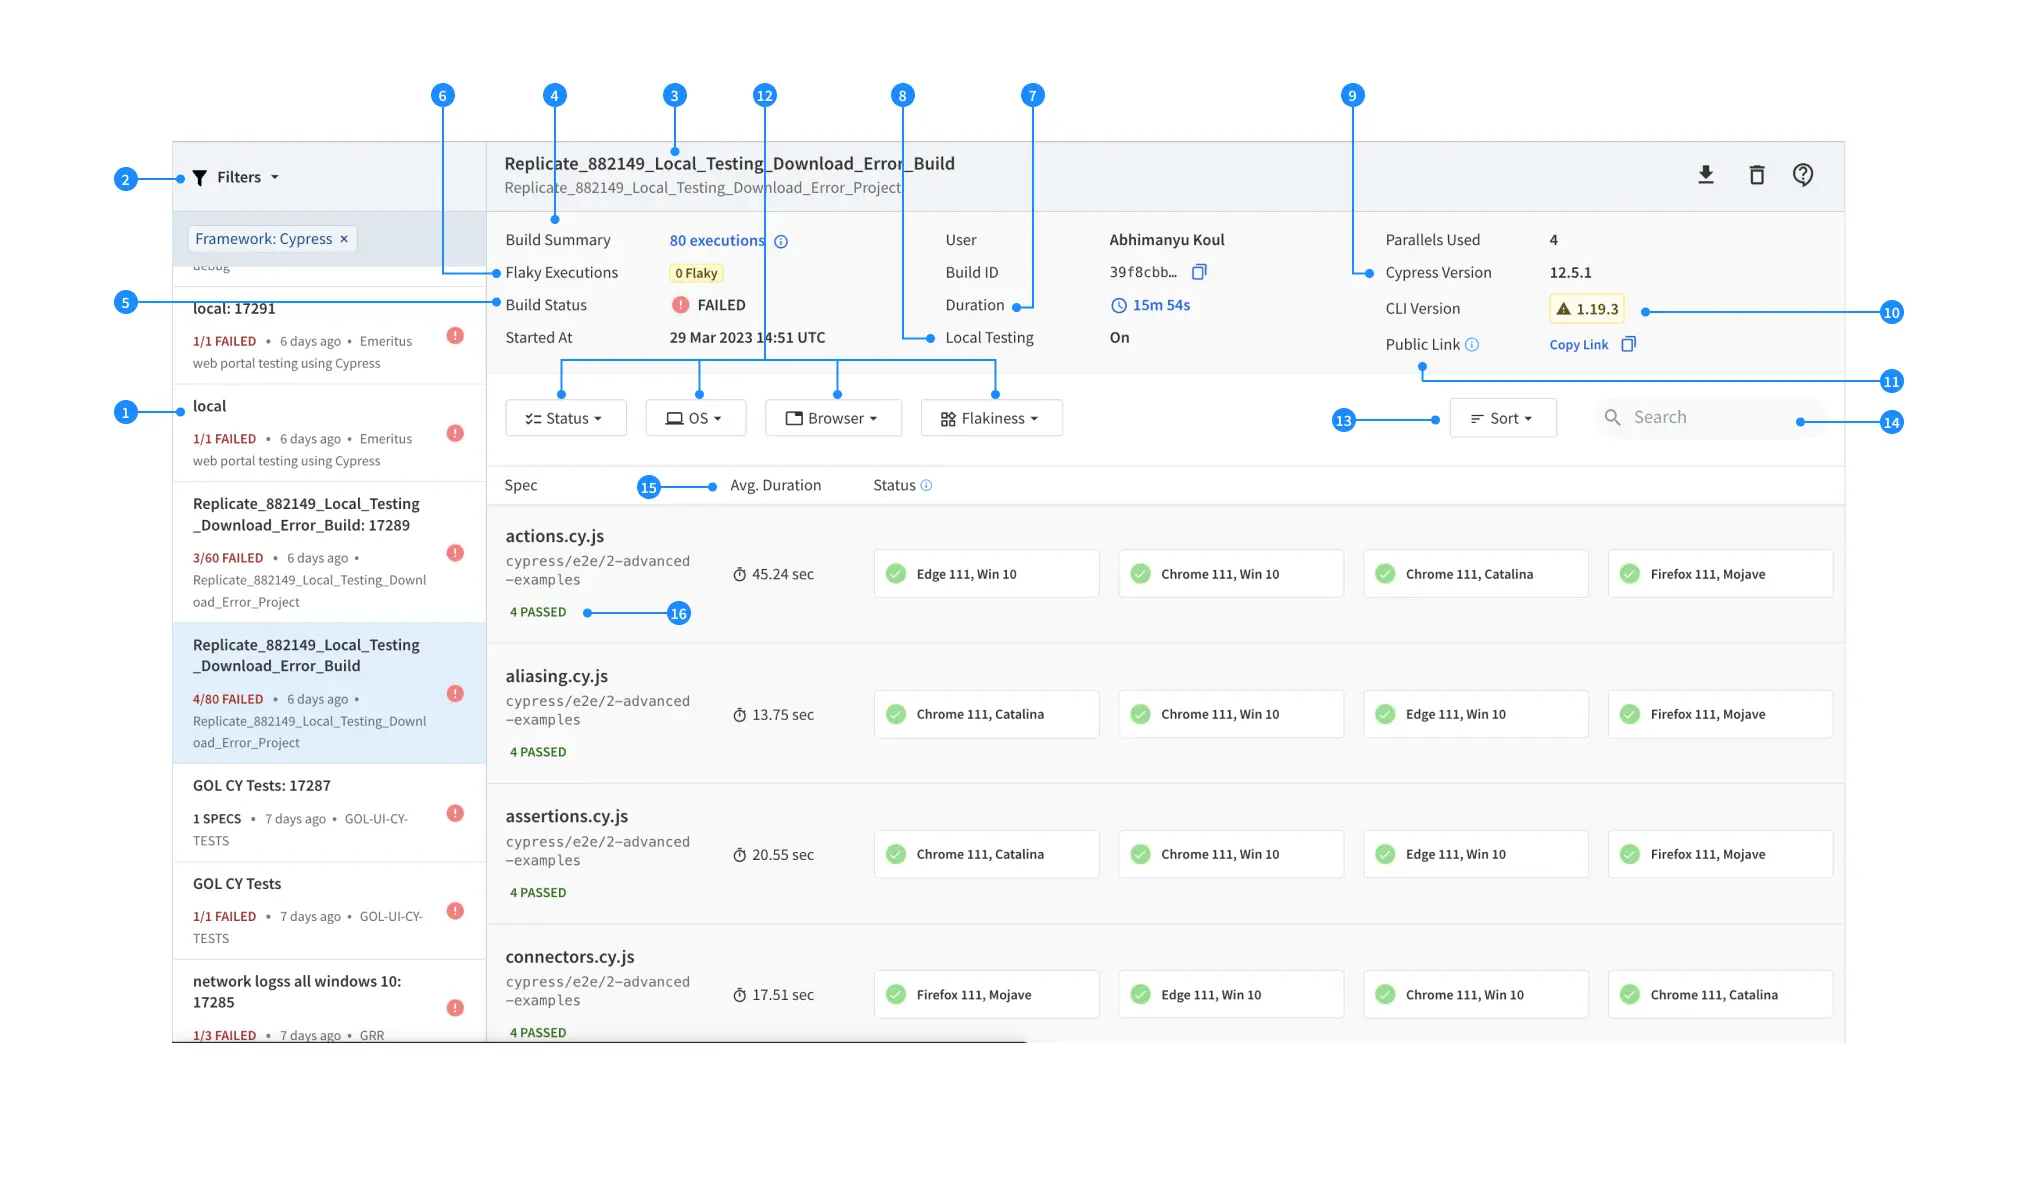
- Sidebar: Enables quick access to all your builds. The sidebar also displays meta information such as the number of sessions, the status of sessions, and the project name.
- Builds filter: Filters your builds by the user, project, framework or status. As you apply filters, the dashboard URL changes, enabling you to share filtered views with other team members.
- Build name: Shows the build name and project name.
-
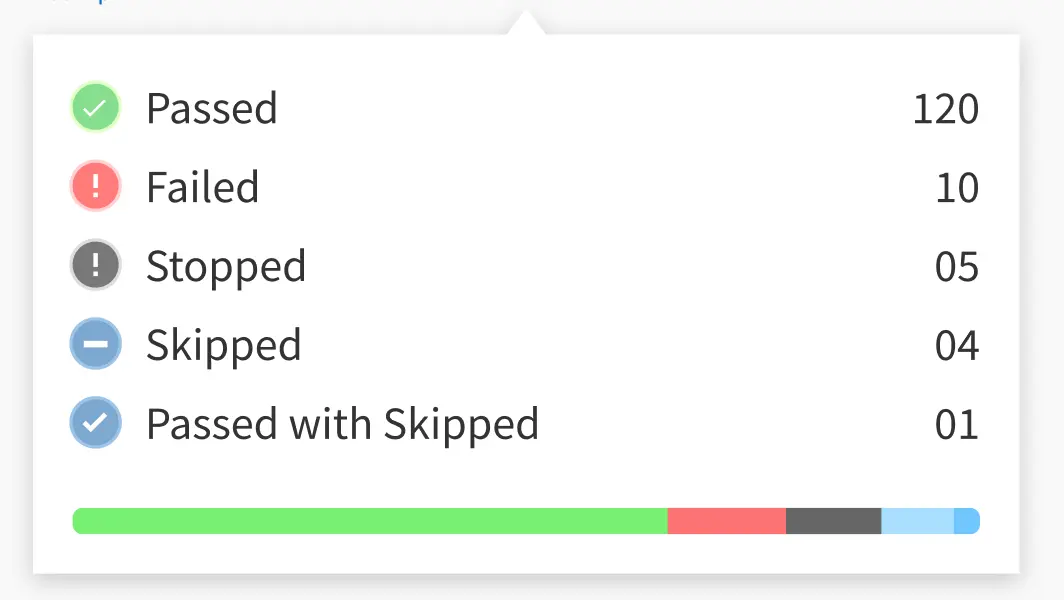
Build Summary: Provides the overall summary of the executions, including, the number of executions marked as Passed, Failed, Stopped, Passed with Skipped or Skipped.
-
Build Status: The build status can be any of the following:
- COMPLETED: If the status of all test sessions in the build is completed.
- STOPPED: If the spec run has been stopped either by you or by BrowserStack.
- FAILED: If one or more test failed in the build.
- SKIPPED: If one or more test is skipped.
- PASSED WITH SKIPPED: If one or more tests in the spec are skipped or pending, while the other tests pass.
- Flaky Execution: Shows the number of executions that have tests marked as flaky.
-
Duration: Represents the total amount of time needed for the Cypress build to finish on BrowserStack. Hovering on Duration displays a detailed breakdown of the time lapsed. The time distribution is normalised to one parallel/thread when the build is run on multiple parallels.
 These details include:
-
setup_time: Time spent in setting up the machine, such as installing the required npm packages, downloading specs, setting up local connection, etc. -
test_run_time: Time spent in running your tests. -
misc_time: Time spent on tasks other than setup and test runs. This includes the time spent in queue due to parallel unavailability, and the time any of the parallels were not utilized for the current build despite availability, which occurs when one or more threads take longer to complete the execution while other threads are idle.
-
- Local Testing: Displays whether Local Testing is enabled in your tests. Learn more about Local Testing
- Cypress Version: Displays the Cypress version you have configured in your test script. Refer to the Cypress Version doc to learn more about setting the latest Cypress version in your test script.
- CLI Version: Displays the running CLI version. Refer to the CLI Reference doc for list of all the commands and arguments supported by the BrowserStack-Cypress CLI.
- Public Link: Allows you to copy the public URL of the current build. This public link enables unauthenticated sharing of the build. To disable from the dashboard, build reports, and REST API, reach out to the Support team.
- Build level filter: Filters the specs in a build by spec status, OS, Browser and Flakiness.
- Sort: Allows you to sort sessions based on the length of execution.
- Build level search: Searches specific sessions in a build using the build-level search. You can search for a session by its name or ID.
- Average Duration: Displays the average run time of all the execution in a spec.
- Spec Status: Displays the status of all the executions within the spec.
Session view in Automate dashboard
After you click on a particular execution in the build view, you will be taken to the session details view of the Automate dashboard as shown in the sample screenshot below:
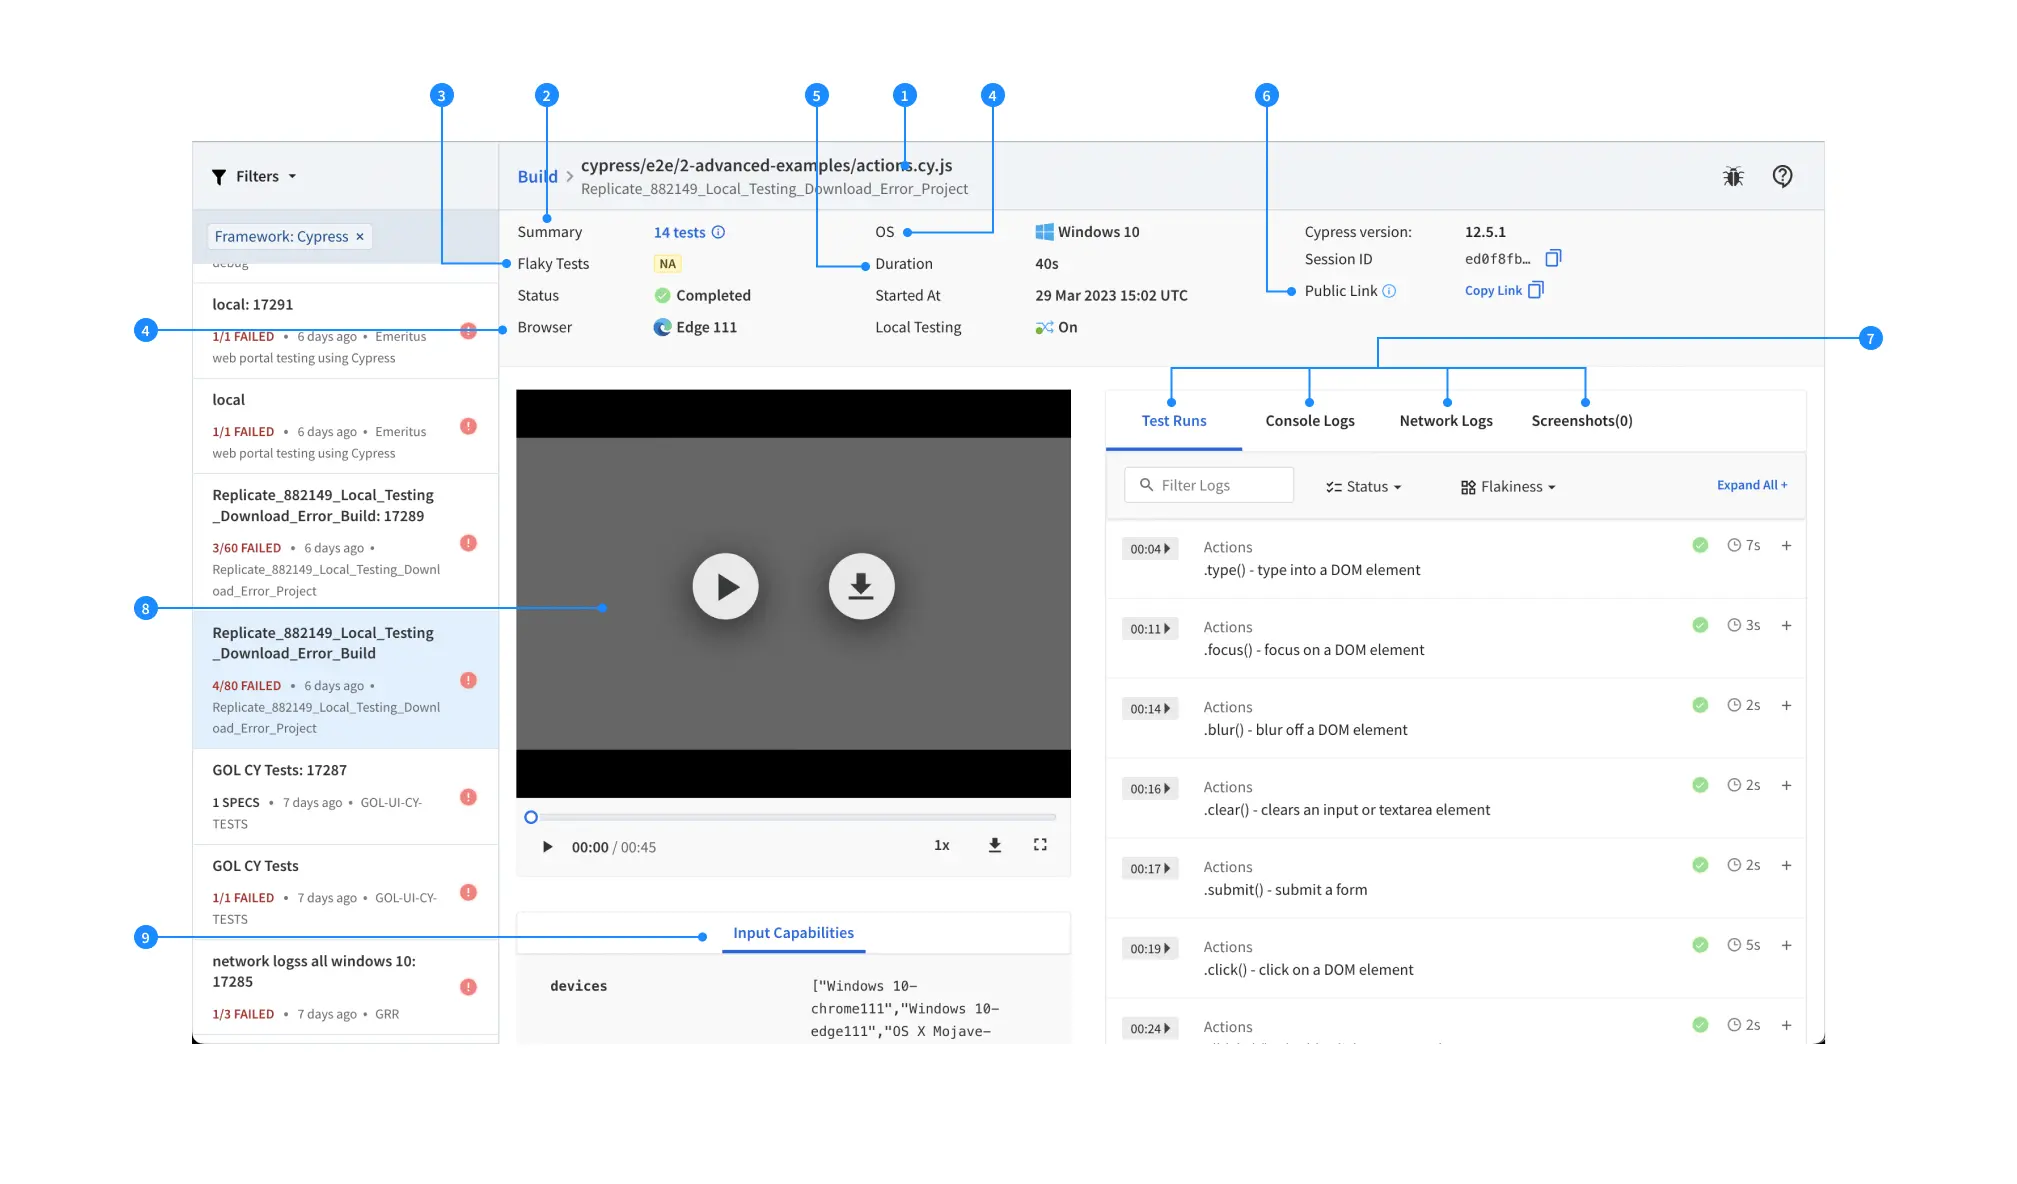
- Spec name: Displays the spec name. Click Build to return to the builds view.
-
Execution Summary: Displays the total number of tests within the Spec. On hover, displays the number of tests marked as Passed, Failed, Pending, or Skipped.
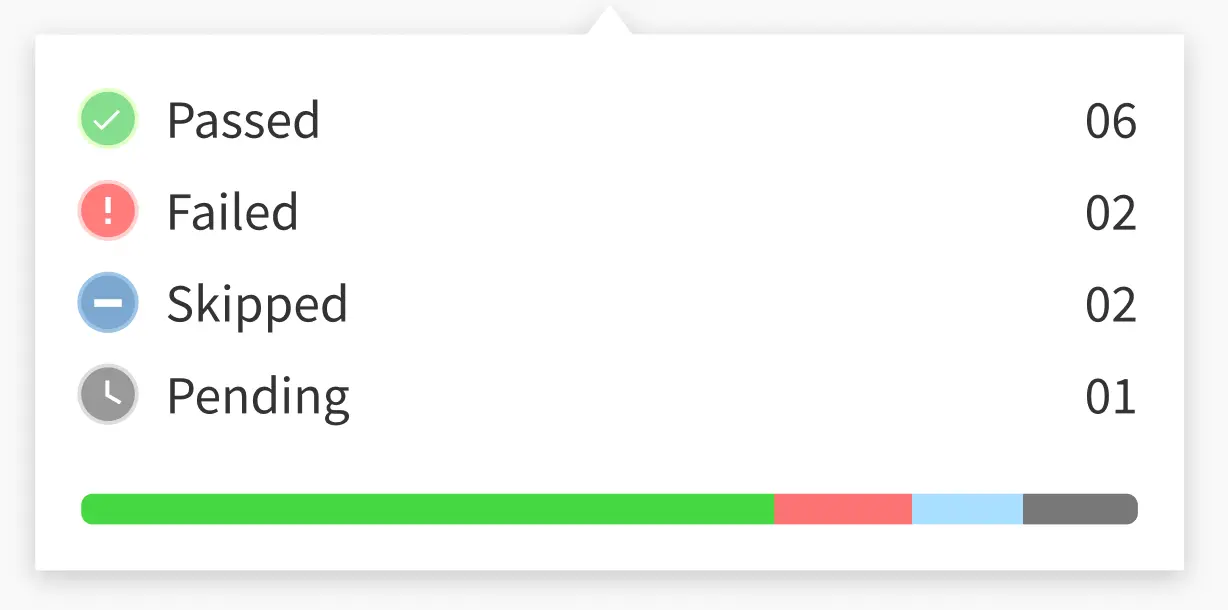
- PASSED: If the status of all tests in the spec is completed.
- PENDING: If the test block is not completed or have
xitorit.skipin the syntax, the tests are marked as pending. - FAILED: If one or more tests failed in the spec.
- SKIPPED: If the tests within a spec were skipped due to run-time error.
- Flaky Tests: Displays the number of tests marked as Flaky.
- Browser-OS: Provides Browser-OS combination about the current test.
- Duration: Provides the total duration of the test.
- Public Link: Allows you to copy the public URL of the current session. This public link enables unauthenticated sharing of the session. To disable from dashboard, build reports, and REST API, reach out to the Support team.
-
Logs: Select Test Runs, Console Logs, Network Logs, or Screenshots, to view all the steps executed in the test, or the error message captured when the build failed.
-
Text Runs: Text Runs are a comprehensive record of your Cypress test. They are used to identify all the steps executed in the test and troubleshoot errors for the failed step.
- Filter Logs: Filters the logs on the basis of the text search query.
- Timestamp Jump: To jump to a particular timestamp in the video recording.
- Flakiness Filter: Filters the test based on the Flakiness.
- Status Filter: Filters the test based on the test status.
- Console Logs: Console Logs capture the console output at various steps of the test to troubleshoot issues.
- Network Logs: Network Logs capture the browser’s performance data such as network traffic, latency, HTTP requests and responses in the HAR(HTTP Archive) format.
- Screenshot: Screenshots are particularly helpful whenever a browser test fails as they help you retrace the steps which led to the failure.
-
Text Runs: Text Runs are a comprehensive record of your Cypress test. They are used to identify all the steps executed in the test and troubleshoot errors for the failed step.
-
Video: Captures the test recording as it happens in the execution. Use this recording to go at a precise point in time when an error occurred and debug.
Setvideototruein thecypress.jsonfile (for Cypress 9 and earlier) or thecypress.config.jsfile (for Cypress 10 and later) to enable videos for your Cypress tests.
Some points in the progress bar of the recording may be marked in Red or Yellow during the test run, indicating issues. Each color represents the following issues:-
Red:
- BrowserStack-specific errors such as
SO_Timeout - Console annotator marked as
Error - Session marked as
failedusing JavaScript executor, API, or SDK
- BrowserStack-specific errors such as
-
Yellow:
- Any log that is tagged as a
Warning - Console annotator marked as
warn - Selenium exceptions
- Any log that is tagged as a
-
Red:
- Input Capabilities: Shows a well-formatted view of the input capabilities that you supplied. These are visible by default and are searchable using the browser’s default find feature.
We're sorry to hear that. Please share your feedback so we can do better
Contact our Support team for immediate help while we work on improving our docs.
We're continuously improving our docs. We'd love to know what you liked
We're sorry to hear that. Please share your feedback so we can do better
Contact our Support team for immediate help while we work on improving our docs.
We're continuously improving our docs. We'd love to know what you liked
Thank you for your valuable feedback!