Debug Failed Puppeteer Tests
A guide to using the various debugging tools available in the BrowserStack Automate dashboard to debug your failed cross-browser Puppeteer tests
If you are using the older dashboard, refer to the old dashboard documentation.
Interactive Session
The interactive session feature allows you to control your Puppeteer test while it is executing on the remote browser.
Consider a use case where you are testing a webapp which requires an input using a mouse pointer. Since testing this functionality with a test script will be difficult, you will need to try it out yourself to test the behavior of your webapp. In this case, you need to add a breakpoint after your webapp is initialised, start an interactive session, and try out the input actions using your mouse.
Perform the following steps to start an interactive session:
- Insert breakpoints into the test script to prevent execution from continuing.
- Run the test and view your session running on the BrowserStack Automate dashboard.
- Click the Start an interactive session link that appears in the video recording area as seen in the following image:
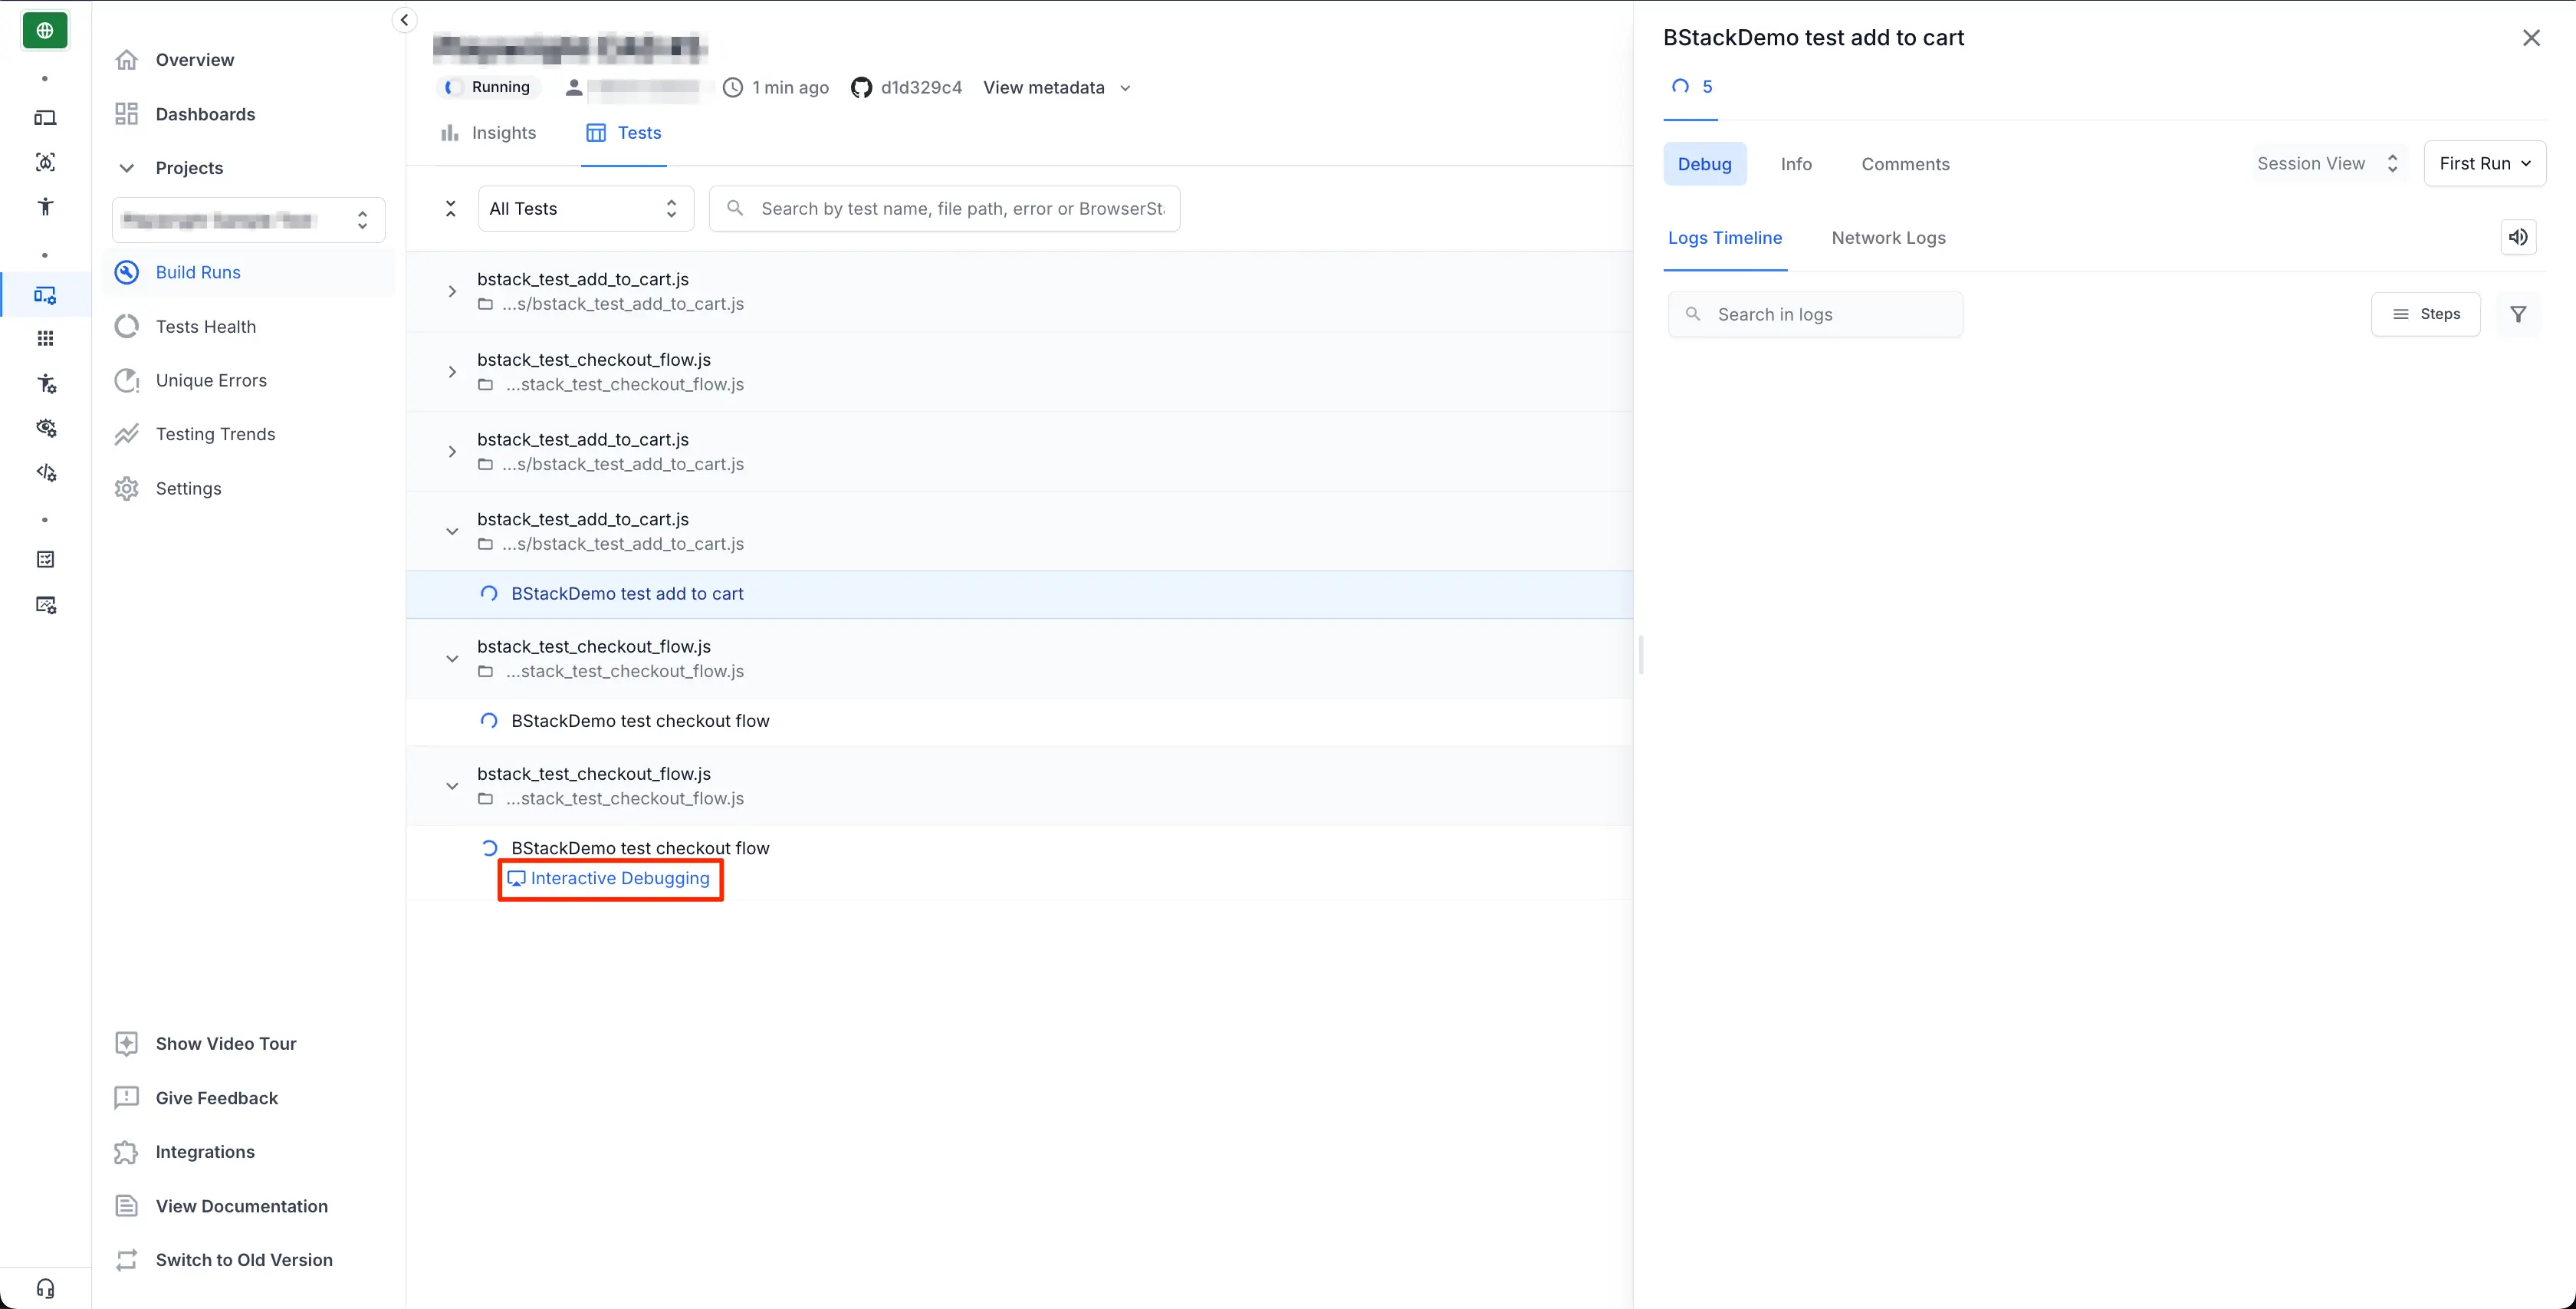
- Observe and control the ongoing test execution in the remote browser once the interactive session begins.
Video Recording
Every Puppeteer test run on BrowserStack is recorded exactly as it is executed on our remote machine. Video recordings are particularly helpful whenever a browser test fails as they help you retrace the steps which led to the failure. You can access the video recordings from Automate Dashboard for each session. You can also download the videos from the Dashboard or retrieve a link to download the video using our getSessionDetails executor.Learn more about getSessionDetails executor
You can run the following script at any point in your Puppeteer script to retrieve the video link using getSessionDetails:
const resp = await JSON.parse(await page.evaluate(_ => {}, `browserstack_executor: ${JSON.stringify({action: 'getSessionDetails'})}`));
console.log(resp.video_url);  // This gives the video URL of the running session. You can access it once after the test session is completed
Text Logs
Text Logs are a comprehensive record of your Puppeteer test. They are used to identify all the steps executed in the test and troubleshoot errors for the failed step. You can get verbose details of every step performed within your Puppeteer test using Test Logs.
You are enabled by default, and cannot be disabled. You can access the Text Logs in a session on Automate Dashboard.
You can also get the URL for downloading the Text Logs using getSessionDetails from within the test script as shown below:
const resp = await JSON.parse(await page.evaluate(_ => {}, `browserstack_executor: ${JSON.stringify({action: 'getSessionDetails'})}`));
console.log(resp.logs);  // This gives the Text Logs URL of the running session. Hit the URL once after the session is complete.
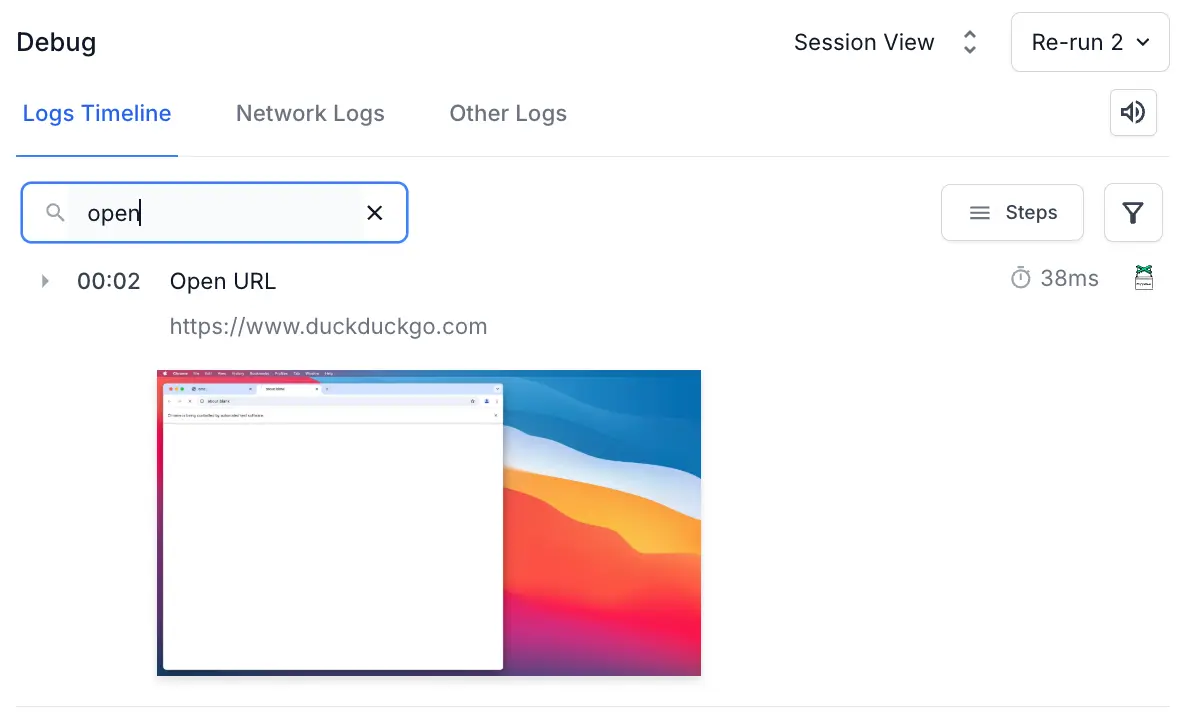
You can search within text logs using Find in Logs to jump to a specific section of the logs. It highlights all occurrences while performing the search in real time. Furthermore, you can conveniently navigate through each occurrence using the Enter key or the Up/Down arrow keys.
Visual Logs
Visual Logs automatically capture screenshots at every Puppeteer command executed during your test. They help debug issues detected through your Puppeteer tests. Visual Logs help with debugging the exact step and the page where the failure occurred. They also help identify any layout or design related issues with your web pages on different browsers.
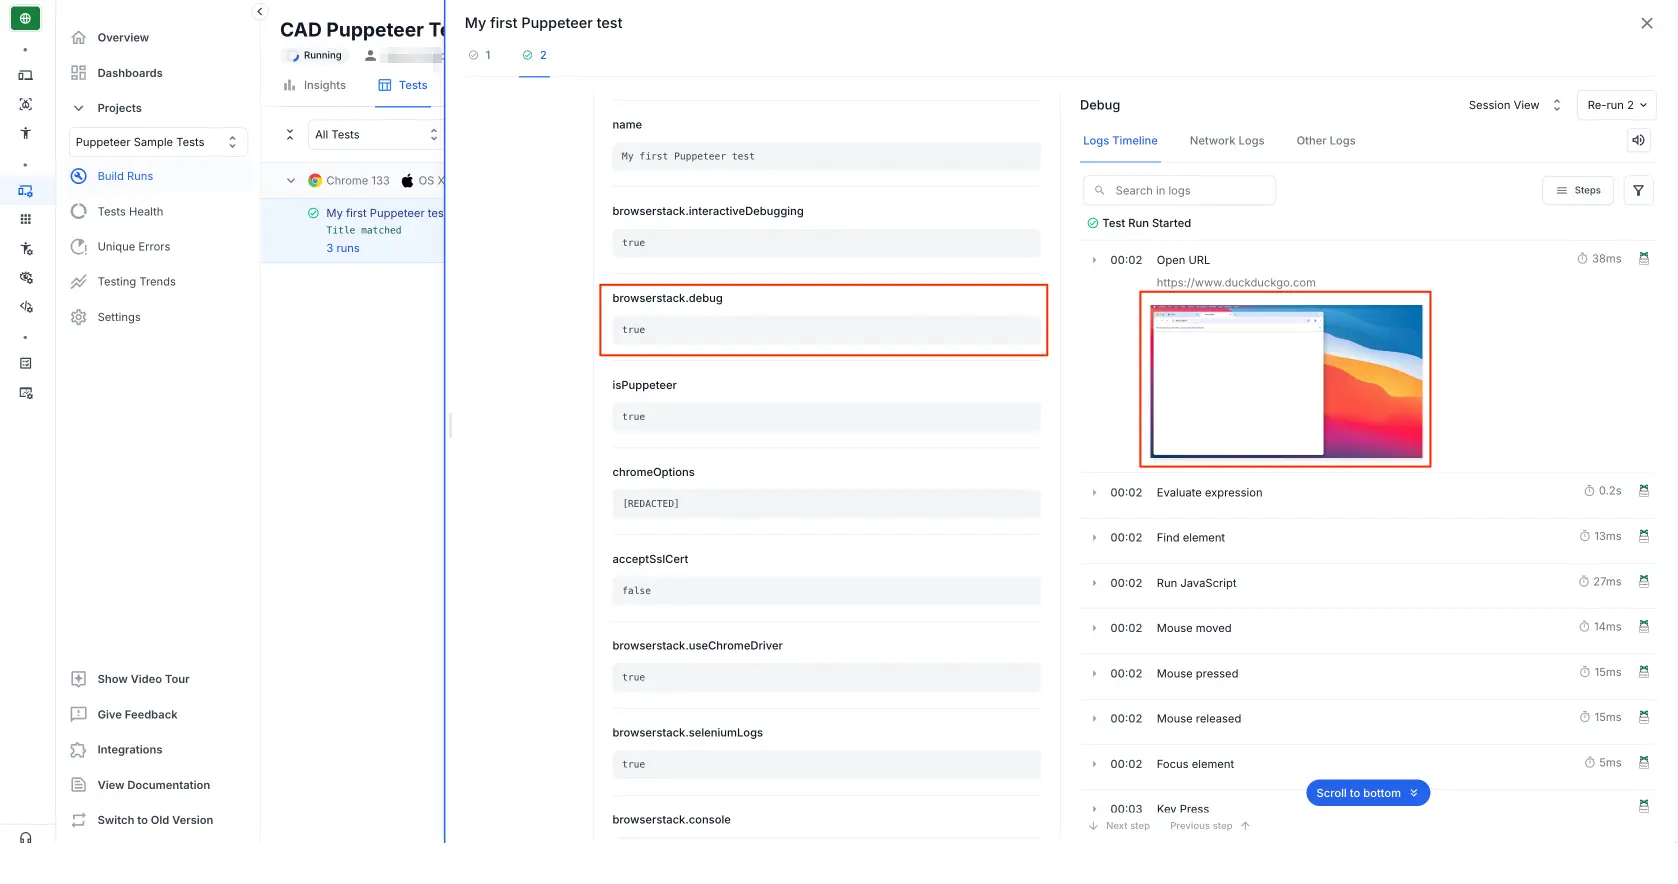
Visual Logs are disabled by default. In order to enable Visual Logs you will need to set browserstack.debug capability to true.
Additionally, if you want to capture screenshots at any point in the script for debugging purposes, use the following code snippet:
await page.screenshot({ path: '<image-name.png>' });
Access Visual Logs from Automate Dashboard:
Network Logs
You can get a comprehensive log of all network activity during your Puppeteer tests using the Network Logs feature. Network Logs capture the browser’s performance data such as network traffic, latency, HTTP requests and responses in the HAR(HTTP Archive) format. You can leverage Network logs to get a clear picture of all the requests your web page is making, and the time taken for each of these requests. You can download network logs using the getSessionDetails executor or via the Automate Dashboard. You can visualize HAR files using the HAR Viewer.
Network Logs are disabled by default in your Puppeteer tests. To enable Network Logs use the capability browserstack.networkLogs with the value true within the caps JSON as shown in the sample script.
You can also get the URL for downloading the Network Logs using getSessionDetails from within the test script as shown below:
const resp = await JSON.parse(await page.evaluate(_ => {}, `browserstack_executor: ${JSON.stringify({action: 'getSessionDetails'})}`));
console.log(resp.har_logs_url);  // This gives the Network Logs URL of the running session. You can get the data from the URL after the session is complete.
Console Logs
Console Logs capture the browser’s console output at various steps of the test to troubleshoot JavaScript issues.
Console Logs are by default enabled in tests, with log level set to errors.
To set different log levels, you need to use the capability browserstack.console with possible values:
disableerrorswarningsinfoverbose
You can access Console Logs in a session on Automate Dashboard.
You can also get the URL for downloading the Console Logs using getSessionDetails from within the test script as shown below:
const resp = await JSON.parse(await page.evaluate(_ => {}, `browserstack_executor: ${JSON.stringify({action: 'getSessionDetails'})}`));
console.log(resp.browser_console_logs_url);  // This gives the Console Logs URL of the running session. You can get the data from the URL after the session is complete.
Terminal logs
BrowserStack allows you to upload and view your Puppeteer terminal logs using REST API. On the Automate dashboard, click the Other Logs tab to view the terminal logs.
You can upload the terminal logs for specific sessions or the entire build using the Session API or the Build API, respectively. When you upload terminal logs using build API, the terminal logs will be uploaded for all the sessions associated with the build.
For terminal logs, BrowserStack supports .txt, .json, .xml, and .log file formats. The maximum file size you can upload is 2 MB.
After you upload the logs, click the Other Logs tab on the Automate dashboard to view them.
Sample script
Running the following sample script will display all of the capabilities described in this document on the Automate Dashboard:
'use strict';
const { strict } = require('once');
const puppeteer = require('puppeteer');
const expect = require('chai').expect;
(async () => {
  const caps = {
    'browser': 'chrome',  // You can choose `chrome`, `edge` or `firefox` in this capability
    'browser_version': 'latest',  // We support v83 and above. You can choose `latest`, `latest-beta`, `latest-1`, `latest-2` and so on, in this capability
    'os': 'os x',
    'os_version': 'big sur',
    'build': 'puppeteer-build-1',
    'name': 'My first Puppeteer test',  // The name of your test and build. See browserstack.com/docs/automate/puppeteer/organize tests for more details
    'browserstack.username': process.env.BROWSERSTACK_USERNAME || 'YOUR_USERNAME',
    'browserstack.accessKey': process.env.BROWSERSTACK_ACCESS_KEY || 'YOUR_ACCESS_KEY',
    'browserstack.debug': 'true',  // enabling visual logs
    'browserstack.networkLogs': 'true'  // Enabling network logs for the test
    };

    const browser = await puppeteer.connect({
    browserWSEndpoint:
    `wss://cdp.browserstack.com/puppeteer?caps=${encodeURIComponent(JSON.stringify(caps))}`,  // The BrowserStack CDP endpoint gives you a `browser` instance based on the `caps` that you specified
    });

    /*
    *  The BrowserStack specific code ends here. Following this line is your test script.
    *  Here, we have a simple script that opens duckduckgo.com, searches for the word BrowserStack and asserts the result.
    */
    const page = await browser.newPage();
    await page.goto('https://www.duckduckgo.com');
    const element = await page.$('[name="q"]');
    await element.click();
    await element.type('BrowserStack\n');
    await element.press('Enter');
    await page.waitForNavigation();
    const title = await page.title('');
    console.log(title);
    try {
        expect(title).to.equal("BrowserStack at DuckDuckGo", 'Expected page title is incorrect!');
        // following line of code is responsible for marking the status of the test on BrowserStack as 'passed'. You can use this code in your after hook after each test
        await page.evaluate(_ => {}, `browserstack_executor: ${JSON.stringify({action: 'setSessionStatus',arguments: {status: 'passed',reason: 'Title matched'}})}`);
    } catch {
        await page.evaluate(_ => {}, `browserstack_executor: ${JSON.stringify({action: 'setSessionStatus',arguments: {status: 'failed',reason: 'Title did not match'}})}`);
    }
    await browser.close();  // At the end of each of your tests, you must close the browser so that BrowserStack knows when to end the session.
})();
We're sorry to hear that. Please share your feedback so we can do better
Contact our Support team for immediate help while we work on improving our docs.
We're continuously improving our docs. We'd love to know what you liked
We're sorry to hear that. Please share your feedback so we can do better
Contact our Support team for immediate help while we work on improving our docs.
We're continuously improving our docs. We'd love to know what you liked
Thank you for your valuable feedback!