View Puppeteer test results
A guide to viewing Puppeteer test results on BrowserStack Dashboard
After running your tests on BrowserStack, you can view results for the same from the Automate Dashboard.
Puppeteer build view on Automate Dashboard
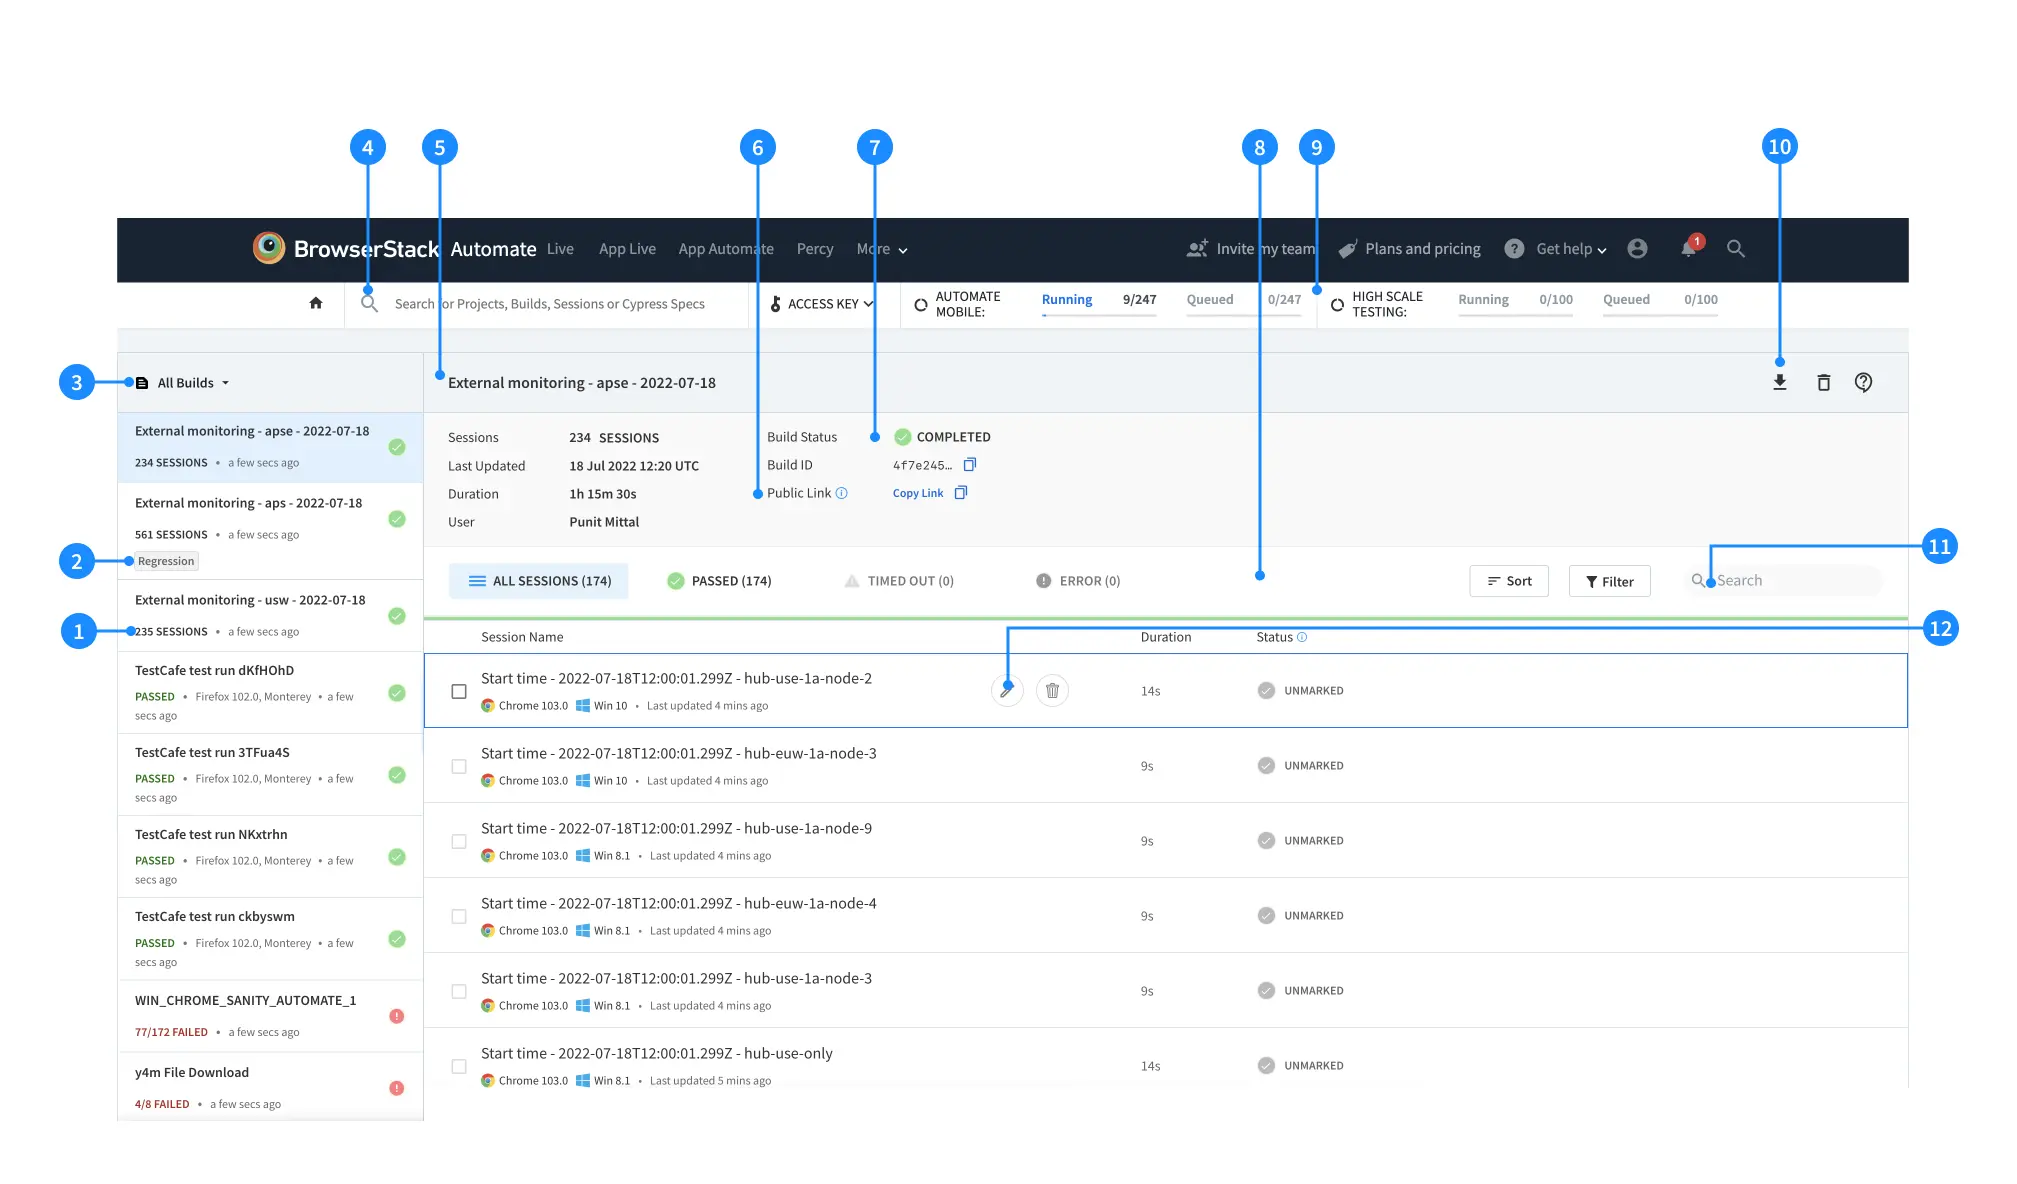
The following snapshot of the Automate Dashboard shows the list of builds on the left and the sessions pertaining to the selected build, on the right:
-
Sidebar: Enables quick access to all your builds. The sidebar also displays meta-information such as number of sessions, status of sessions, and project name.
-
Build tags: Add a custom build tag to your build using the
buildTagcapability or using REST API. -
Builds filter: Filters your builds by user, project, framework, status, or build tags. As you apply filters, the dashboard URL changes, enabling you to share filtered views with other team members.
-
Global search: Searches for projects, builds, and sessions by their name or IDs.
-
Build name: Shows the build name and project name.
-
Public Link: Allows you to copy the public URL of the current build. This public link enables unauthenticated sharing of the build. To disable from dashboard, build reports, and REST API, reach out to the Support team.
-
Build meta: Provides useful information about the build, such as, build status, build duration, number of parallels used, build ID, and the name of the user who executed the build. The build status can be any of the following:
-
COMPLETED: If the status of all test sessions in the build is completed. -
RUNNING: If status of one or more test session is running. -
FAILED: If one or more test session in the build had failed. -
Timed Out: If status of one or more test sessions is timed out.
-
-
Status: Shows different statuses of your test sessions. The REST API status (
PASSED,FAILED, orUNMARKED) denotes the session status that you mark using the REST API or JavascriptExecutor, or from the dashboard itself. The BrowserStack status represents a session state (RUNNING,ERROR, ORTIMED OUT) on the Automate infrastructure. The two different statuses help you quickly identify the reason for test failures.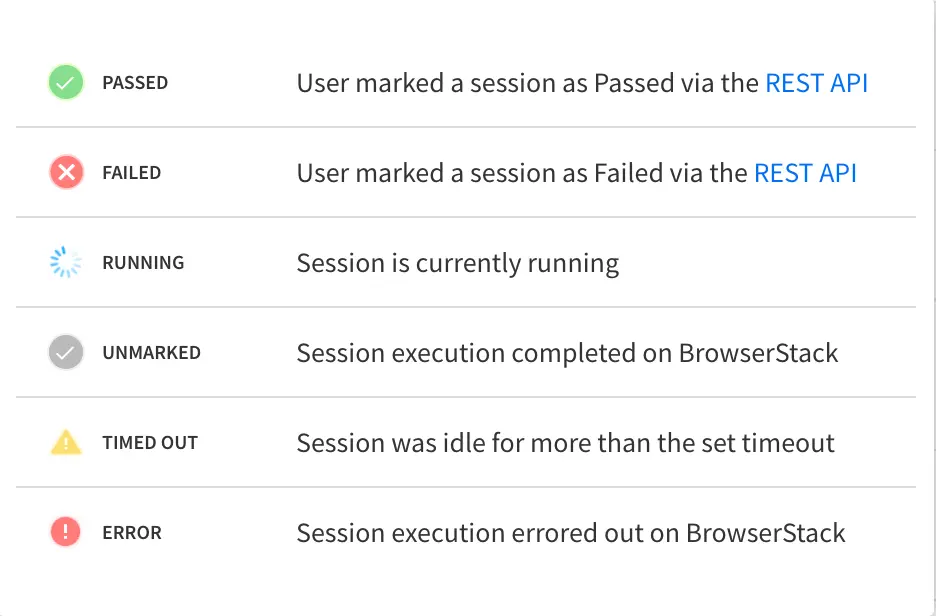
-
Parallels and queued sessions: Displays the total number of used parallels and queued sessions.
-
Download report: Allows you to download your build report of the latest 200 sessions in a
PDFfile format. -
Build level filters: Filter sessions in a build by user, spec status, device, or OS.
- Edit session details: Allows you to edit your test session details such as Session Name, Status, and Reason from the dashboard or using REST API.
Puppeteer session view on Automate Dashboard
The following snapshot of a session view shows a typical Puppeteer test session that has executed. You get the list of builds in the left-most side-nav, the list of sessions within the selected build in the 2nd sidebar and finally the details about the test session on the right side of the page.

-
Input Capabilities and Device Capabilities: Shows a well-formatted view of the input capabilities that you supplied. These are visible by default and are searchable using the browser’s default find feature.
-
Filters: Allows you to filter builds similar to the build view.
-
Sidebar: Select a build from the list of builds available in the left sidebar.
-
Session name: Displays the spec name. Click Build to return to the builds view.
-
Session meta: Provides helpful information about the session, such as Browser, OS, Duration, Local testing on/off, Session ID, timestamp, and the user’s name who executed the session.
-
Session Video: Captures the recording of the test as it happens in the session. Use this recording to go at a precise point in time when an error occurred and debug.
Some points in the progress bar of the recording might be marked in Red or Yellow color during your test run indicating certain issues. Each color represents the following issues:-
Red:
- BrowserStack-specific errors such as
SO_Timeout - Console annotator marked as
Error - Session marked as
failedusing JavaScript executor, API, or SDK
- BrowserStack-specific errors such as
-
Yellow:
- Any log that is tagged as a
Warning - Console annotator marked as
warn - Selenium exceptions
- Any log that is tagged as a
-
Red:
-
Logs tab: Select Text Logs, Console Logs, or Screenshots tab to view detailed logs. These logs show the steps executed in the test, the browser’s JavaScript console output, or the error message captured when the build failed.
-
Public Link: Allows you to copy the public URL of the current session. This public link enables unauthenticated sharing of the session. To disable from dashboard, build reports, and REST API, reach out to the Support team.
- Edit session details: Allows you to edit your test session details such as Session Name, Status, and Reason from the dashboard or using REST API.
We're sorry to hear that. Please share your feedback so we can do better
Contact our Support team for immediate help while we work on improving our docs.
We're continuously improving our docs. We'd love to know what you liked
We're sorry to hear that. Please share your feedback so we can do better
Contact our Support team for immediate help while we work on improving our docs.
We're continuously improving our docs. We'd love to know what you liked
Thank you for your valuable feedback!