Failure Categories
This widget visualizes the distribution of failure categories over time for the filtered tests. This helps you identify any patterns in the test failures and make informed decisions. For example, you can use this information to compare the failure categories of different projects, builds, users, etc. and prioritize the efforts of your engineering and QA teams.
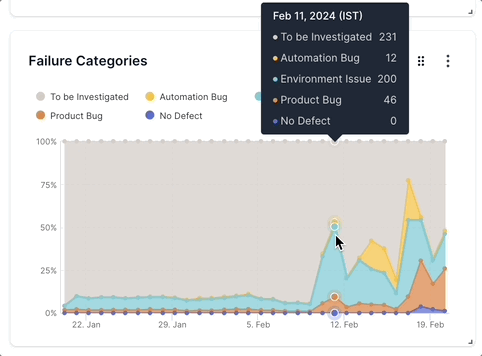
The Failure Categories widget uses the result of Automatic Failure Analysis. Automatic Failure Analysis learns from the testing activity over time and classifies test failures like Product Bug, Automation Bug, Environment Issue, No Defect, and To Be Investigated.
Drill down for more information
You can investigate more contextual information on all dashboard widgets using the drill-down feature.
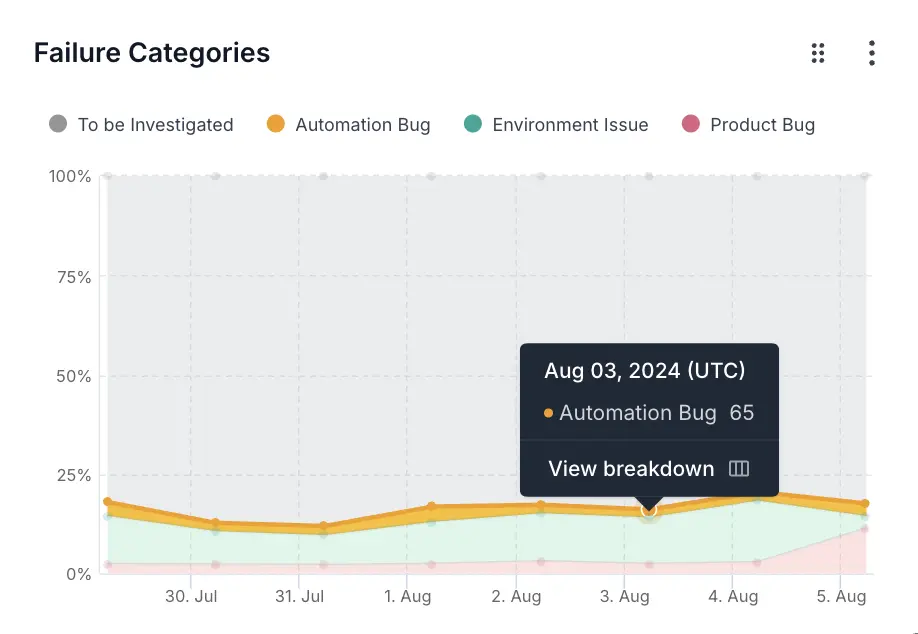
You can use the drill-down feature in the Failure Categories widget to analyze more details on the reasons for test failures. For example, if you see a spike in the number of tests that fail due to environment issues, you can investigate why the spike occured.
Follow these steps to use the drill-down feature:
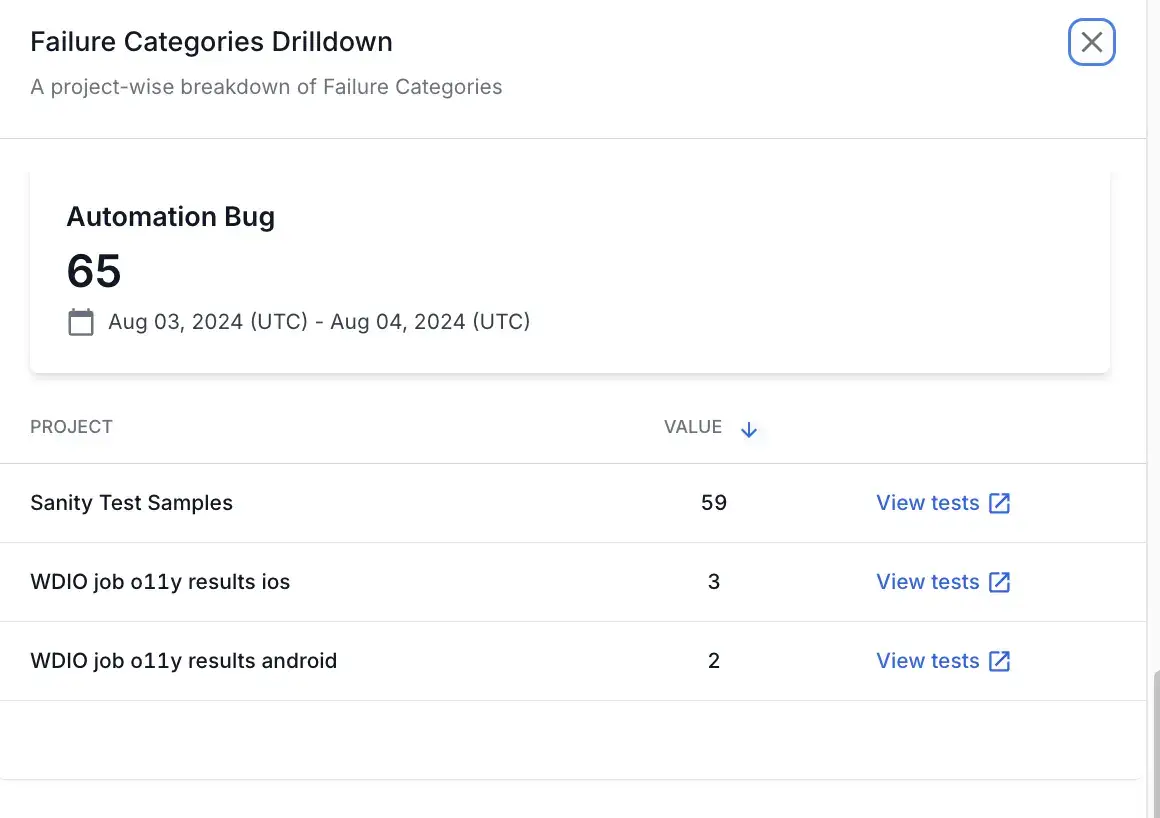
- Hover on any point in the Failure Categories widget and click View breakdown. A project-wise breakdown of the metrics for the selected date range opens up in a side pane.
- Click View tests to get to the tests that contribute to the test failures.
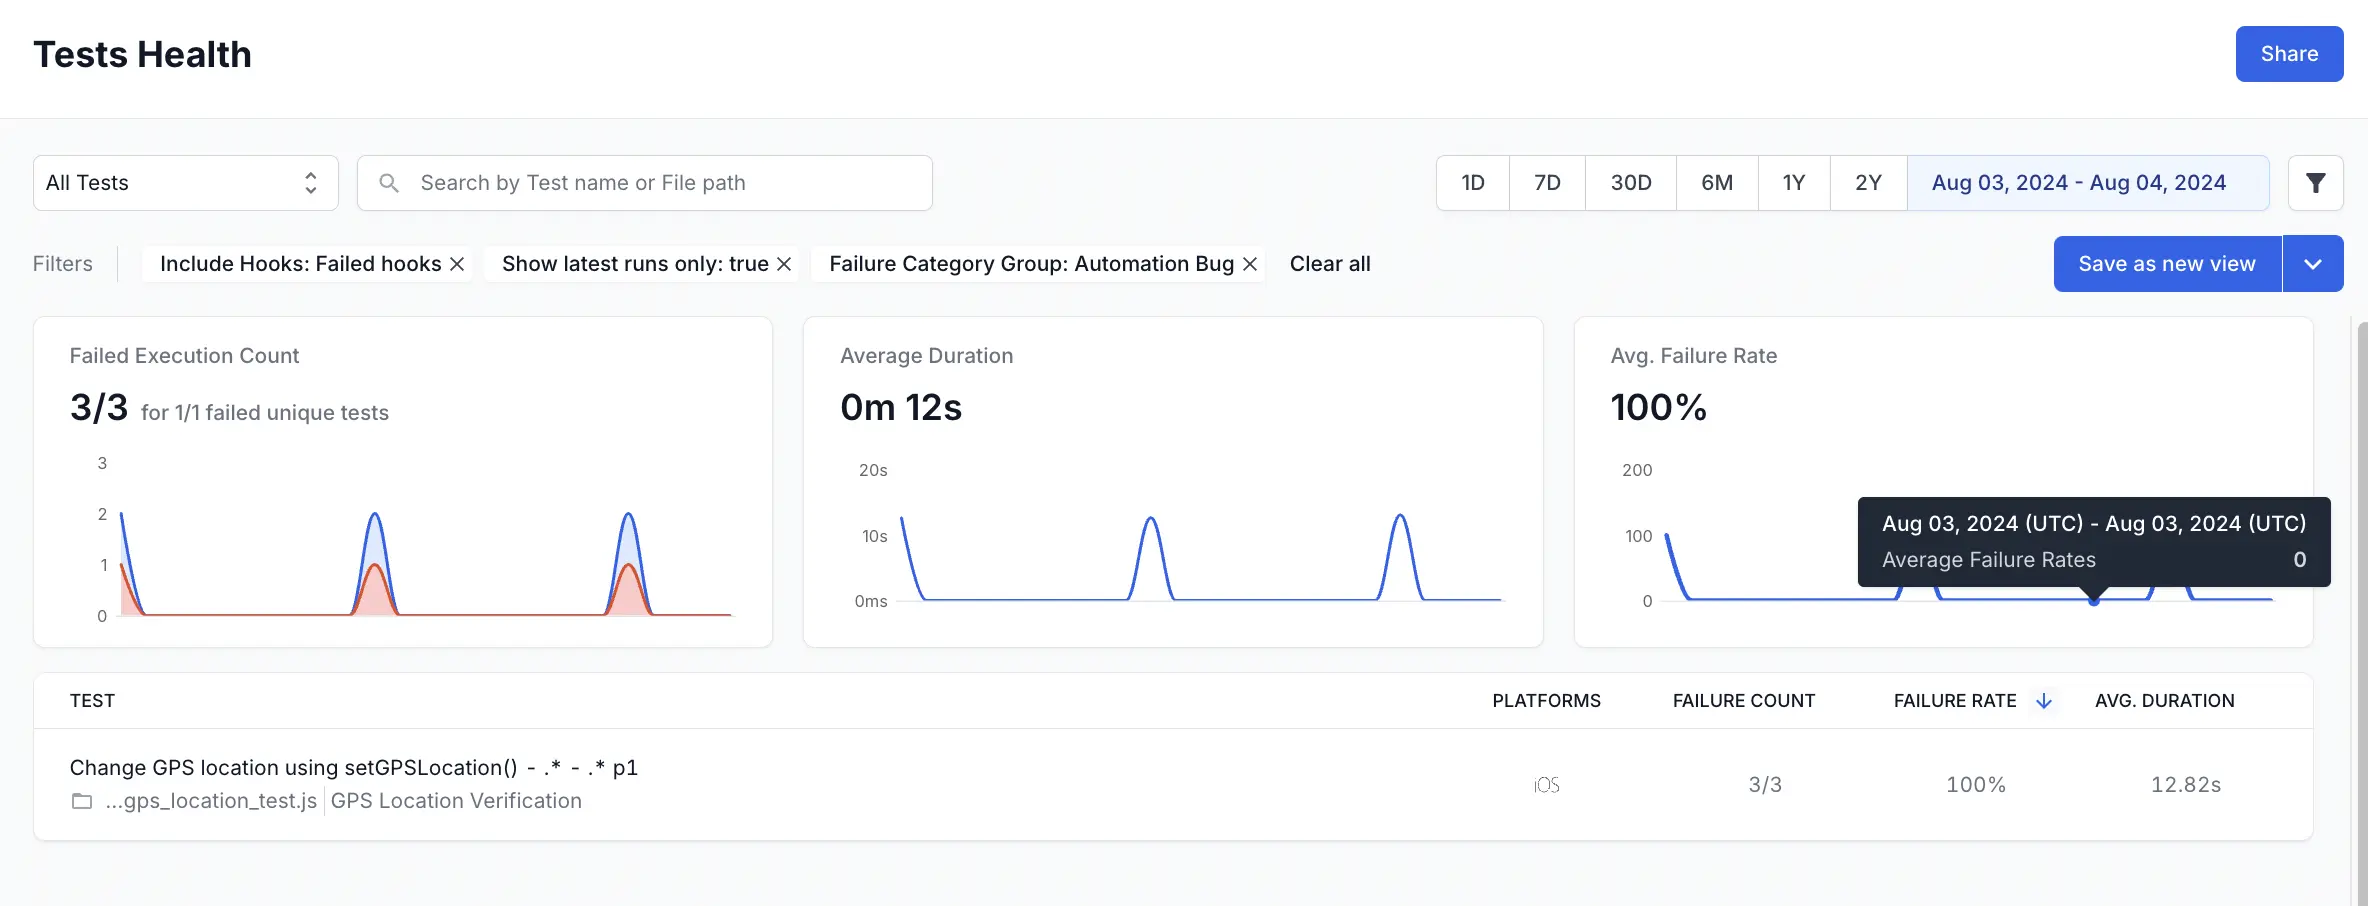
This opens Tests Health in a new tab with the applicable filters. On Tests Health, you can view the individual tests that contributed to the test failures.
Widget configuration - Failure Categories
You can configure the following options in the Failure Categories widget:
- Add a filter to include the data you want. You can filter data by several parameters like projects, unique build names, users, tags, etc.
- Choose between an area chart or a stacked column visualization.
We're sorry to hear that. Please share your feedback so we can do better
Contact our Support team for immediate help while we work on improving our docs.
We're continuously improving our docs. We'd love to know what you liked
We're sorry to hear that. Please share your feedback so we can do better
Contact our Support team for immediate help while we work on improving our docs.
We're continuously improving our docs. We'd love to know what you liked
Thank you for your valuable feedback!