Tests Health
Monitor the health of your test suite with comprehensive information about test runs across multiple builds.
Tests Health in Test Reporting & Analytics aggregates valuable information about your tests, including failure rate, failure count, and average duration.
This platform feature is available with Automate, App Automate, Test Management, Test Reporting & Analytics, and Automate TurboScale.
Many QA teams don’t have ready access to these metrics and are even unaware of which of their test cases are the most problematic. The ones that do traditionally track these metrics manually using spreadsheets. However, maintaining a comprehensive spreadsheet for all the tests in your test suite can be a time-consuming, inefficient, and unsustainable process.
Tests Health addresses this issue by consolidating key insights about your test executions into a single interactive dashboard. You can quickly identify which tests require attention and prioritize efforts to improve the overall health of your test suite.
How to use Tests Health?
Accessing Tests Health
To navigate to the Tests Health view, click Tests Health in the menu bar.
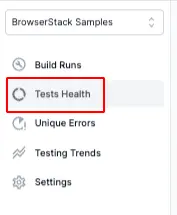
This opens up Tests Health.
Explore the features in Tests Health
Let’s explore the capabilities and features of the Tests Health view.
View tests within a specific time window
You can use the date range selector located in the top-right corner to view the tests executed within the last seven days, thirty days, or two months. Alternatively, you can specify a custom start and end date to focus on tests within a specific time frame.

Apply filters to tests based on specific criteria
Tests Health provides a range of filters for refining your tests. To access these filters, click the Filters button in the top-right corner. A sidebar appears where you can select the desired filters. After you’ve made your selections, click the Apply button to filter the tests based on your chosen criteria.
Search for a test
The search bar allows you to find the health status of a specific test or filter tests based on common keywords.
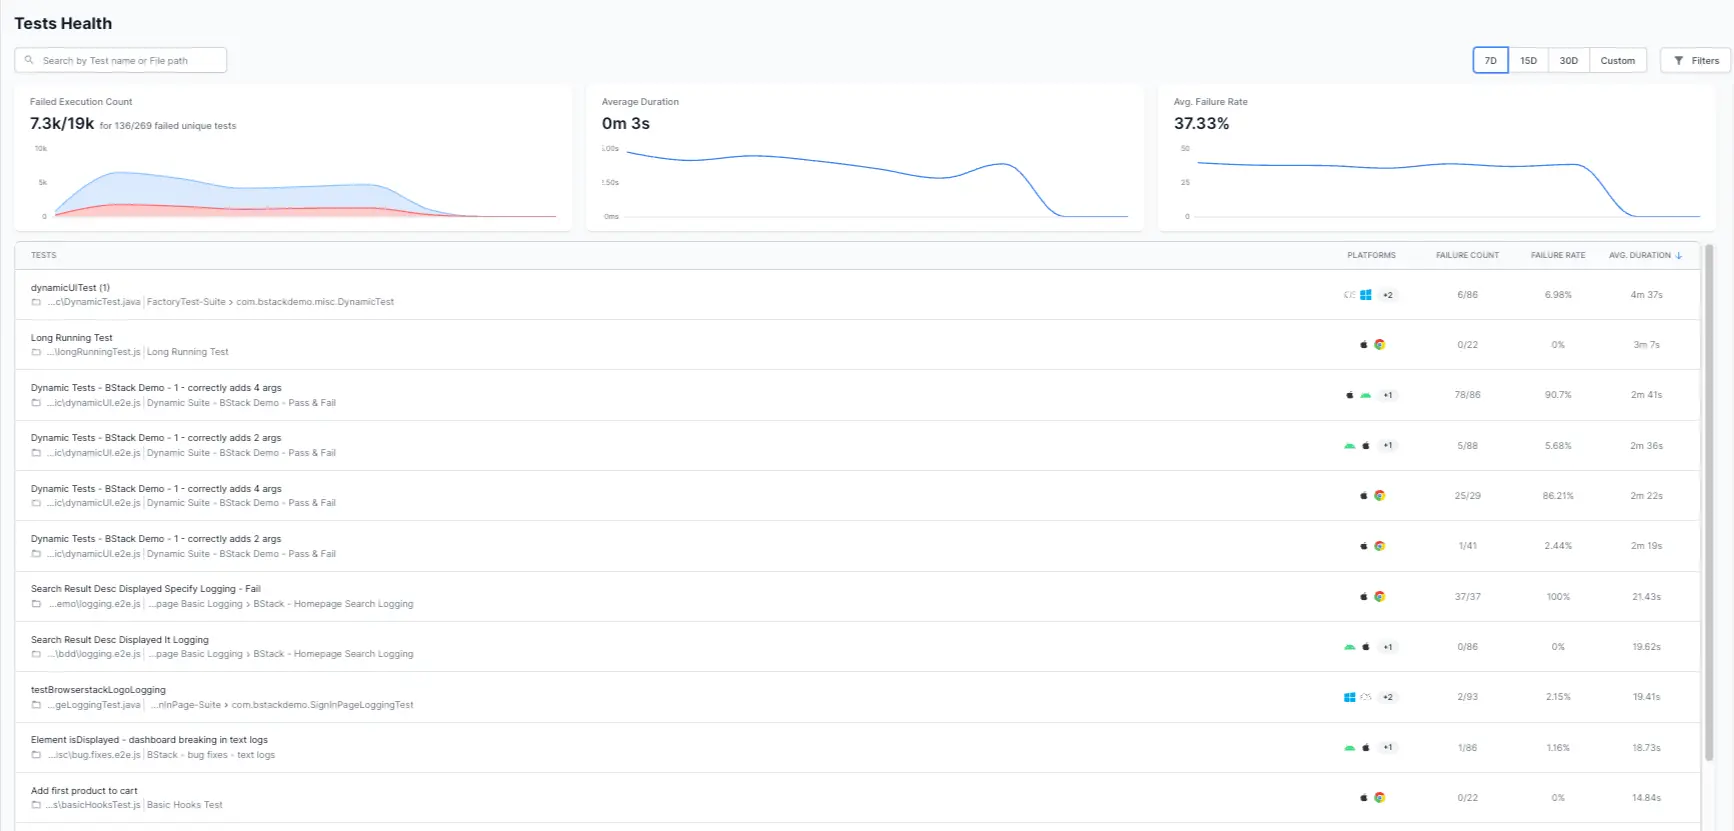
View charts on test statistics
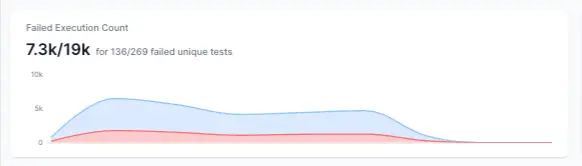
Tests Health offers the following charts representing the key health metrics of your test suite based on your chosen filters and date range.
-
Failed Execution Count: This chart illustrates the number of unique failed tests and the total number of unique tests over time.
-
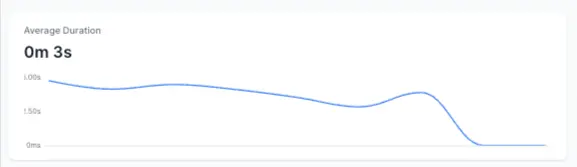
Average Duration: This chart illustrates the change in the average duration of each test execution over time.
-
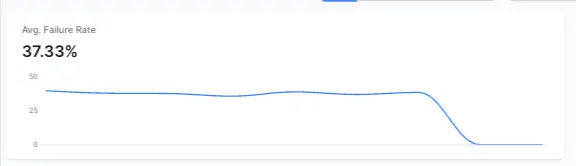
Avg. Failure Rate: This chart illustrates the change in the percentage of failing tests over time.
Categorize tests and identify outliers
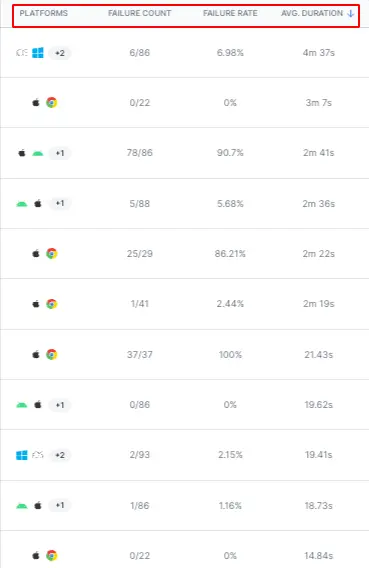
Tests Health lists all the tests according to the filters that you choose. This list of tests includes the following additional information:
- Platform (browser or device combination)
- Failure count
- Failure rate
- Average duration
You can sort the tests by failure count, failure rate, or average duration to quickly identify tests that require the most attention.
View detailed information on test runs across multiple builds
You can select a test from the list of tests in Tests Health to open a detailed view of that test. The Runs tab of the detailed view opens up by default. In the Runs tab, you can view a chart and metrics that represent the health of the test. You can interact with the chart by dragging to zoom in or clicking on a particular execution.
You can also view how the test ran across multiple builds. You can use this view to gain insights about your test, such as when it started failing and what caused the failure.
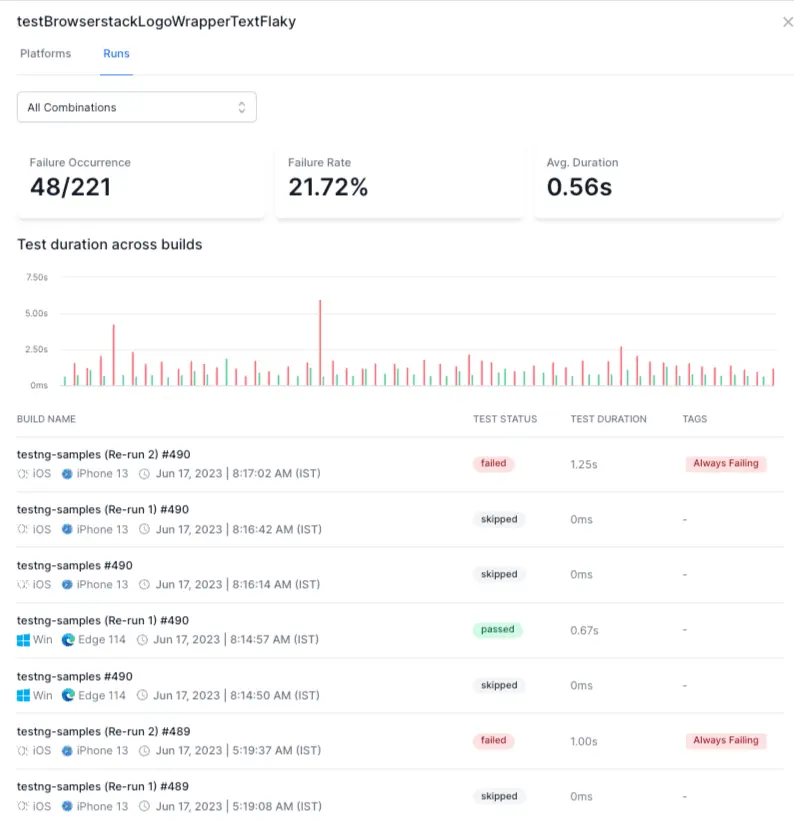
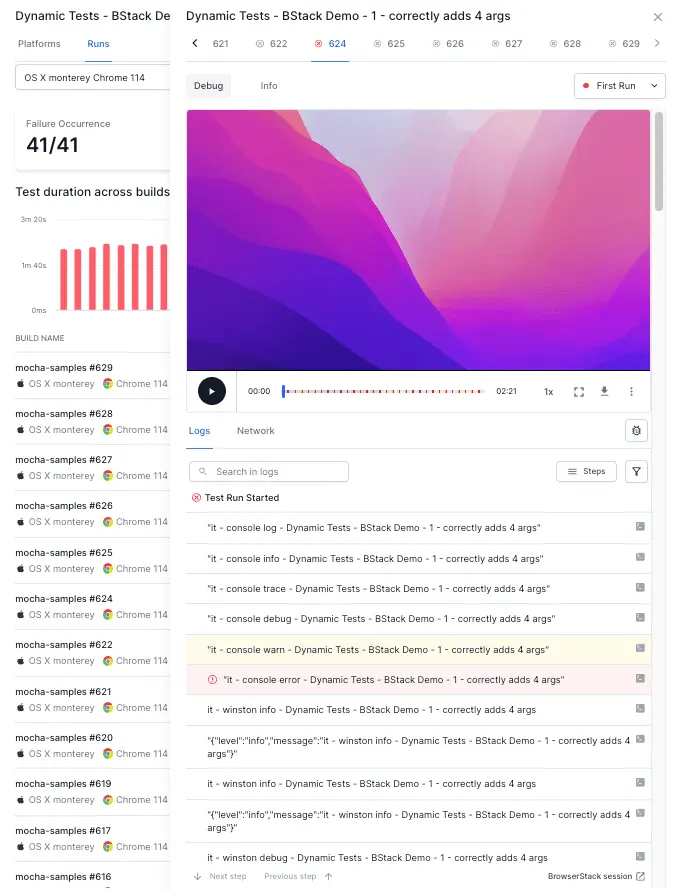
You can click a build to open the Timeline Debugging view and investigate more details.
In the detailed view, you can use the Platforms tab to understand how the test fared on multiple browsers, devices, and operating systems. If the test fails only in some platforms, you can quickly identify it and work towards a solution.
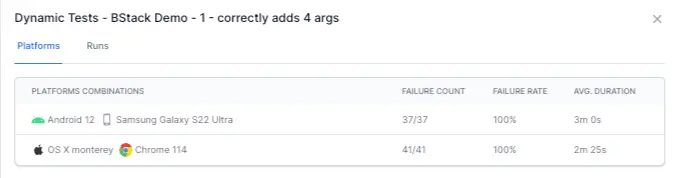
You can click on a platform to view filtered run data for that particular platform.
Explore Tests Health in the demo sandbox
You can explore Tests Health in the Test Reporting & Analytics demo sandbox.
We're sorry to hear that. Please share your feedback so we can do better
Contact our Support team for immediate help while we work on improving our docs.
We're continuously improving our docs. We'd love to know what you liked
We're sorry to hear that. Please share your feedback so we can do better
Contact our Support team for immediate help while we work on improving our docs.
We're continuously improving our docs. We'd love to know what you liked
Thank you for your valuable feedback!