Unique Errors Timeline
This widget visualizes the frequency of specific unique errors over time. It helps you monitor common errors impacting multiple projects, teams or modules like infra failures , framework related errors, or third-party integration failures. The widget defaults to displaying the top five unique errors and can be customized to track specific errors as well.
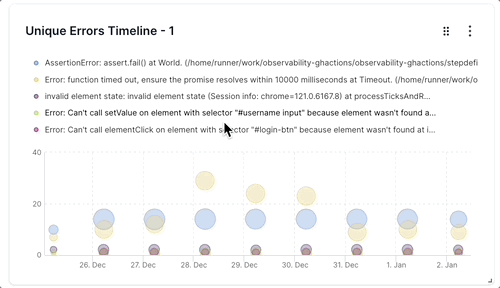
The horizontal axis indicates the timeline, and the vertical axis shows the number of tests impacted by the error. Each error is depicted with a unique color, and the bubble’s size indicates the frequency of test failures on a specific day/week attributed to that particular error.
Drill down for more information
You can investigate more contextual information on all dashboard widgets using the drill-down feature.
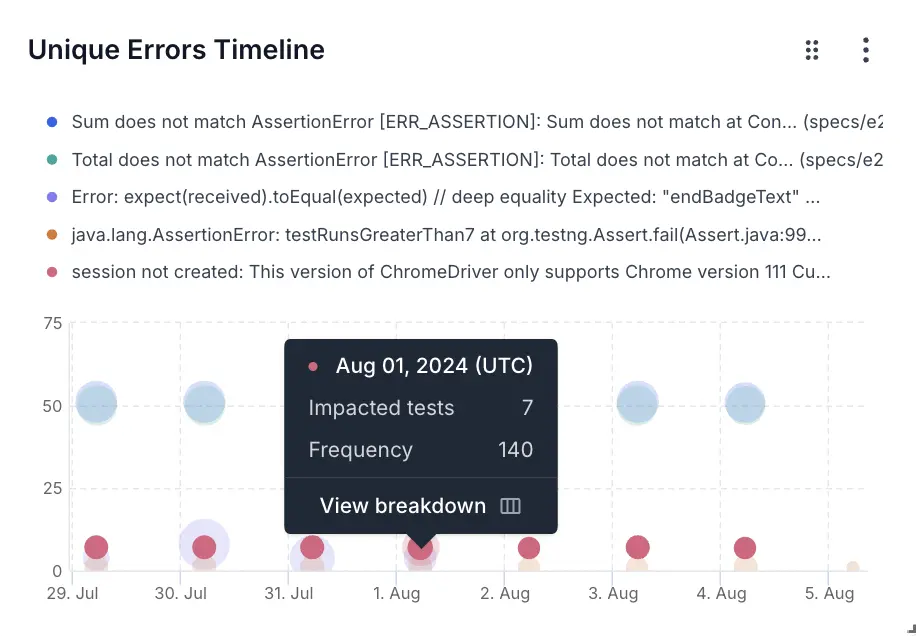
You can use the drill-down feature in the Unique Errors Timeline widget to analyze more details on the errors. For example, if you want to investigate the unique error causing the most test fest failures, you can investigate that particular error.
Follow these steps to use the drill-down feature:
- Click any unique error in the Unique Errors Timeline widget. A project-wise breakdown of the metrics for the selected date range opens up in a side pane.
- Click View error to get to the error.
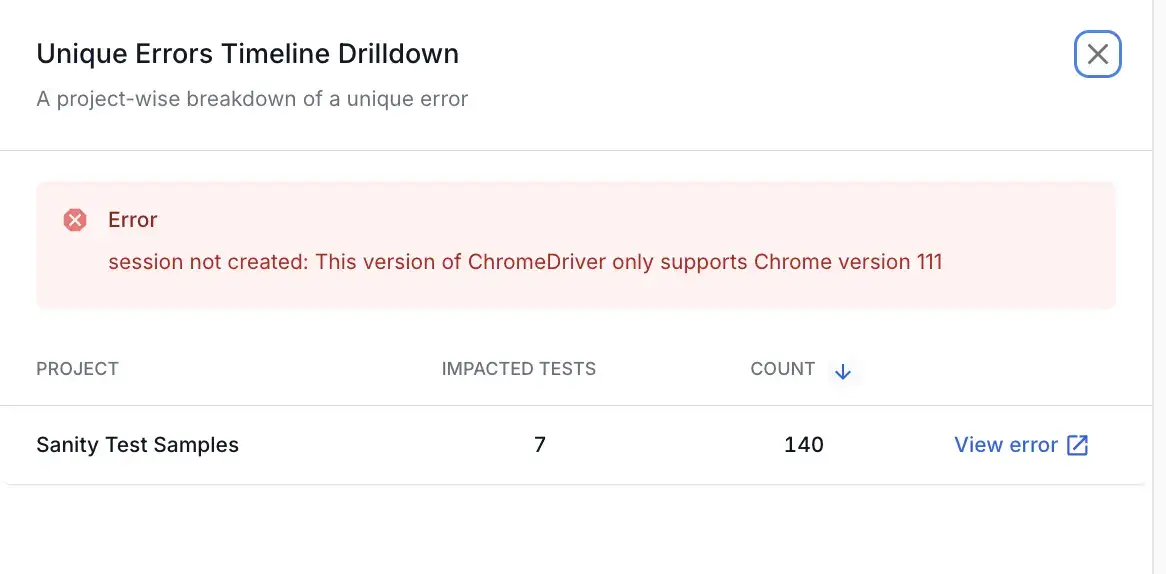
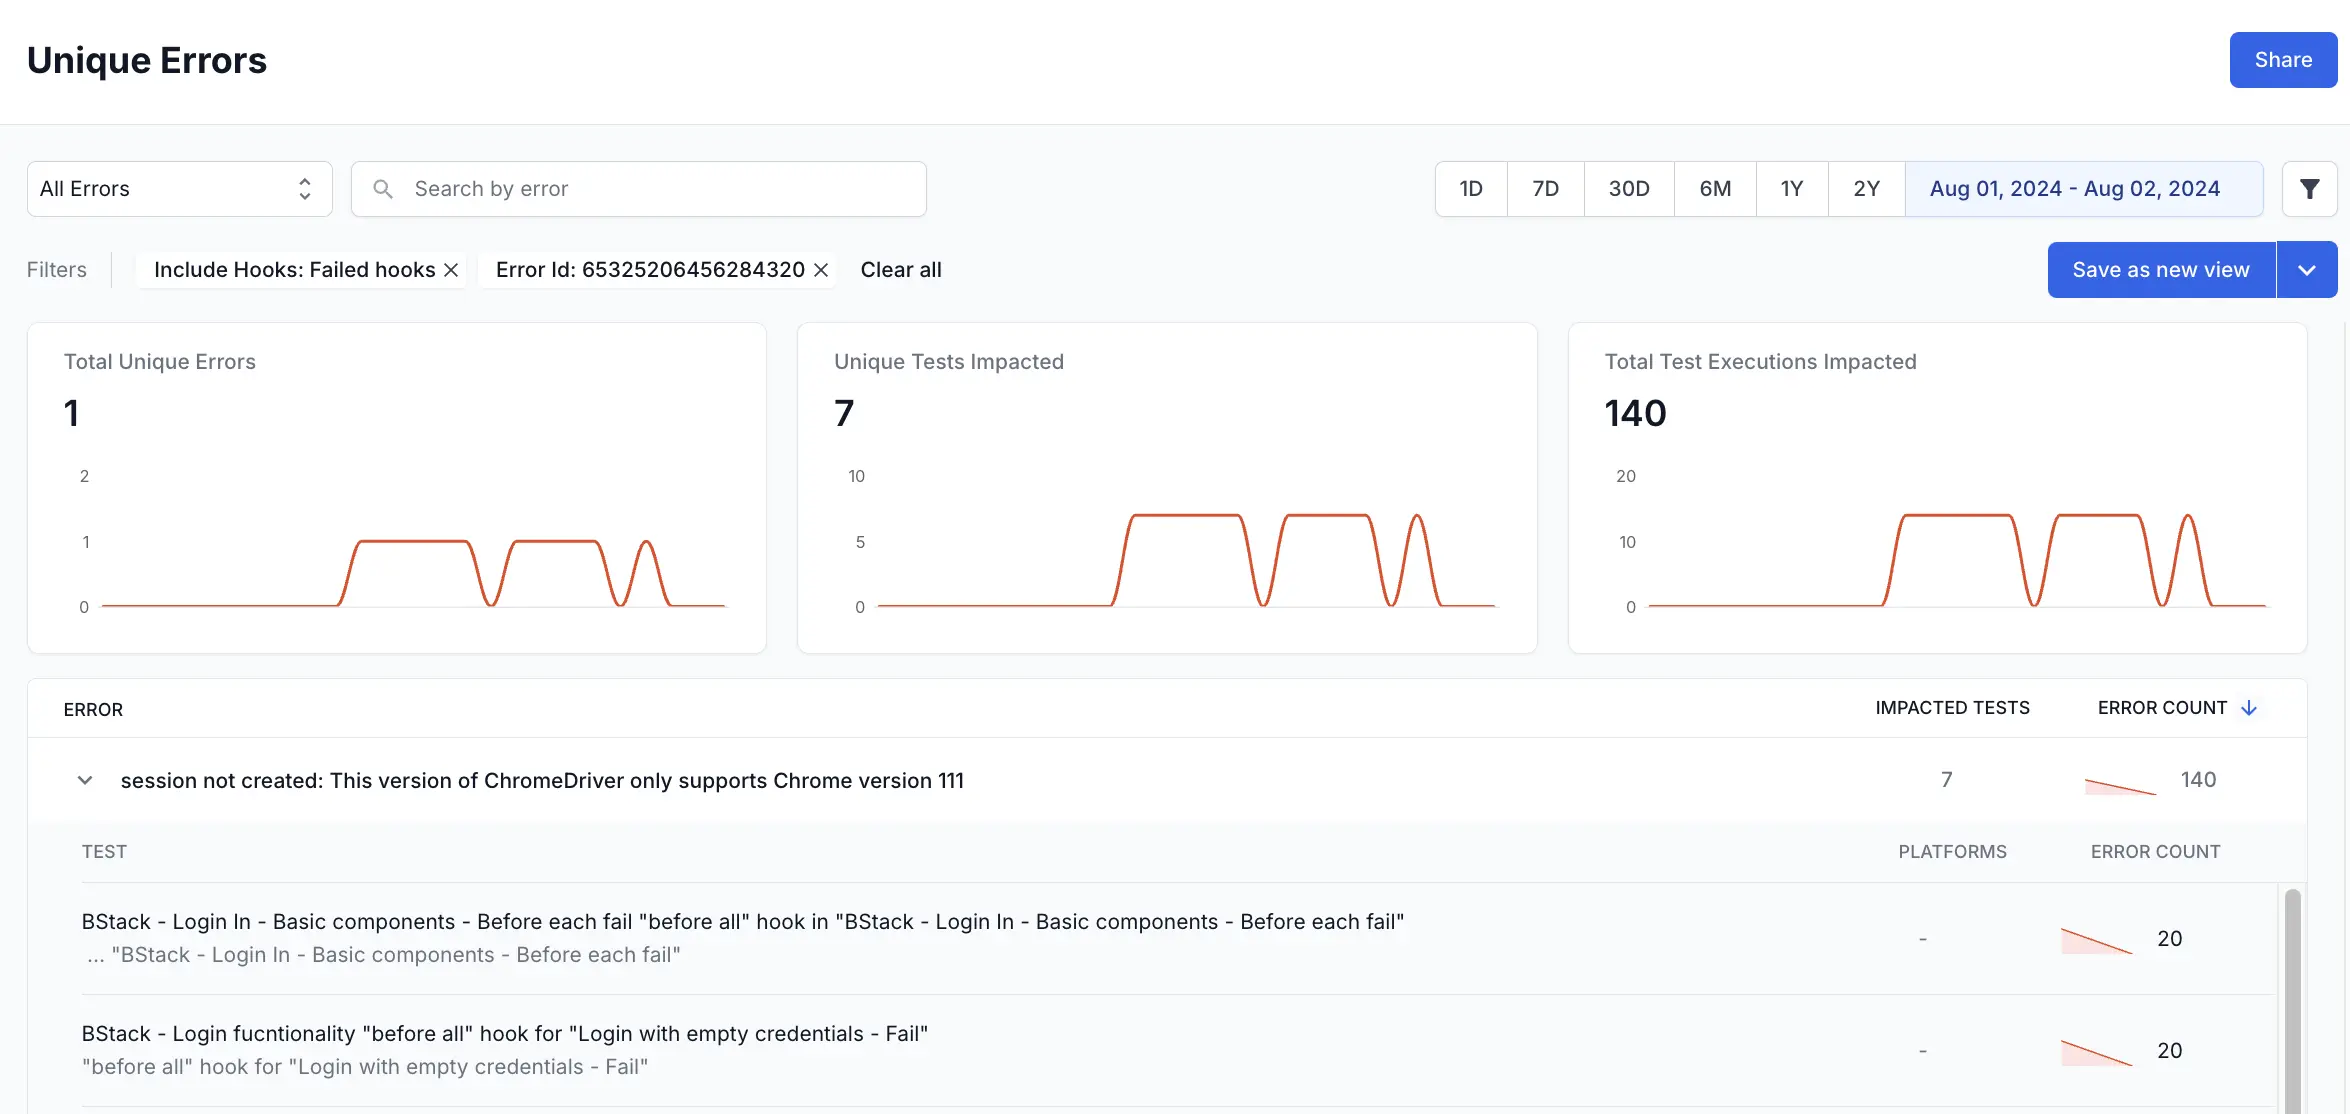
This opens Unique Errors in a new tab with the applicable filters. On Unique Errors, you can further investigate the error and take corrective actions.
Widget configuration - Unique Errors Timeline
You can configure the following options in the Unique Errors Timeline widget:
- Choose the top five errors (default) or select any five errors that you want to monitor.
- Filter data by several parameters like projects, unique build names, build tags, test tags, users, etc.
We're sorry to hear that. Please share your feedback so we can do better
Contact our Support team for immediate help while we work on improving our docs.
We're continuously improving our docs. We'd love to know what you liked
We're sorry to hear that. Please share your feedback so we can do better
Contact our Support team for immediate help while we work on improving our docs.
We're continuously improving our docs. We'd love to know what you liked
Thank you for your valuable feedback!