
 Join our Discord
Run summary
Get a high-level summary of unique runs with their frequency and status distribution.
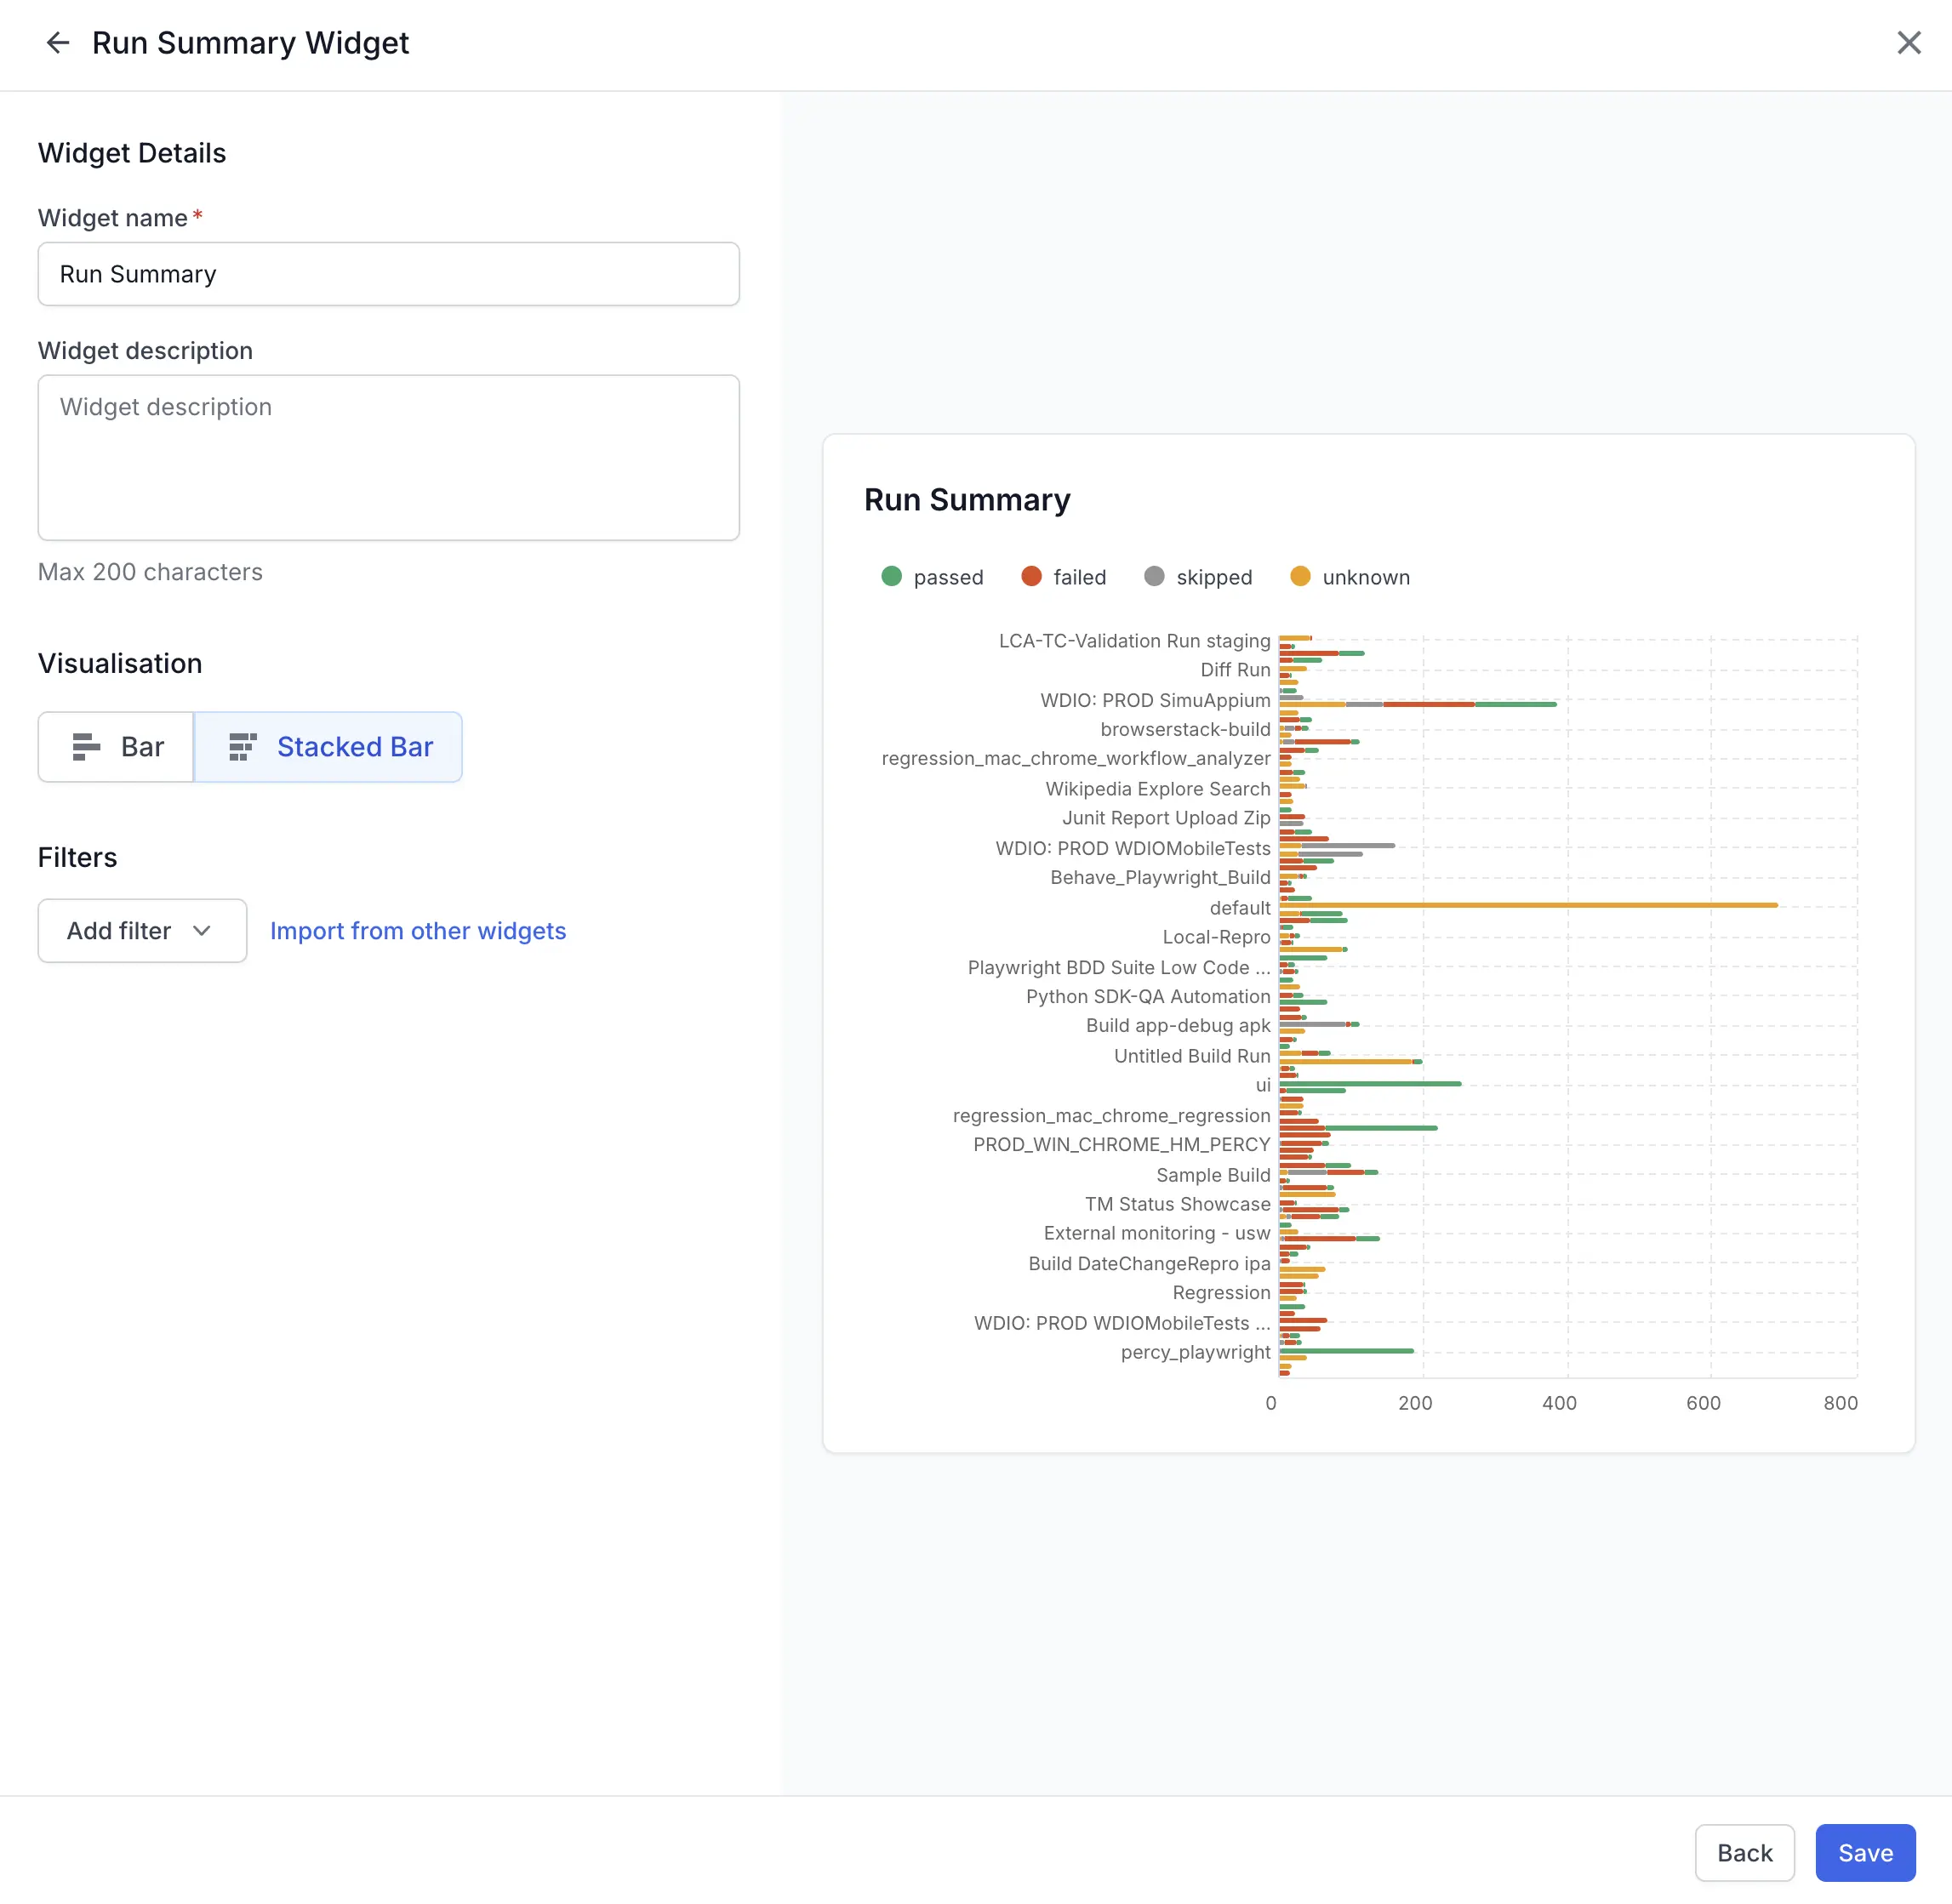
The run summary widget shows how many tests in each unique run are passed, failed, skipped, or unknown. Use the widget to spot runs with high failure counts and prioritize the work to improve them.
This widget shows automation run results only. It doesn’t include results that were manually overridden.
Drill down for more information
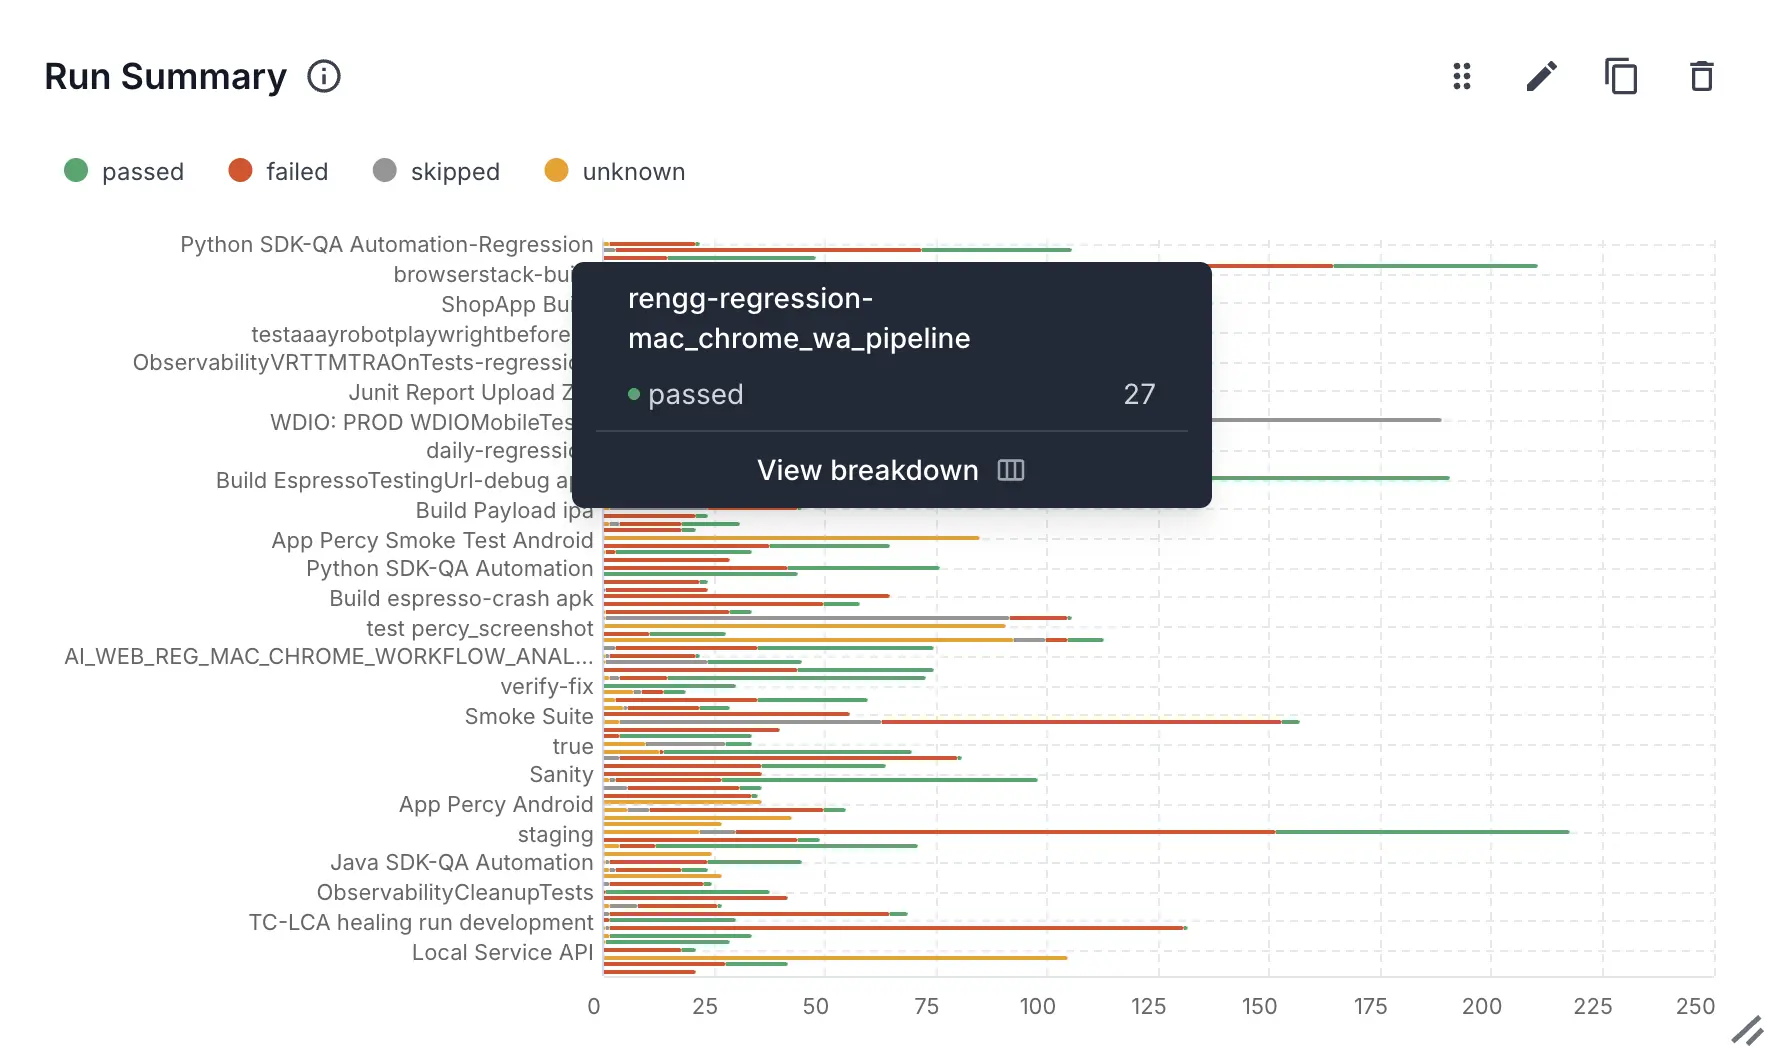
Drill down into the run summary widget to see a project-wise breakdown of any run. Each row in the widget is one unique run, color-coded by test status.
Follow these steps to drill down:
- Hover over any segment of a run’s bar to see a tooltip with the run name, status, and count. Click View breakdown in the tooltip.
- In the Run Summary Drilldown panel, review the project-wise breakdown for the run and status you selected. Each row lists a project and its count.
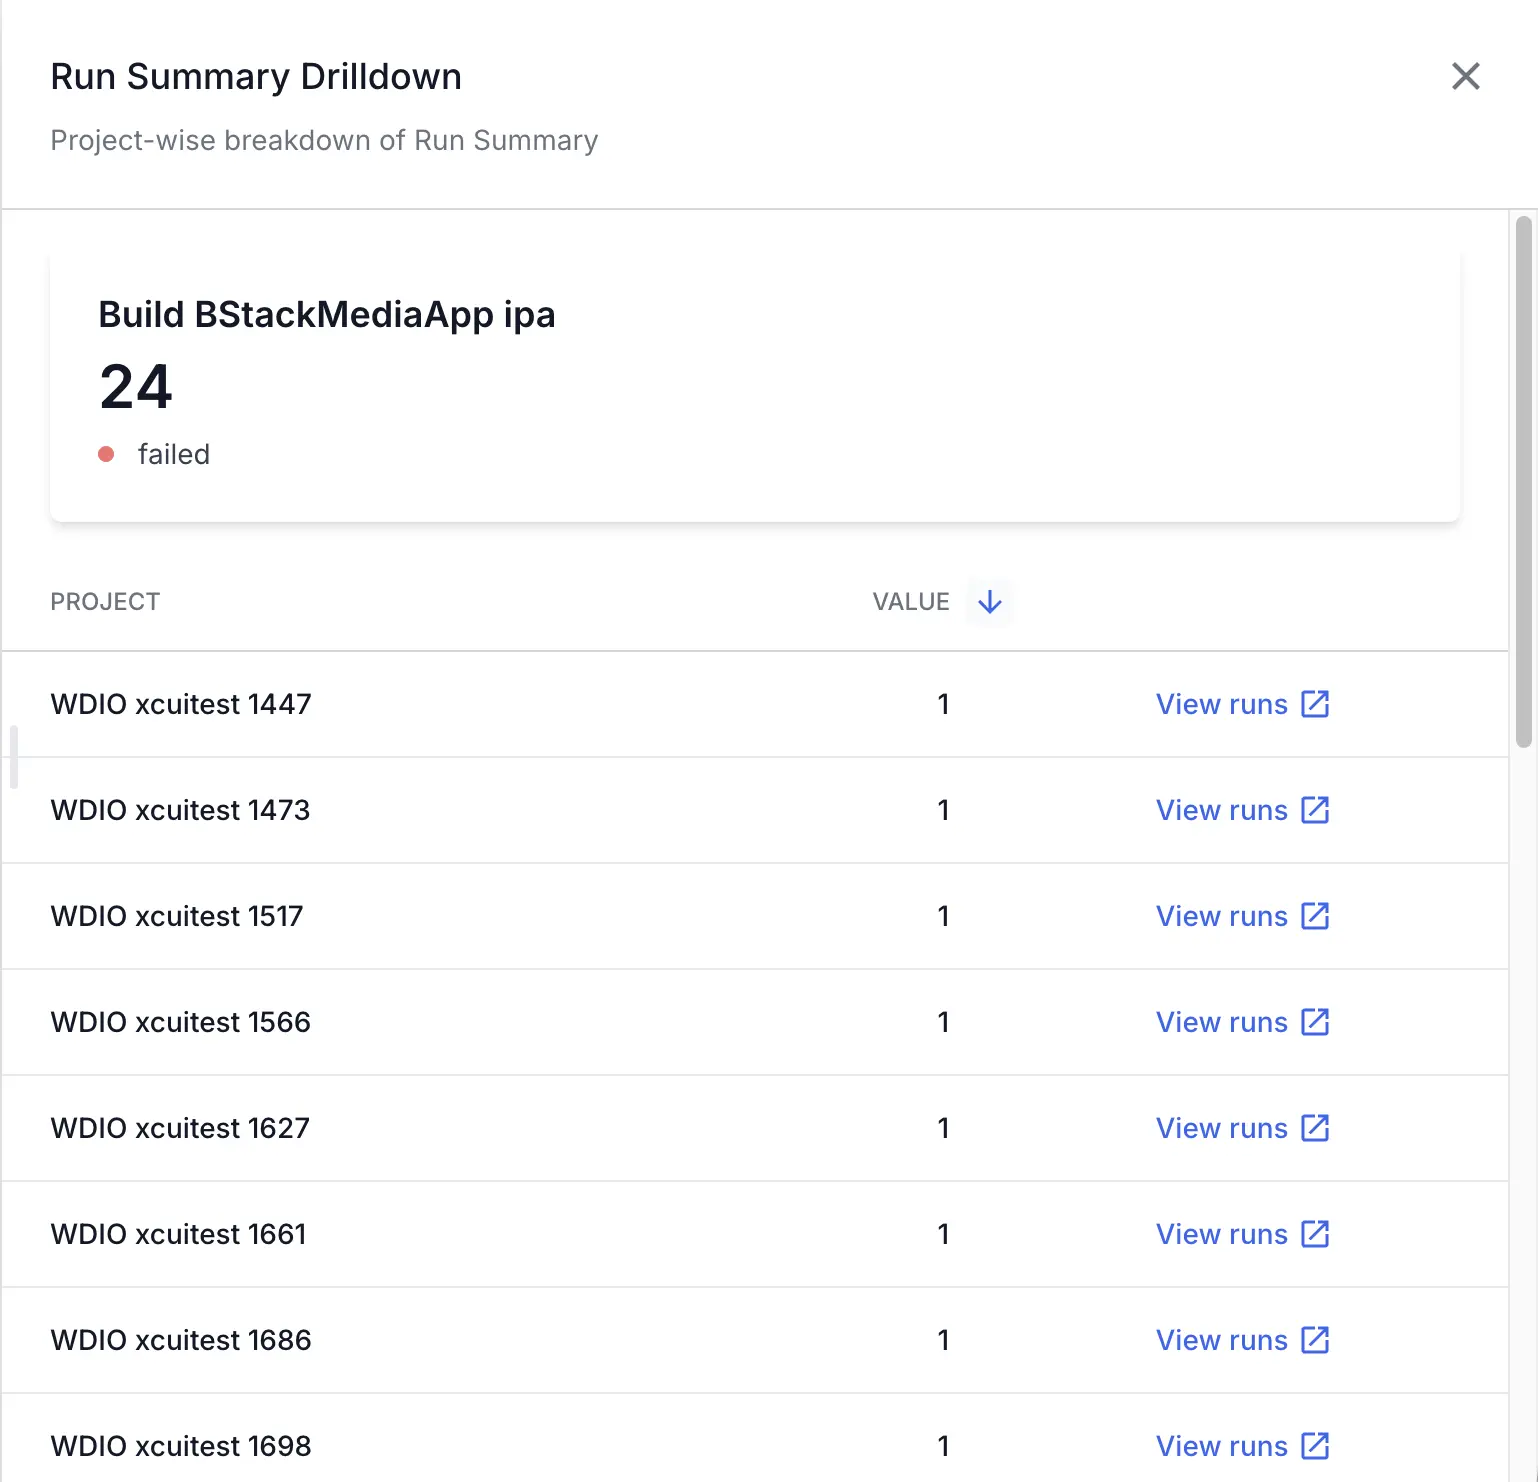
- Click View runs for a project to open its runs in a new tab.
Widget configuration
You can configure the following options in the run summary widget:
- Add a filter to include the data you want. You can filter by several parameters, including projects, unique run names, users, and tags.
- Choose between a bar chart or a stacked bar visualization.
We're sorry to hear that. Please share your feedback so we can do better
Contact our Support team for immediate help while we work on improving our docs.
We're continuously improving our docs. We'd love to know what you liked
We're sorry to hear that. Please share your feedback so we can do better
Contact our Support team for immediate help while we work on improving our docs.
We're continuously improving our docs. We'd love to know what you liked
Thank you for your valuable feedback!