Test Reporting Dashboard
Learn how to use the Test Reporting Dashboard to measure review efficiency and time savings.
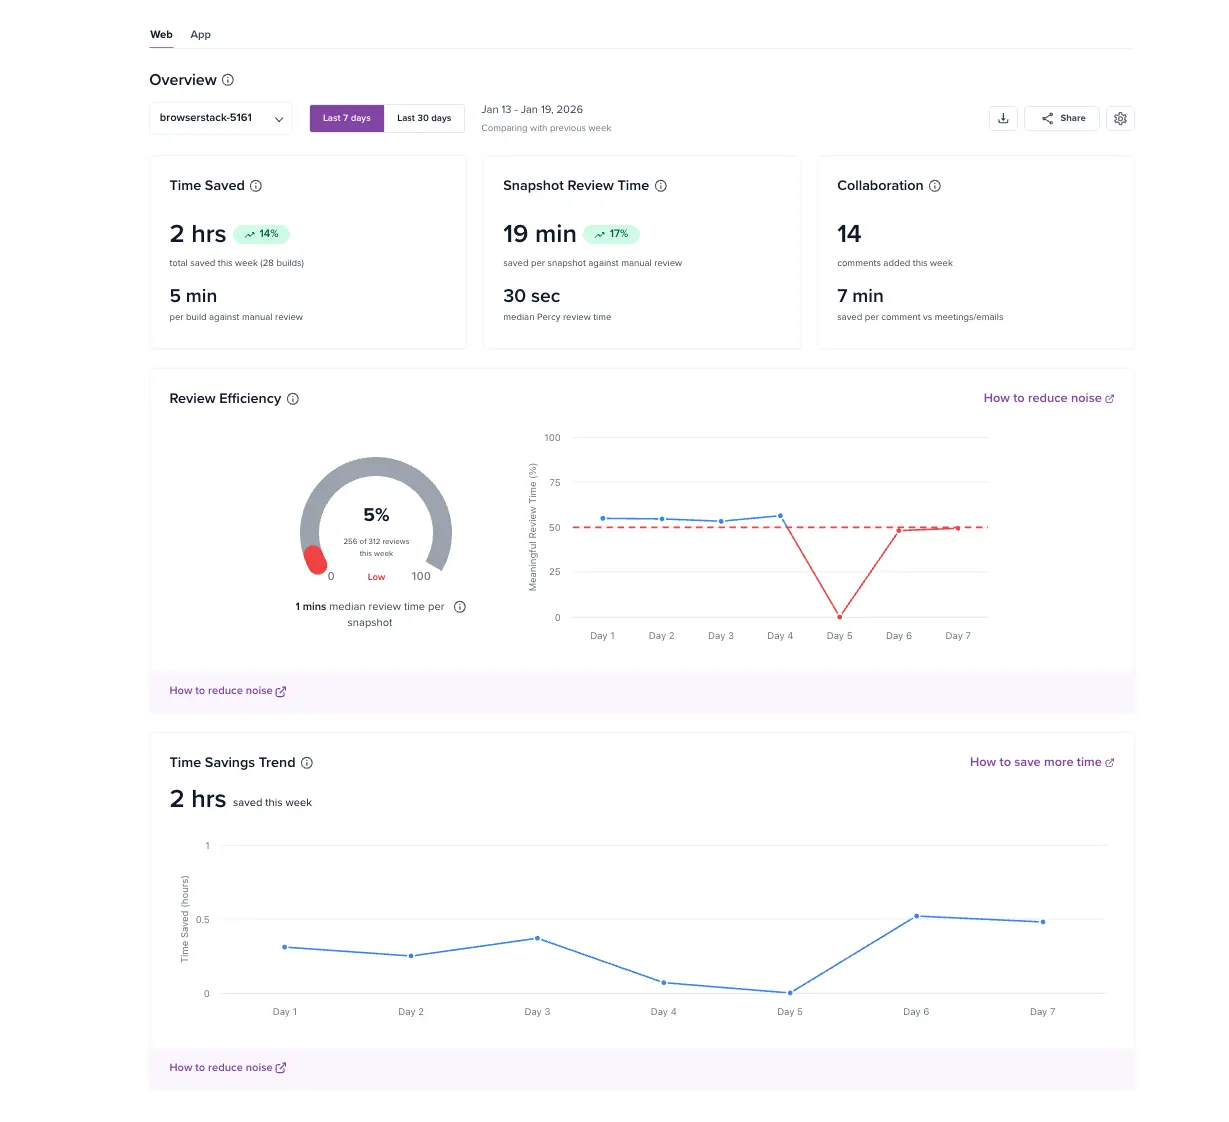
The Percy Test Reporting Dashboard gives you clear visibility into how effective your visual testing workflow is. It helps you measure review efficiency, understand time savings from automation, and track the ROI of Percy across your organization or teams.
This page explains what insights are available and how to interpret them.
Overview
The Percy Test Reporting Dashboard focuses on outcome-driven insights rather than raw build data.
- Review Efficiency Score: Measures how much review time focuses on meaningful visual changes
- Time Saving Trend: Tracks how much manual review time Percy saves
- Automated summaries: Delivers weekly or monthly reports by email
All insights are available at both organization and team levels.
Access the dashboard
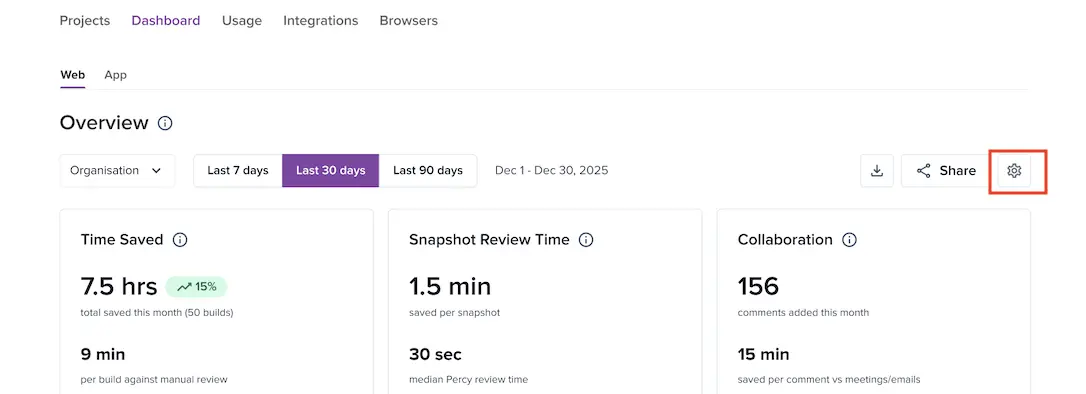
To view your insights, navigate to the Visual testing dashboard and click Dashboard. You can view the dashboard for Web & App. You can filter data at the Organization or Project level and select custom date ranges (Last 7 days, 30 days, or 90 days).
How insights are delivered
Percy delivers ROI insights in two ways:
- Percy Dashboard (UI): This provides interactive charts and trends
- Automated Email Reports: It sends concise summaries to your inbox
The dashboard combines high‑level metrics with supporting trends in a single view.
Review Efficiency
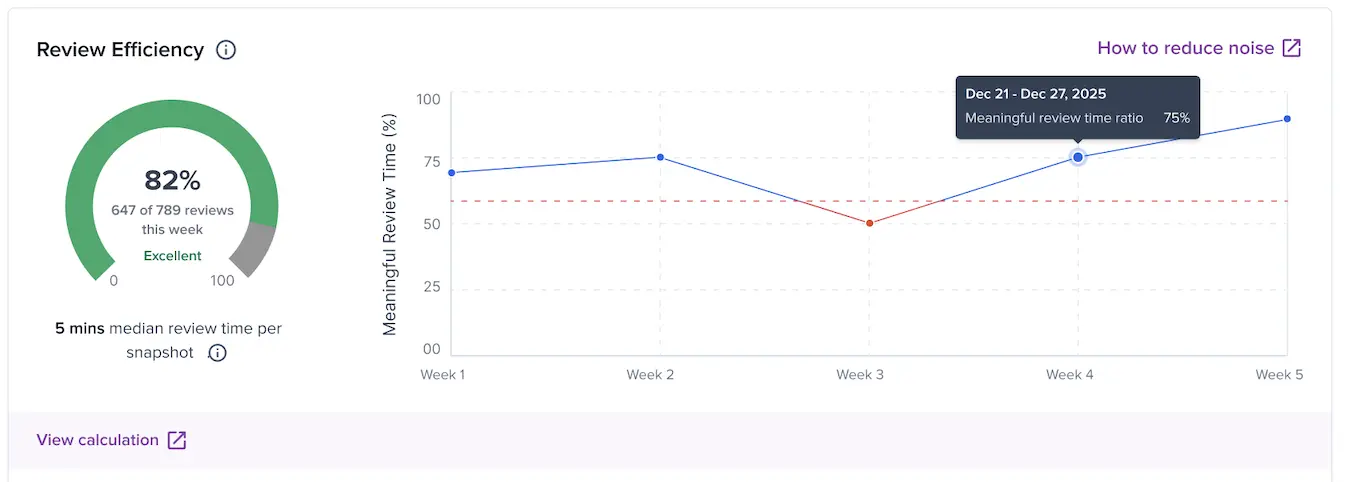
The Review Efficiency Score measures how much of your total review time is spent on meaningful visual changes, instead of trivial or noisy diffs.
This is a paid feature and requires AI to be enabled for your builds. For more information, check how to Enable Visual Review Agent.
How to interpret the score
-
80–100% – Healthy: Your team focuses most review time on meaningful diffs.
-
60–80% – Needs attention: Some noise exists. Threshold tuning or stabilization may help.
-
Below 60% – Noisy: Your team spends a large portion of review time on trivial changes.
Trend guidance
Monitor score trends over time to identify patterns and take action when needed.
- Increasing score: Review noise reduces
- Decreasing score: More instability or over‑sensitive settings occur
If your score is low, adjust Diff Sensitivity or apply Ignore Regions to components to streamline your workflow.
How Review Efficiency is calculated
Percy calculates the Review Efficiency Score by analyzing review sessions and classifying snapshot reviews.
- Percy groups review actions into review sessions
- Percy classifies each snapshot review as meaningful or noisy
- The score represents the proportion of time your team spends on meaningful reviews
The dashboard displays this metric as:
- A percentage value
- A time‑series trend
Time Savings Trend
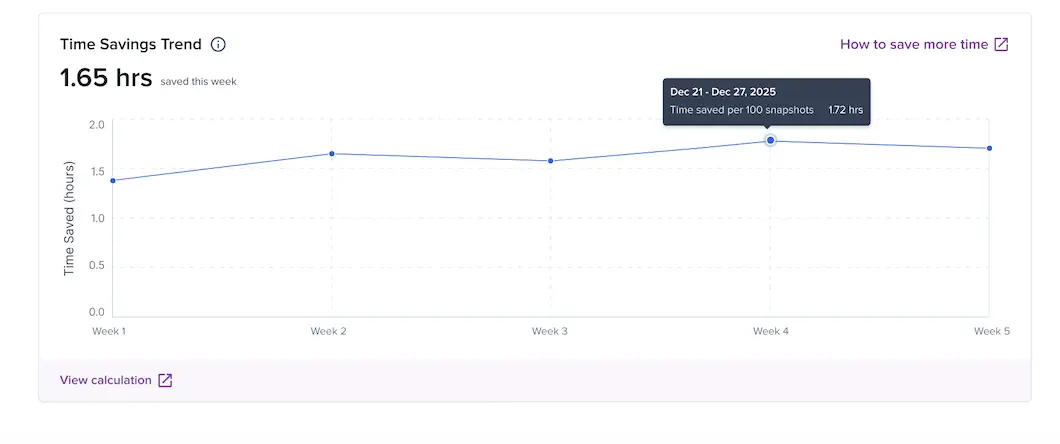
The Time Savings Trend estimates how much manual review time Percy saves by automatically skipping snapshots with no visual differences. This helps you understand the automation value Percy delivers as visual coverage grows.
How Time Savings Trend is calculated
Percy calculates time savings by comparing actual review time against snapshots that pass automatically.
- Percy identifies snapshots with zero visual diffs
- Percy calculates the median review time spent on snapshots with real changes
- Percy applies this effort to snapshots that pass automatically without a diff
The dashboard displays:
- Time Savings Score: Minutes saved per 100 unchanged snapshots
- Total Time Saved: Total hours reclaimed through automation
Collaboration
This metric quantifies the time saved by your team using Percy’s native commenting and collaboration tools instead of relying on external meetings, screenshots in emails, or Slack threads.
How it’s calculated
Percy tracks the volume of comments made within the platform and applies a conservative estimate of the time saved by avoiding external communication loops:
Collaboration Time Saved = Number of comments * 30 seconds per comment
Example Insight
If your team adds 156 comments in a month, this translates to approximately 15 minutes of overall time savings.
Automated email reports
Percy sends weekly or monthly summary emails so you can track efficiency and time saved without logging in. Subscribe to weekly digests delivered to your inbox by configuring the settings.
When you subscribe to email notifications, you receive one combined email report for Percy Web and App builds.
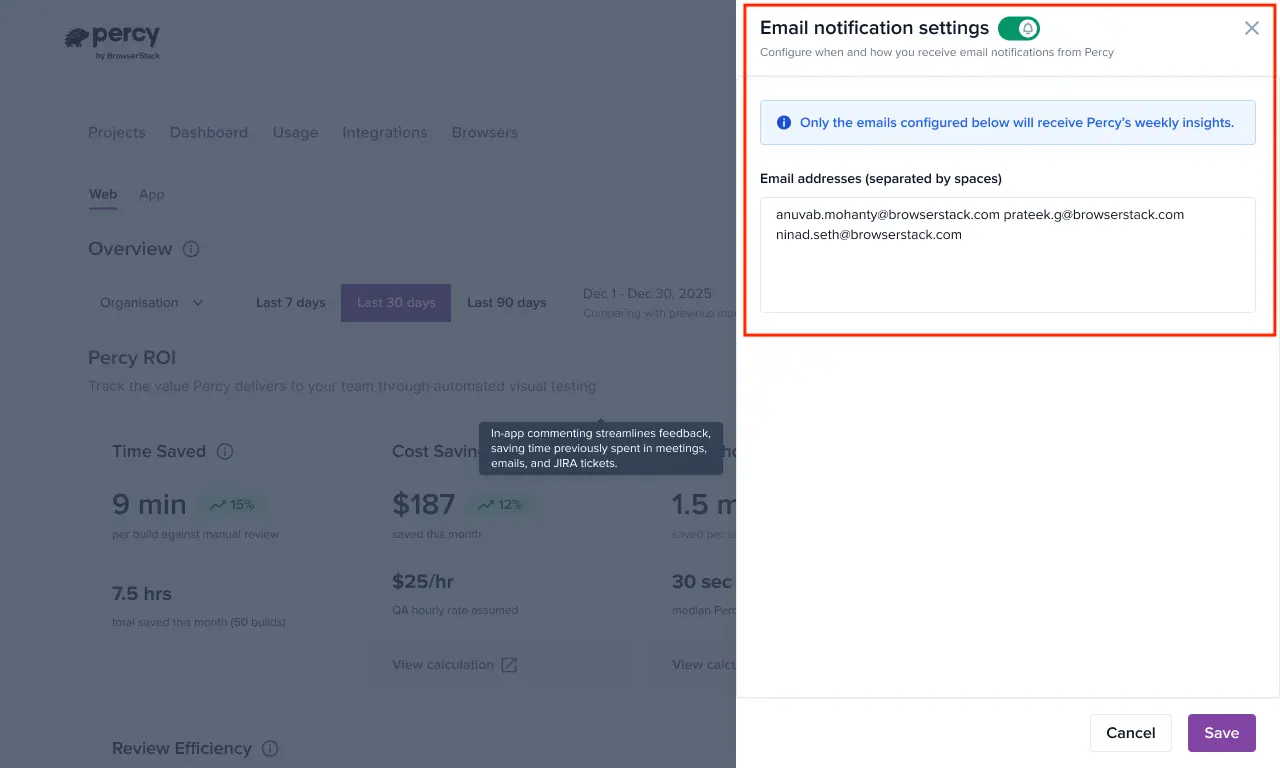
How to configure emails
Step 1: Click the settings icon on the dashboard and toggle the Email notification settings
Step 2: Add email addresses for recipients who will receive email notifications from Percy for weekly insights. Separate multiple email addresses with spaces.
What’s included
Each email report includes:
- Executive Summary: A snapshot of your Review Efficiency and Time Saved
- Trend Analysis: A comparison table showing the current period against the previous one
Example
- Review Efficiency: 78% ↑ +6% from last week
- Time Saved: 36 minutes per 100 unchanged snapshots ↑ +12%
Improve efficiency
From the dashboard or email reports, Percy provides a various methods that guides you to best practices for:
- Reducing review noise
- Stabilizing flaky snapshots
- Adjusting thresholds and ignore regions
For more information, check how to reduce noise & save more time.
You can also download a PDF version of the report for sharing with stakeholders.
Use the Percy Test Reporting Dashboard to continuously monitor your visual testing ROI, identify optimization opportunities, and demonstrate the value Percy brings to your team and organization.
We're sorry to hear that. Please share your feedback so we can do better
Contact our Support team for immediate help while we work on improving our docs.
We're continuously improving our docs. We'd love to know what you liked
We're sorry to hear that. Please share your feedback so we can do better
Contact our Support team for immediate help while we work on improving our docs.
We're continuously improving our docs. We'd love to know what you liked
Thank you for your valuable feedback!