View Network logs
This guide provides detailed information on all the features available in the network logs.
Percy’s Network logs feature gives you the ability to debug and identify where issues occurred during snapshot capturing. It provides detailed insights into network requests and their statuses, empowering you to diagnose problems effectively and take next steps in resolving any detected issues.
Access network logs
To access the Network logs for a Percy build, open the generated build, click the debug icon, and then select the Network logs tab.
![]()
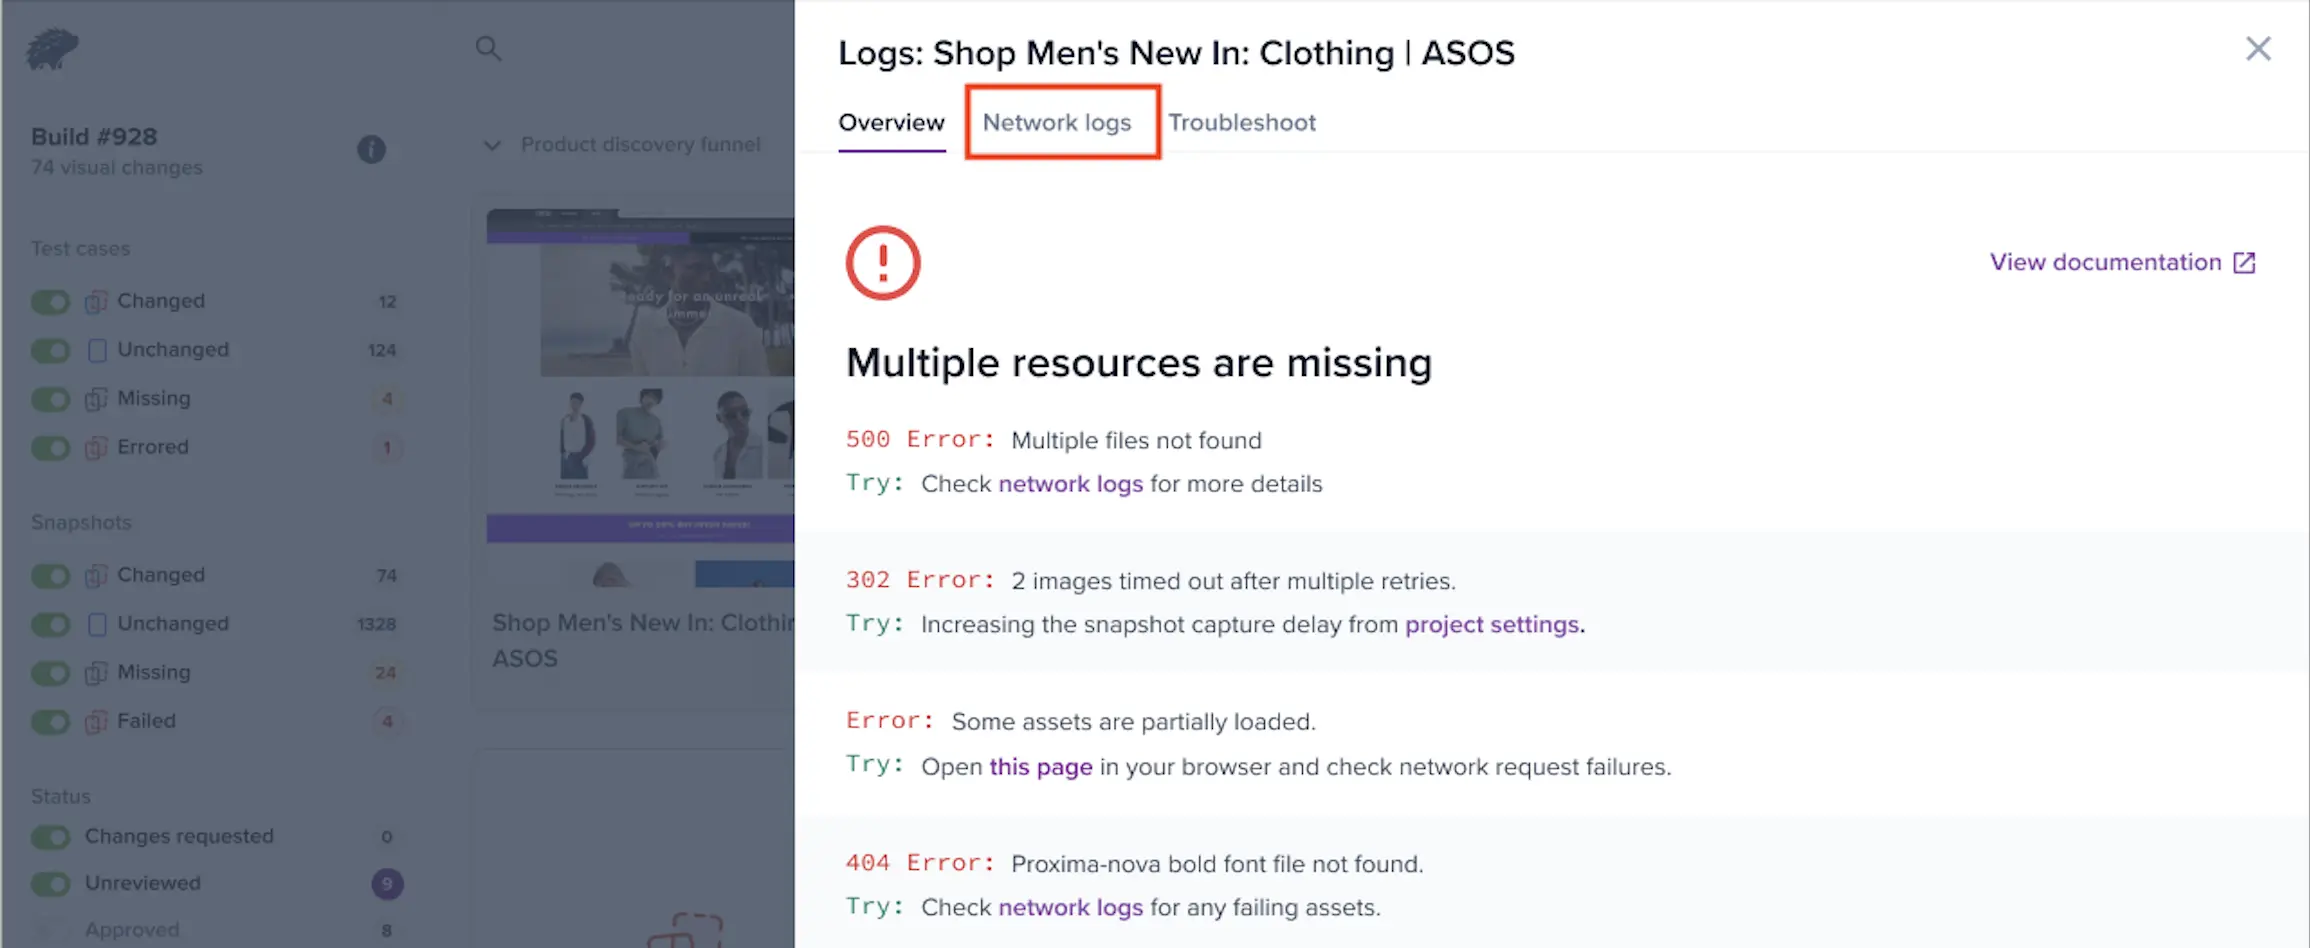
View network logs
The Network logs window provides a detailed breakdown of network activity during snapshot capturing.
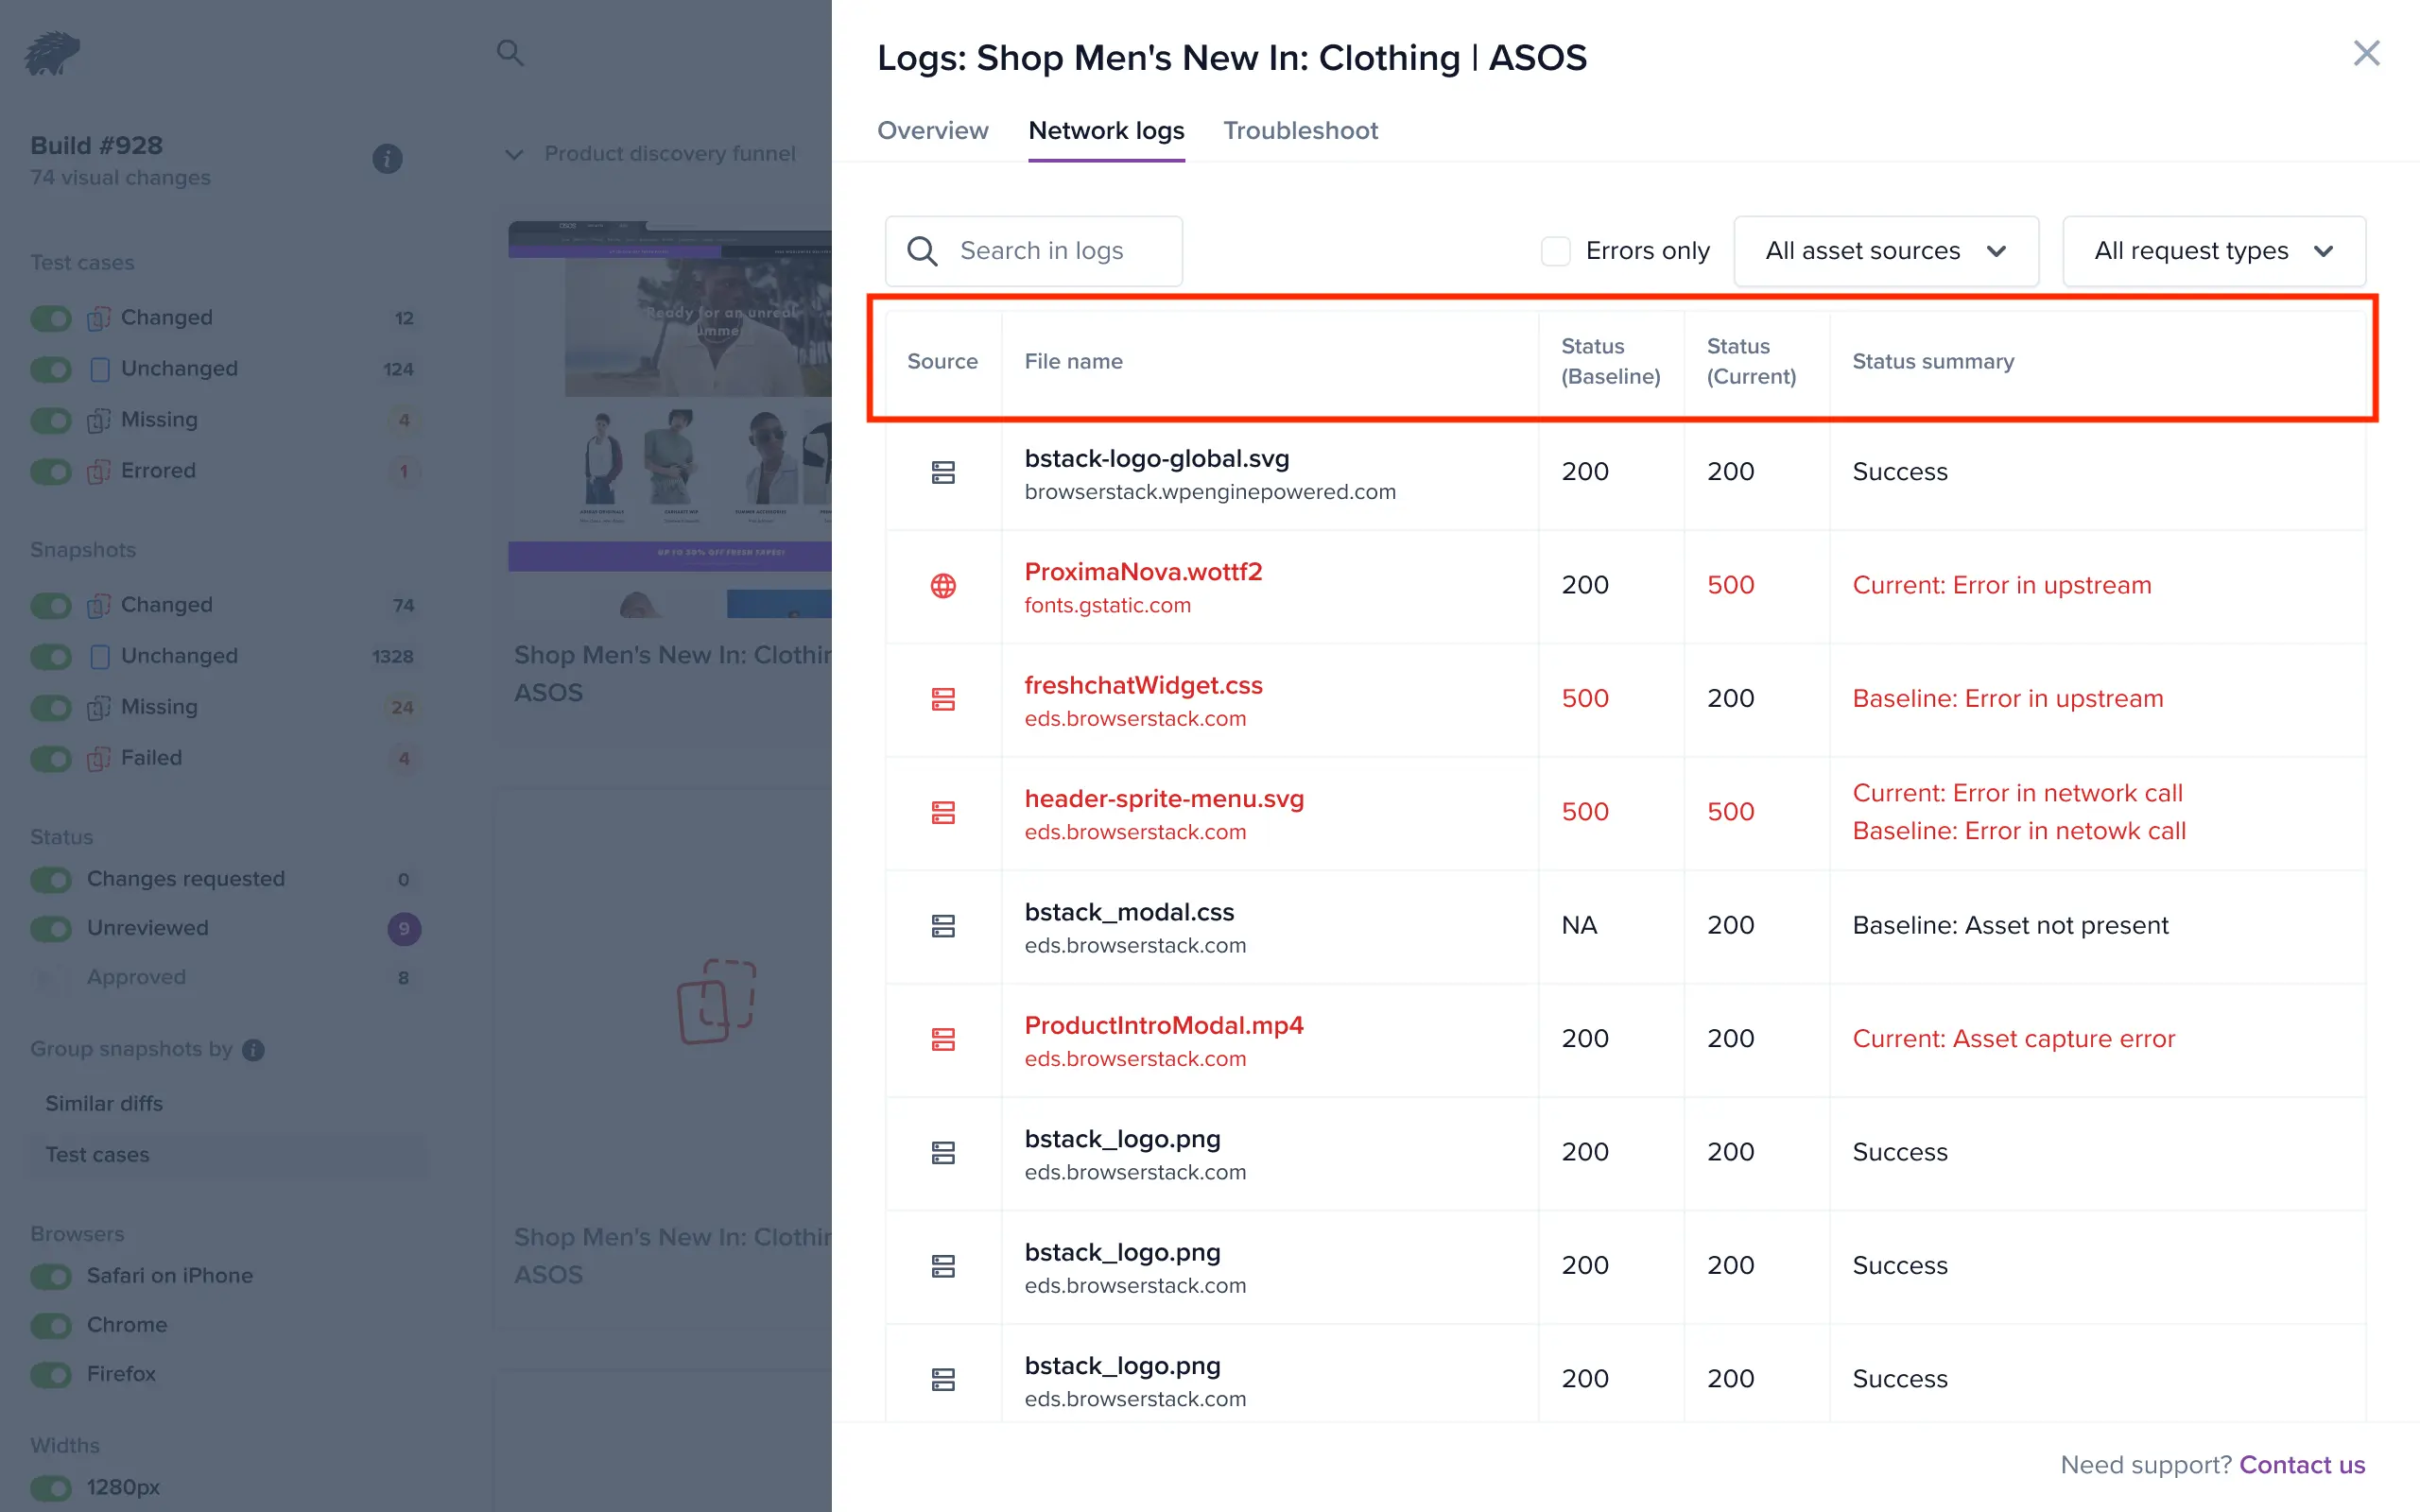
The columns in the logs help you quickly identify key information:
- Source: The first column shows the source of each asset, indicating whether it originates from an upstream server or Percy’s infrastructure.
- File name: The second column displays the file name on the first line and the domain on the second line. Hovering over the domain will reveal the full URL.
- Status for baseline: The third column indicates the status of the asset for the base snapshot.
- Status for current: The fourth column shows the status for the current snapshot.
- Status summary: A summary is provided, highlighting where any issues occurred, helping you pinpoint failures.
View detailed logs
In the detailed logs page, you will find several key sections that provide comprehensive insights:
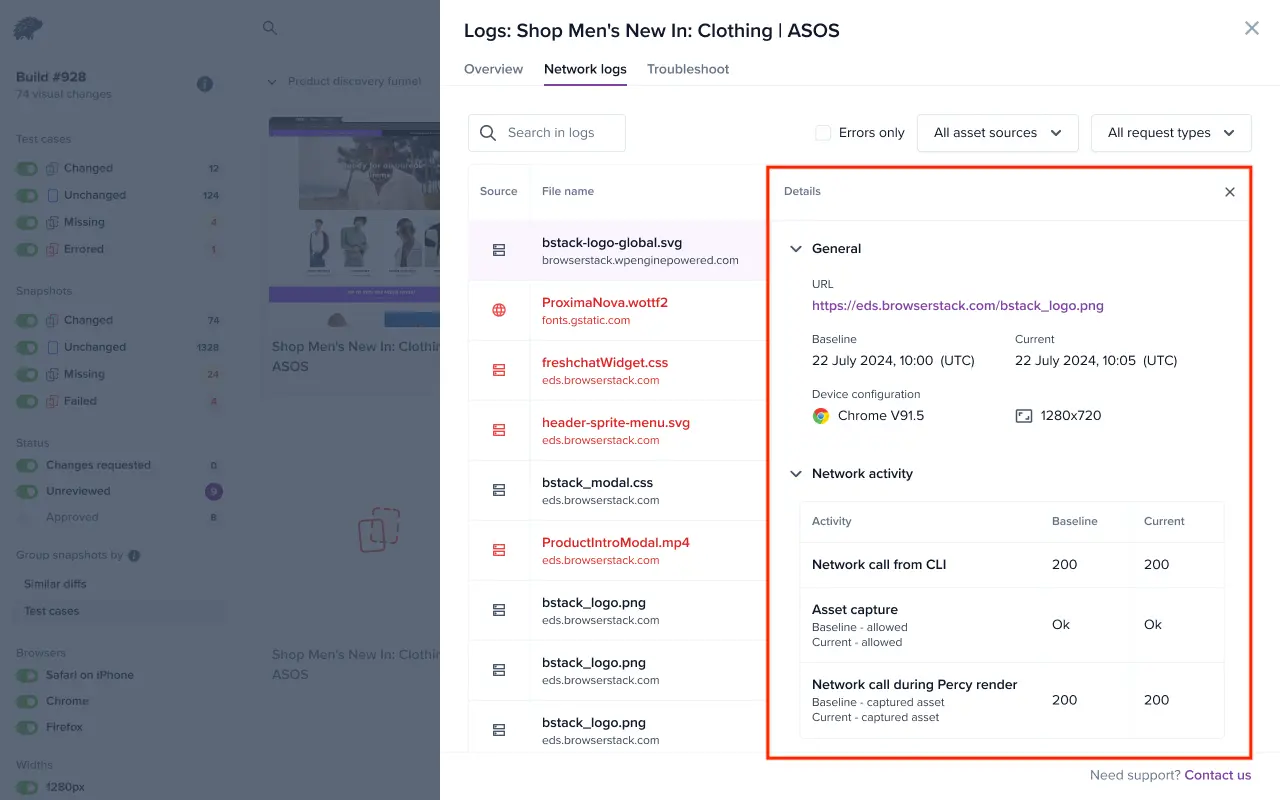
- General: This section displays the URL, timestamp for both the baseline and current snapshots, and device configuration details.
- Network activity: Here, you can see the status of network calls from the CLI, indicating whether each asset was captured. It also informs you whether asset capture was allowed, disallowed, or ignored.
This structured view helps you analyze and troubleshoot network-related challenges effectively.
Key features
-
Filters: Apply filters to focus on specific network logs based on errors, asset source, and request type.
- Asset source types: All asset sources, assets captured by Percy, public assets.
- Request types: XHR, JS, CSS, media, font, HTML, WS, manifest.
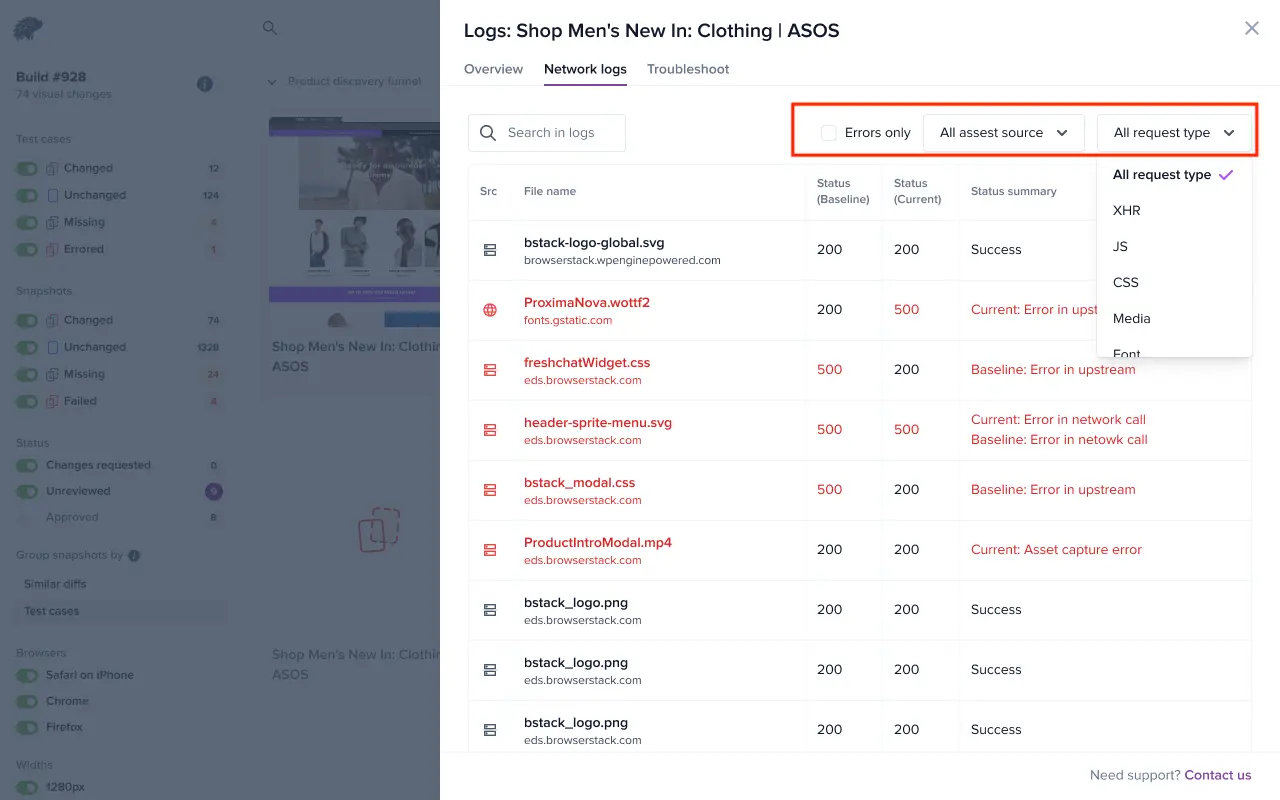
- Search: Search the network logs with specific keywords to find exact entries.
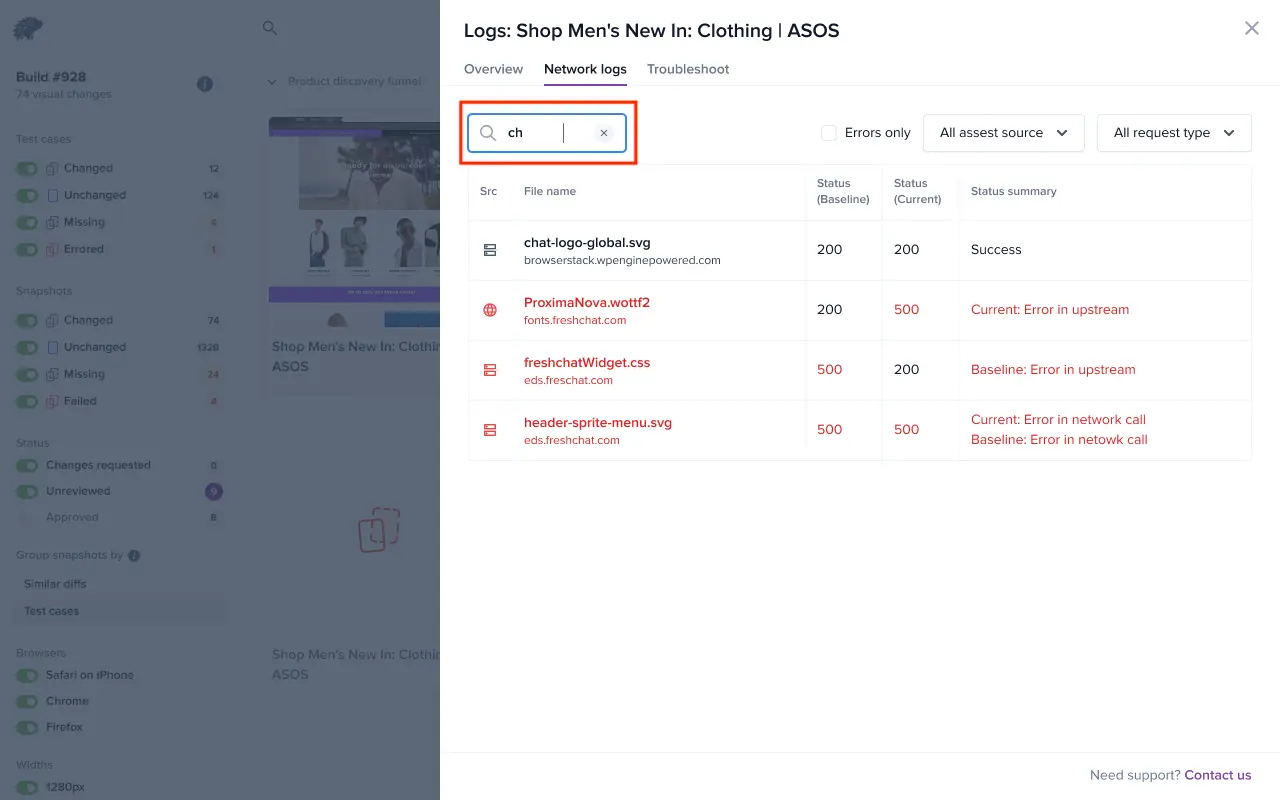
- Keyboard navigation: Use the up and down arrow keys to move through the network log list, and press Enter to load the details in the right panel.
We're sorry to hear that. Please share your feedback so we can do better
Contact our Support team for immediate help while we work on improving our docs.
We're continuously improving our docs. We'd love to know what you liked
We're sorry to hear that. Please share your feedback so we can do better
Contact our Support team for immediate help while we work on improving our docs.
We're continuously improving our docs. We'd love to know what you liked
Thank you for your valuable feedback!