
 Join our Discord
Test Failure Analysis agent
Analyze failed tests and builds with AI, refine the analysis with your own context, and apply the suggested fix.
The Test Failure Analysis agent reads the logs, screenshots, and metadata from a failed run, explains why the test failed, and categorizes the failure. The agent works at two levels by producing a root cause analysis (RCA) for each failed test and a summary of what broke across an entire build.
You can add your own context to sharpen an analysis, tell the agent how to write code fixes, and then apply a fix in your IDE or send the fix to Jira.
To enhance the performance of your AI agents, ensure they have a wide range of contextual information available, including logs and metadata. For an effective way to gather and provide this data, use the BrowserStack SDK.
Key features and benefits
The Test Failure Analysis agent includes the following capabilities:
- Automated root cause analysis that replaces manual triage of every failed test.
- AI-powered correlation of logs, screenshots, and test metadata into a single explanation of why the test failed.
- Automatic categorization that separates product bugs from environment and test script issues.
- Build-level analysis that groups failures into themes, maps them to affected workflows, and ranks both by impact.
- Refinement of the agent’s analysis using evidence you upload, such as server-side or CI/CD logs.
- Code fixes that follow your team’s language and coding conventions.
Enable BrowserStack AI
You must enable BrowserStack AI before you can use the Test Failure Analysis agent. Only Owner or Admin users can change the BrowserStack AI settings.
You can enable BrowserStack AI in your account settings.
How the Test Failure Analysis agent works
The agent follows the same sequence for every failed test, from detecting the failure through to the fix you apply.
The agent's workflow, step by step
- The agent monitors test executions and detects failures.
- The agent collects relevant artifacts such as logs, screenshots, and metadata.
- AI models analyze the data to identify patterns and anomalies.
- The agent generates a root cause summary and recommended actions for each failed test.
- At the build level, the agent clusters the failures into themes and maps those failures to the affected workflows.
- Results appear in your automation dashboard for review.
- If you add instructions or files, the agent reruns the analysis with that context included.
- From the analysis, you can apply the fix in your IDE or file a Jira ticket with the analysis attached.
Analyze build failures
When a build fails with several failing tests, working through each failure one at a time is slow. Build-level analysis explains the build as a whole and ranks failures and workflows by impact, so you know what to fix first.
For every failed build, the Test Failure Analysis agent produces the following in the Insights tab:
- AI Summary of build failure: A short account of why the build failed, and whether the failures point to a product regression, an environment issue, or a problem in the test script.
- Failure themes: Failures clustered by their underlying cause, such as timeouts, broken locators, or network errors.
- Affected workflows: Failures grouped by the user workflow they belong to, such as Checkout, Login, or Search.
Analysis runs automatically for every failed build.
How to review a failed build
- Ensure that you have enabled BrowserStack AI.
- Navigate to Build Insights in your automation dashboard.
- Open a failed build. The AI summary appears at the top of the Insights tab. If the summary doesn’t appear, click Start Analysis to run the build failure analysis manually.
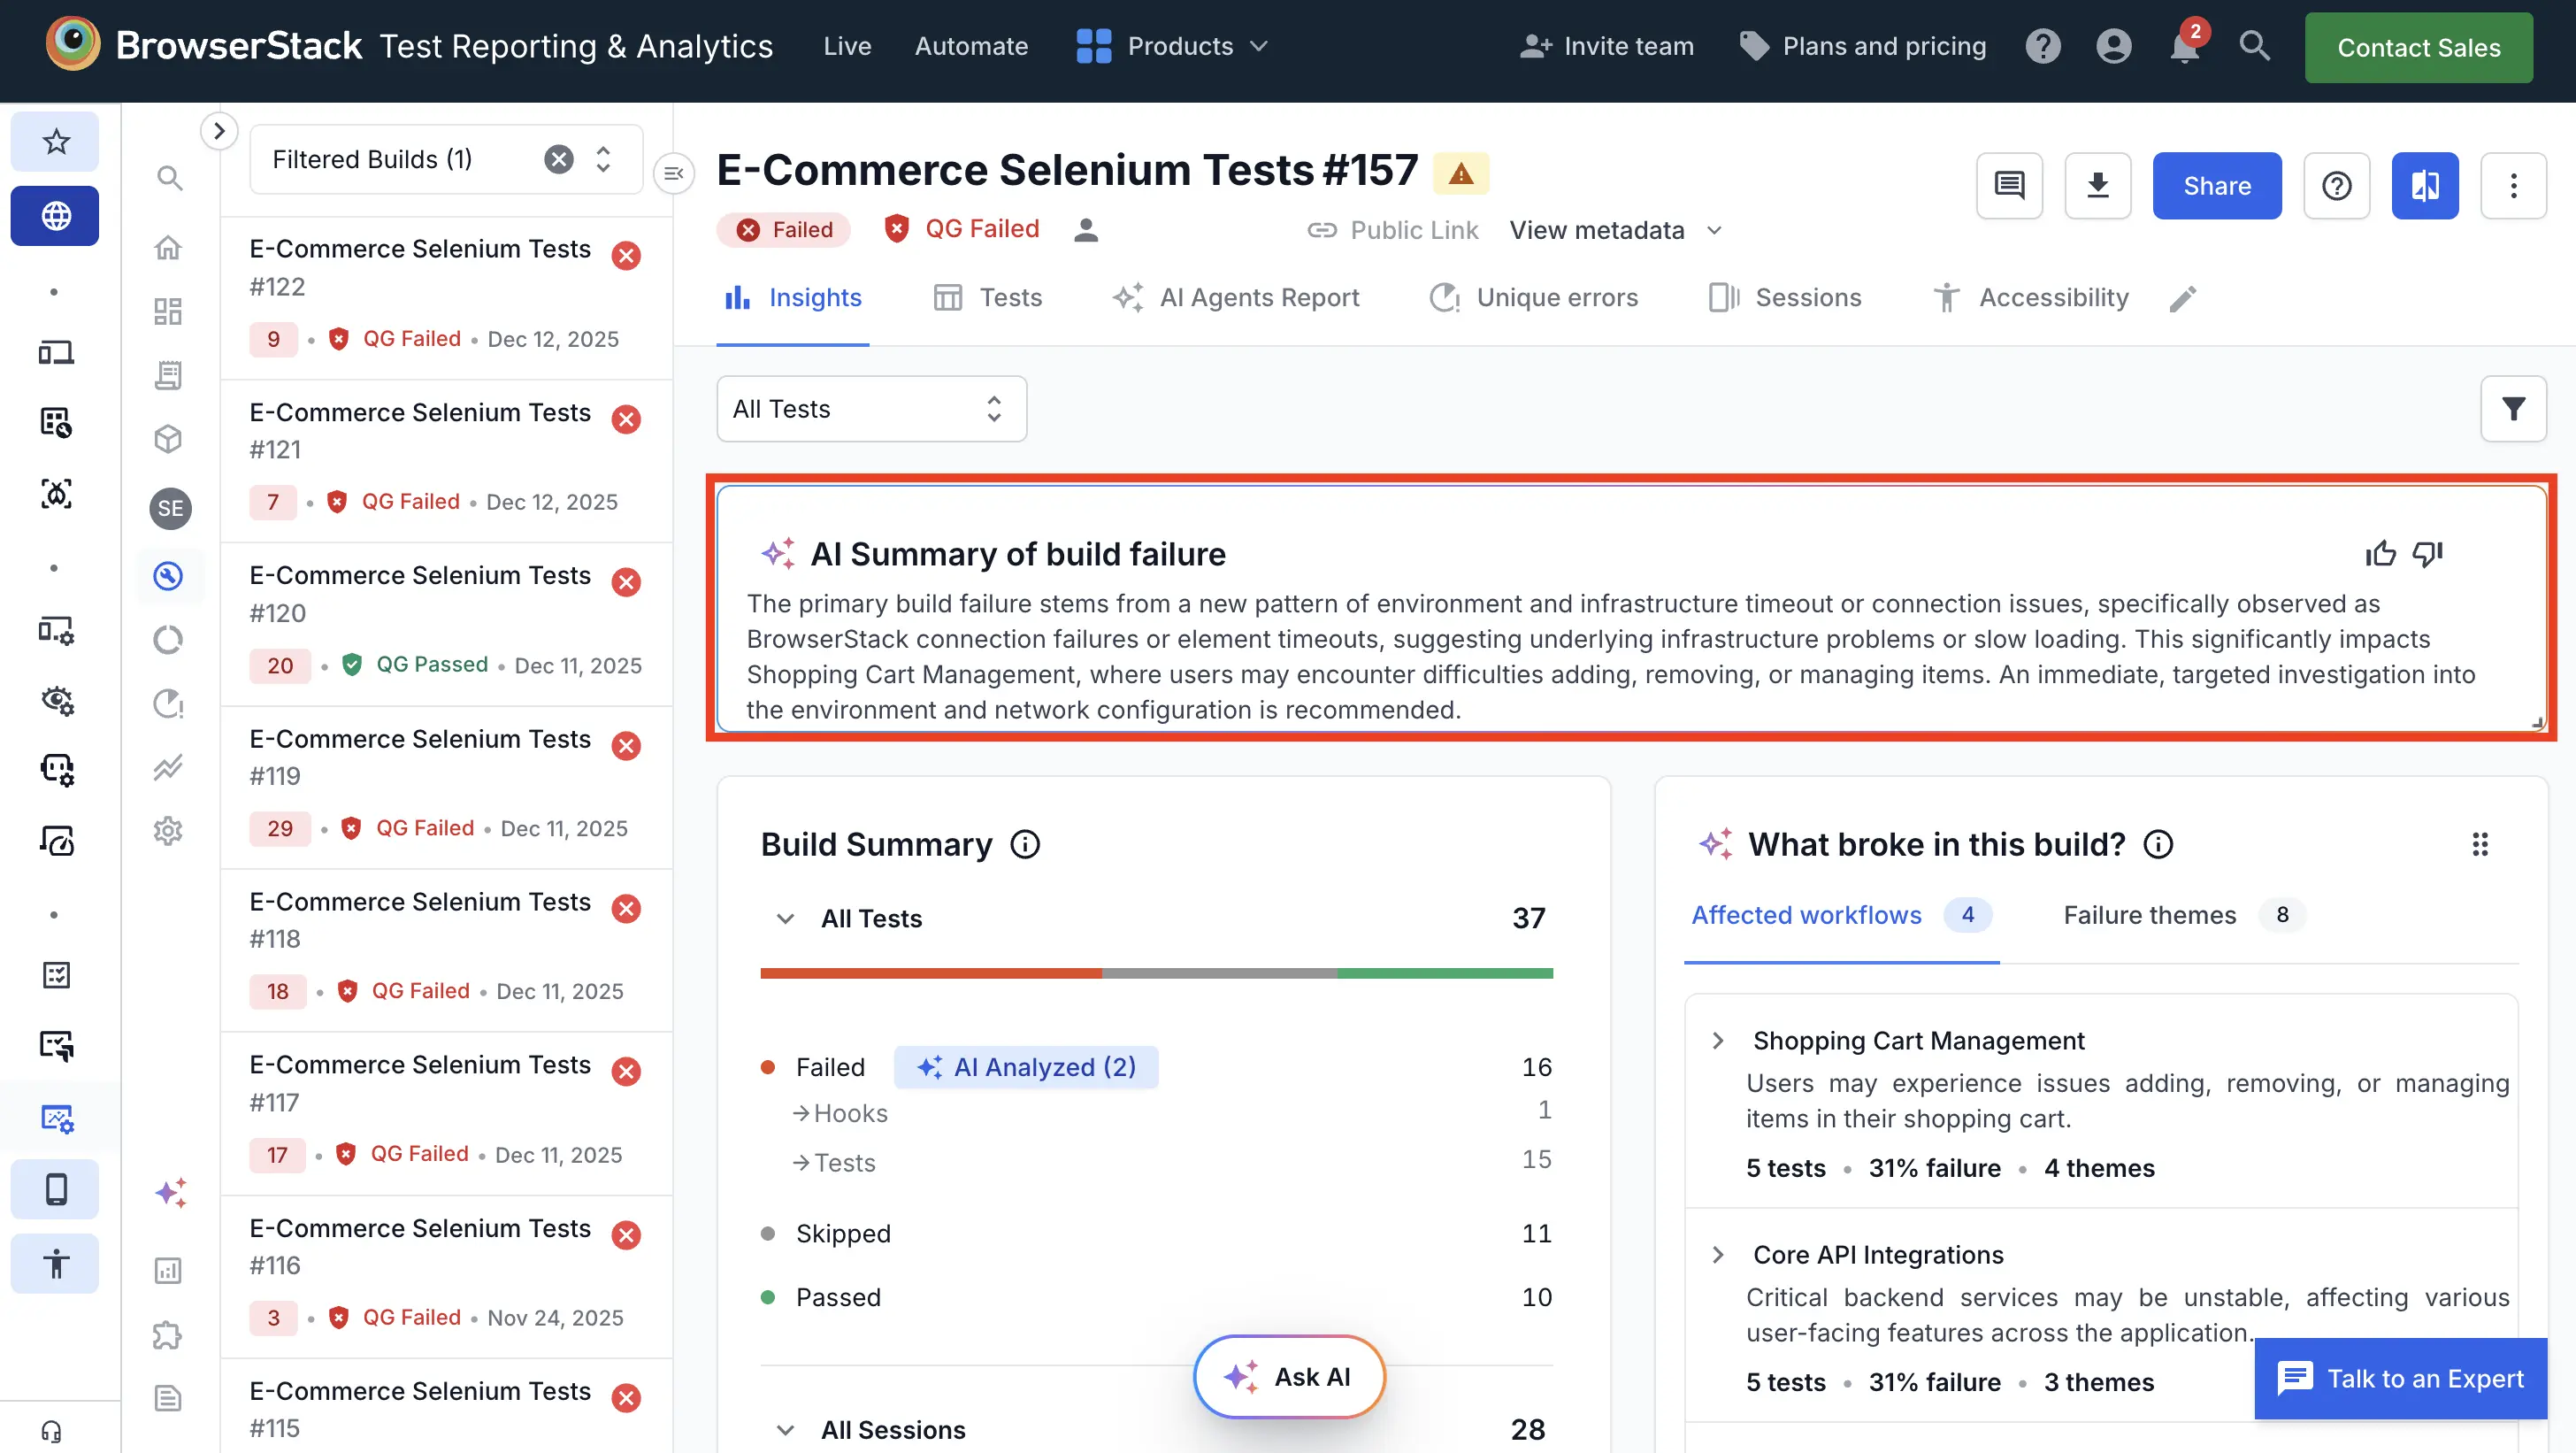
- Use the Affected workflows and Failure themes tabs to explore the build from either angle:
- Start with a workflow to see every cause breaking one part of your application.
- Start with a theme to see every workflow that a single cause is breaking.
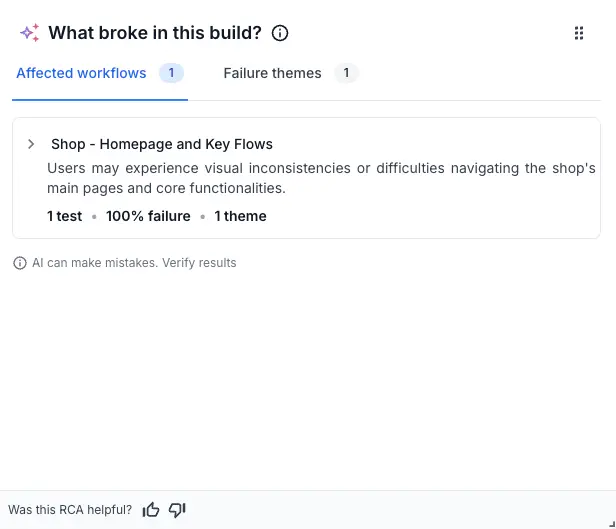
- Select a theme or a workflow to see the affected tests.
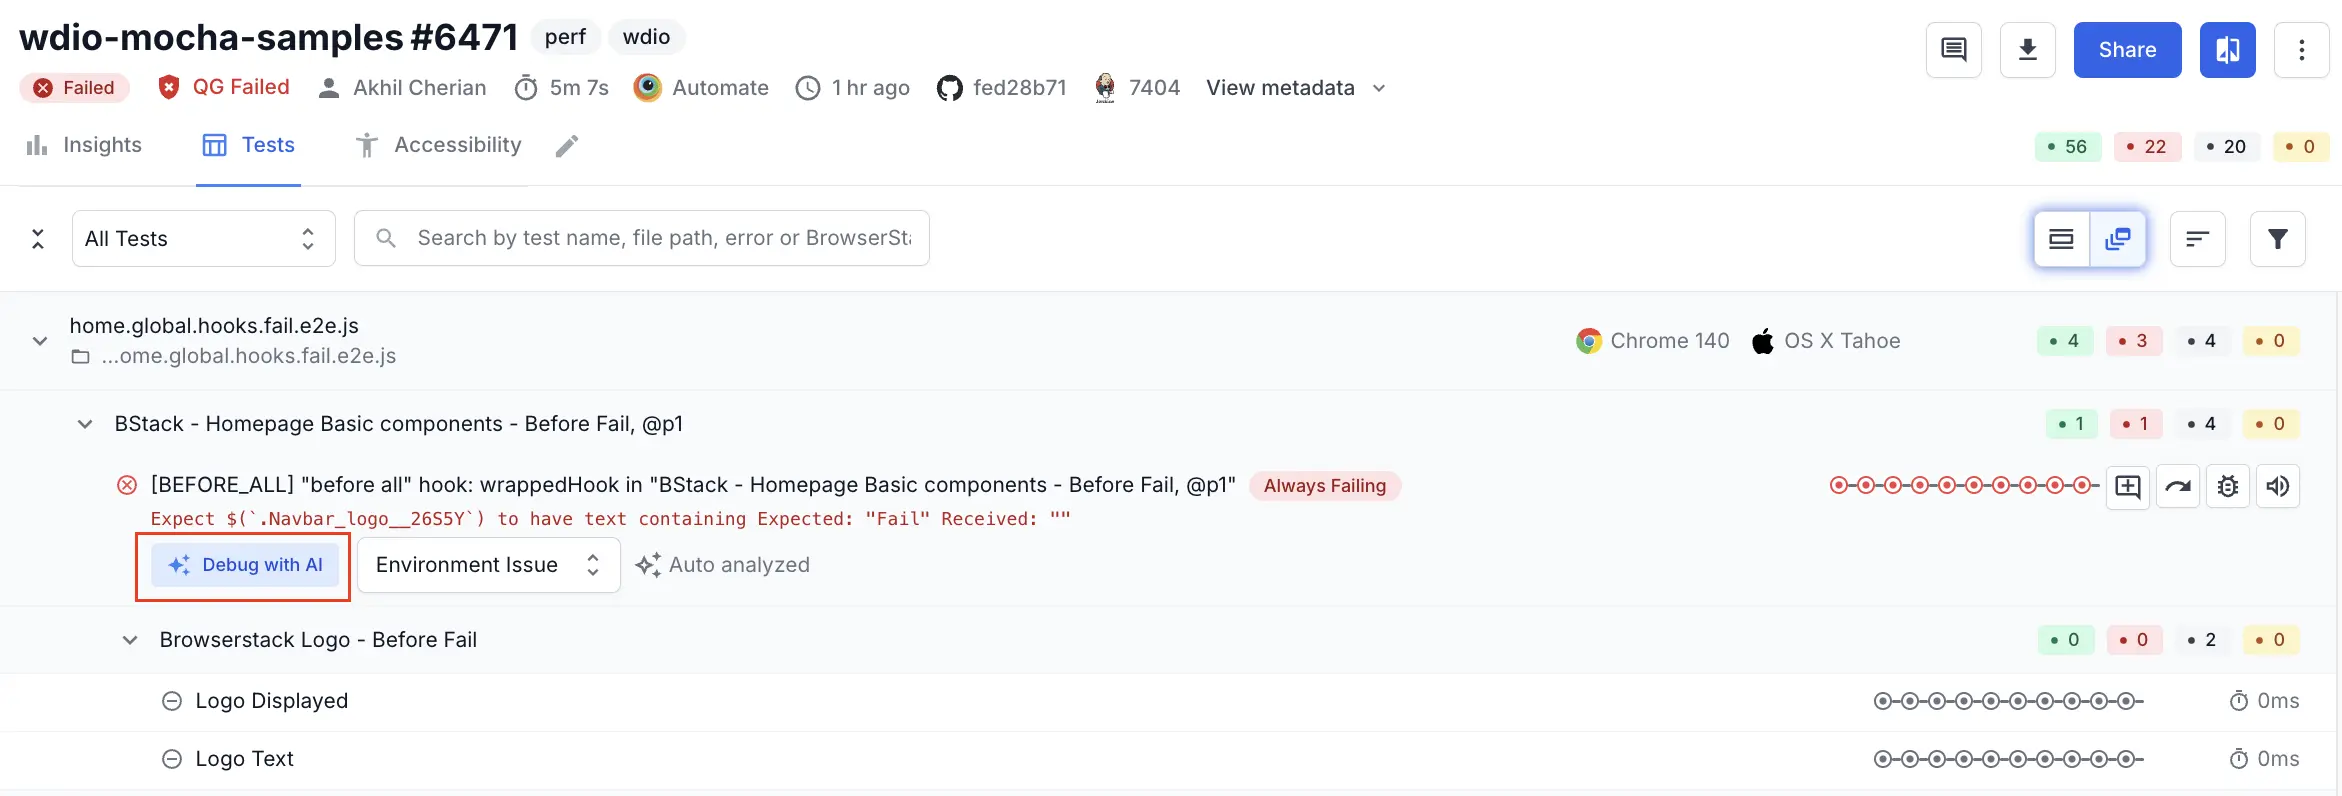
- Click Debug with AI on any test in the list to open the root cause analysis of that test.
How to view root cause analysis (RCA) results
The RCA explains why a single test failed, the evidence behind that conclusion, and how to fix the failure.
How to open the RCA for a failed test
- Ensure that you have enabled BrowserStack AI.
- Navigate to Test Listing in your automation dashboard.
- Locate the failed test case you want to analyze.
- Click Debug with AI or View AI RCA.
- After the Test Failure Analysis agent completes its analysis, you can see the following:
- The RCA summary
- An error summary
- Log evidence
- Detailed analysis with confidence level, impact, how to fix, and failure type
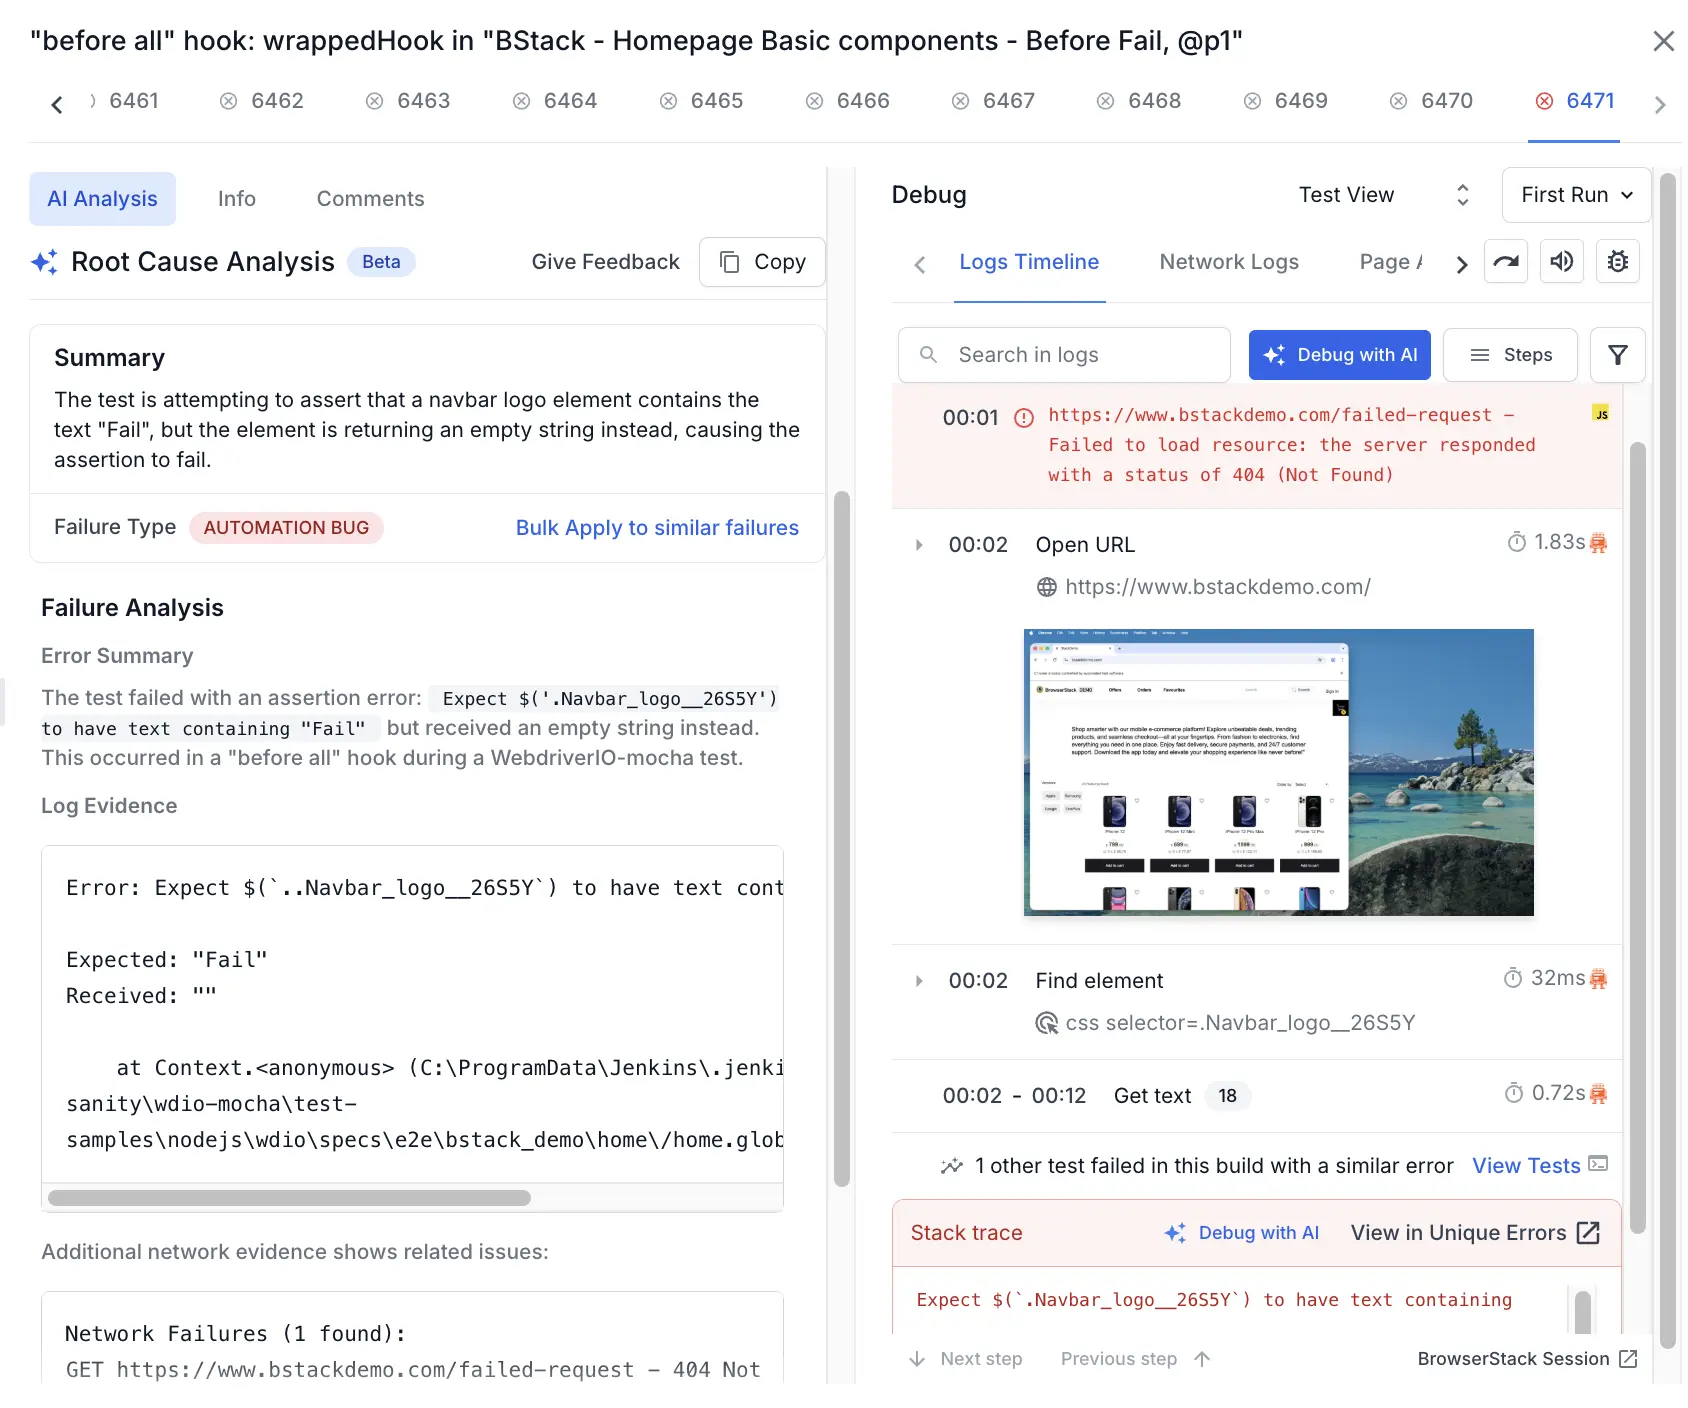
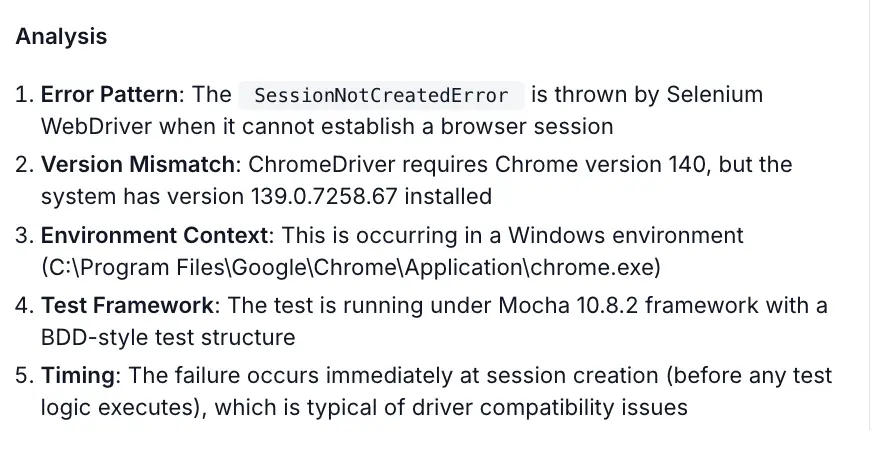
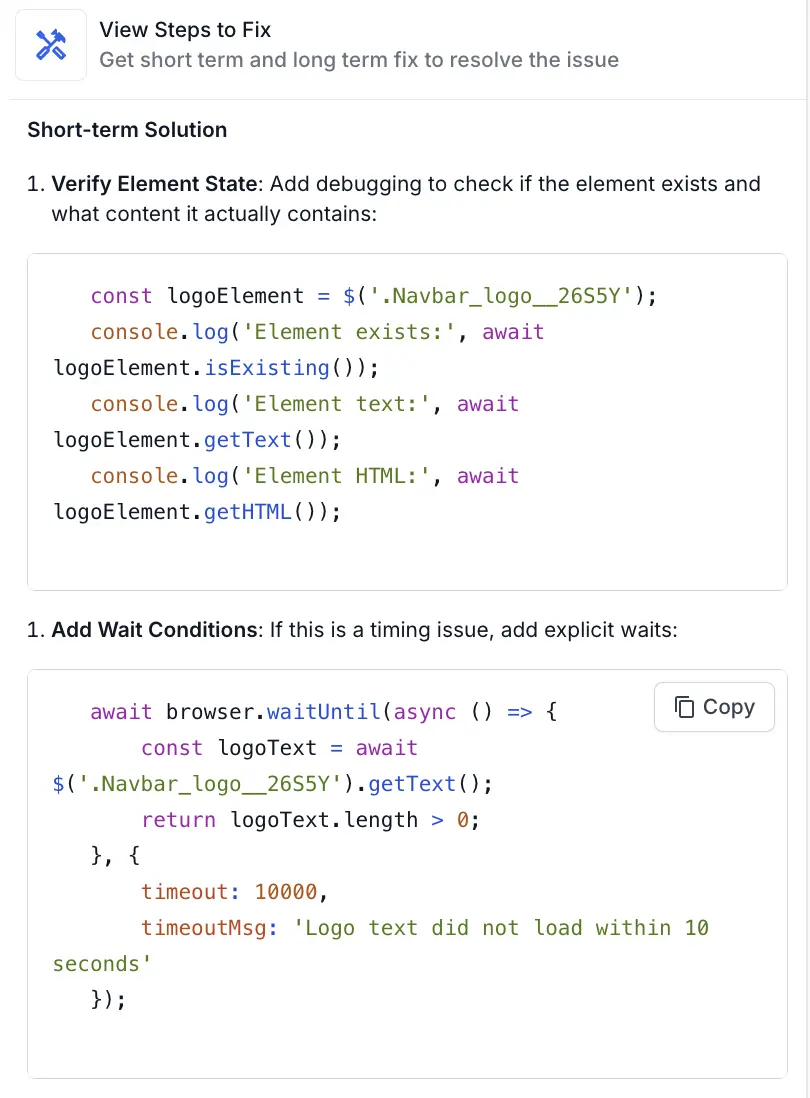
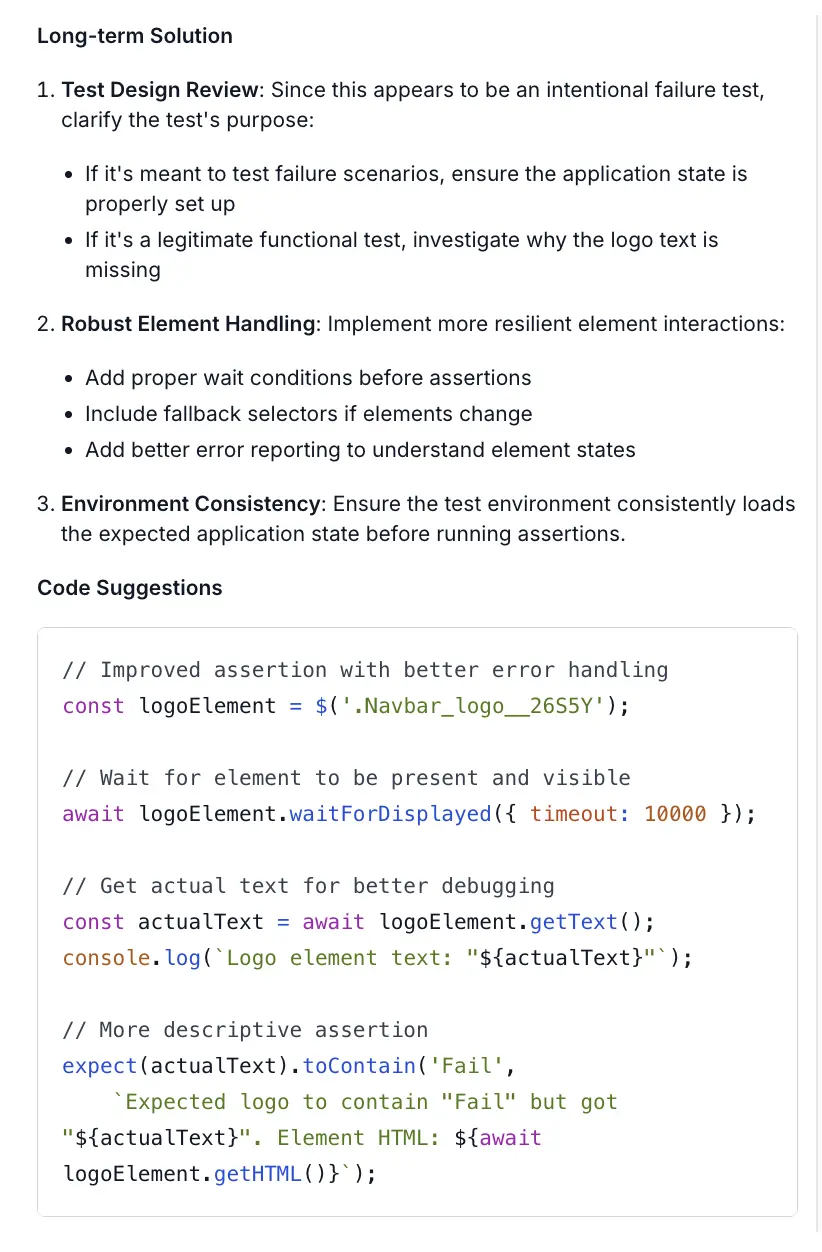
- If the categorization is correct, click Bulk Apply to similar failures to apply the failure type to similar test failures.

Refine an RCA with your own context
The agent analyzes the test execution data available in Test Reporting & Analytics. The agent can’t reach evidence stored outside the product, such as server-side logs, application logs, and CI/CD pipeline logs. Without that evidence, the analysis is limited.
If the first analysis misses that context, supply it yourself and have the agent regenerate the RCA.
What you attach applies only to that test’s analysis. Other failed tests in the same build don’t use these files.
How to refine an RCA
- Open the root cause analysis of a failed test.
- Click Refine analysis in the RCA pane.
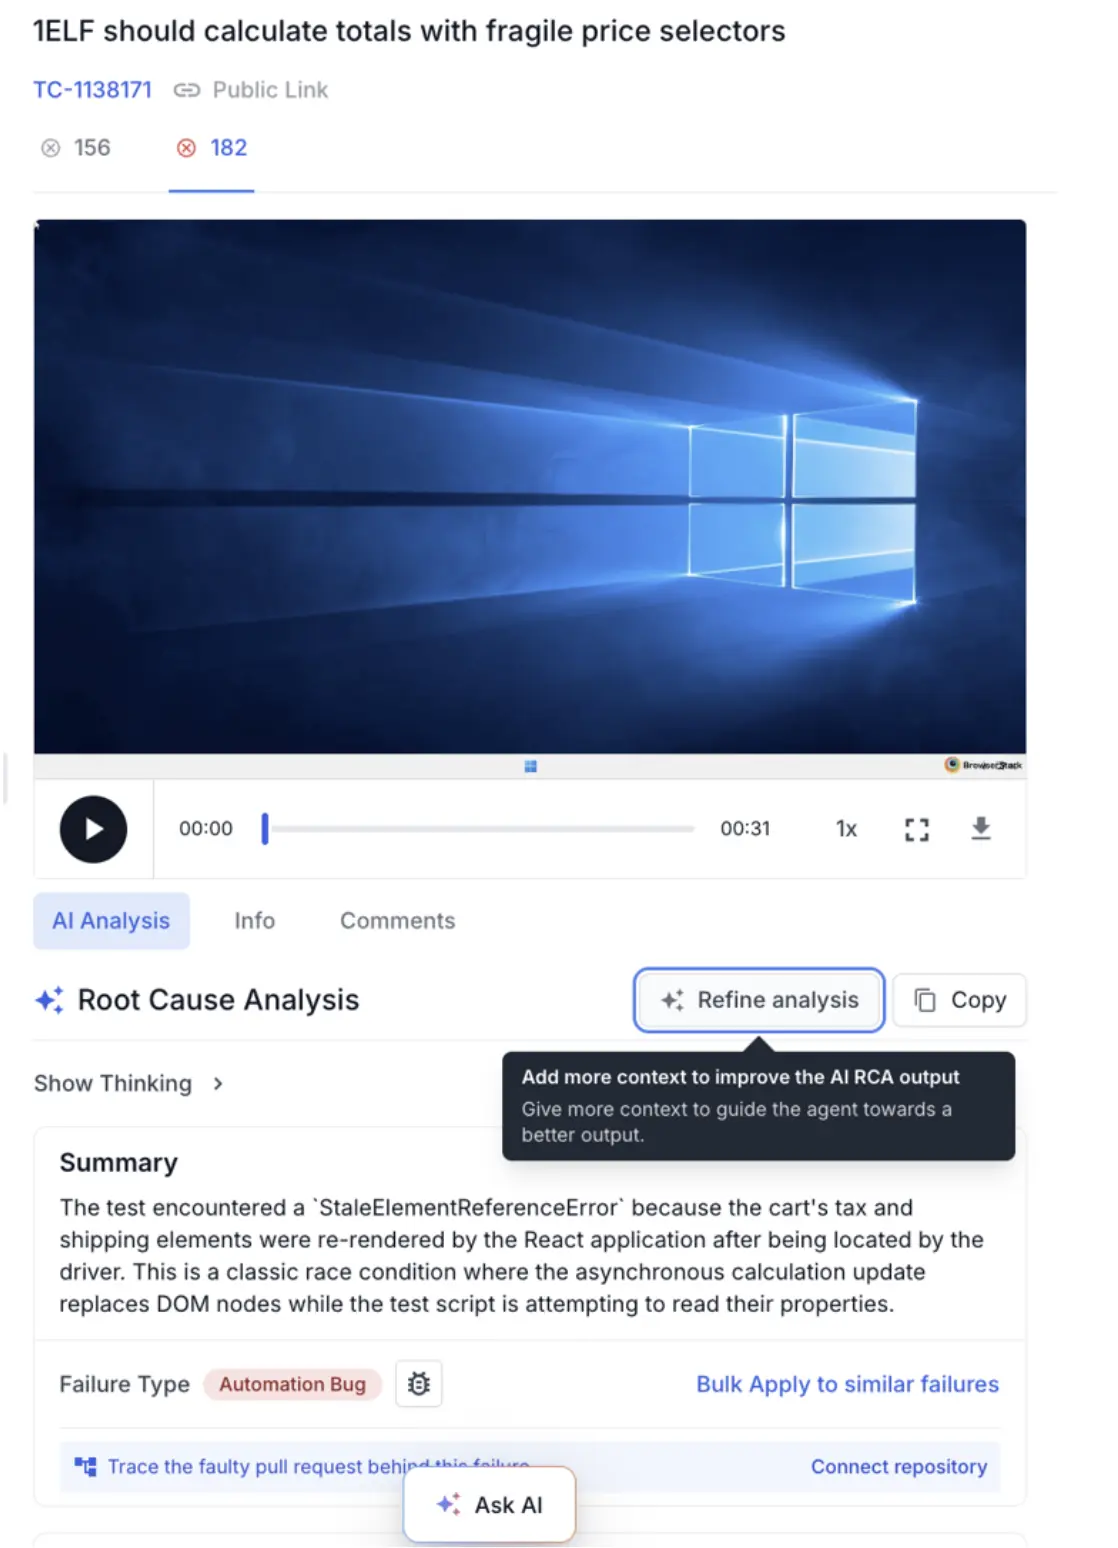
- In the chat panel that opens, describe what you’re attaching and where the agent should focus. You can paste relevant code snippets or diffs here too. For example: check the attached payment service log for 5xx responses around 10:02.
- Attach the artifacts you want the agent to read. The panel accepts
.log,.txt,.csv,.xml,.json,.har,.png,.jpg, and.jpegfiles, up to 5 MB each.
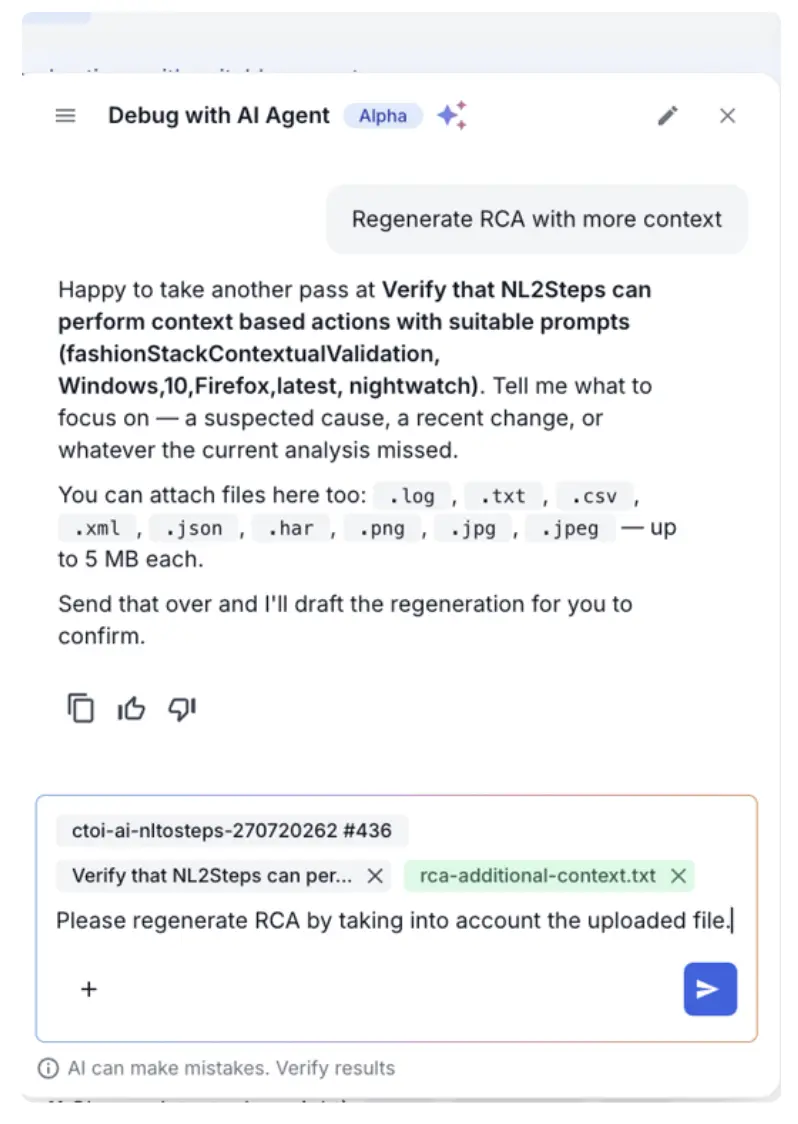
- Send your message. The agent reruns the analysis using the original test data along with your instructions and files, and the new RCA appears alongside the original so you can compare them.
- Review the new analysis and choose what to do with it:
- Click Update RCA to replace the existing analysis. The new analysis becomes the starting point for any further refinement.
- Click Discard to keep the original analysis.
What to attach when you refine an RCA
The most useful context is evidence the agent can’t reach on its own:
- Server-side or application logs for the same time window as the failure.
- CI/CD pipeline logs.
- Kubernetes pod events or container logs.
- HAR files or API responses captured outside the test run.
- The code changes in a pull request you suspect caused the failure.
Set code fix preferences
By default, the agent infers your coding style from the test file under analysis, including the language, naming conventions, and test framework. If your team follows specific architectural patterns or internal helpers, state them once and the agent applies them to every suggested fix.
Preferences are saved at the project level. Every build in that project uses those preferences for future code fix suggestions.
How to set code fix preferences
- Open the root cause analysis of a failed test and go to View Steps to Fix.
- Click Configure. The Add code fix preferences panel opens.
- In Add code instructions, describe how the agent should write fixes. For example: use the check helper instead of standard assert statements, or wrap every database call in the
RetryPolicy.execute()block. - Optionally, attach a file with your coding guidelines or a sample file for the agent to follow.
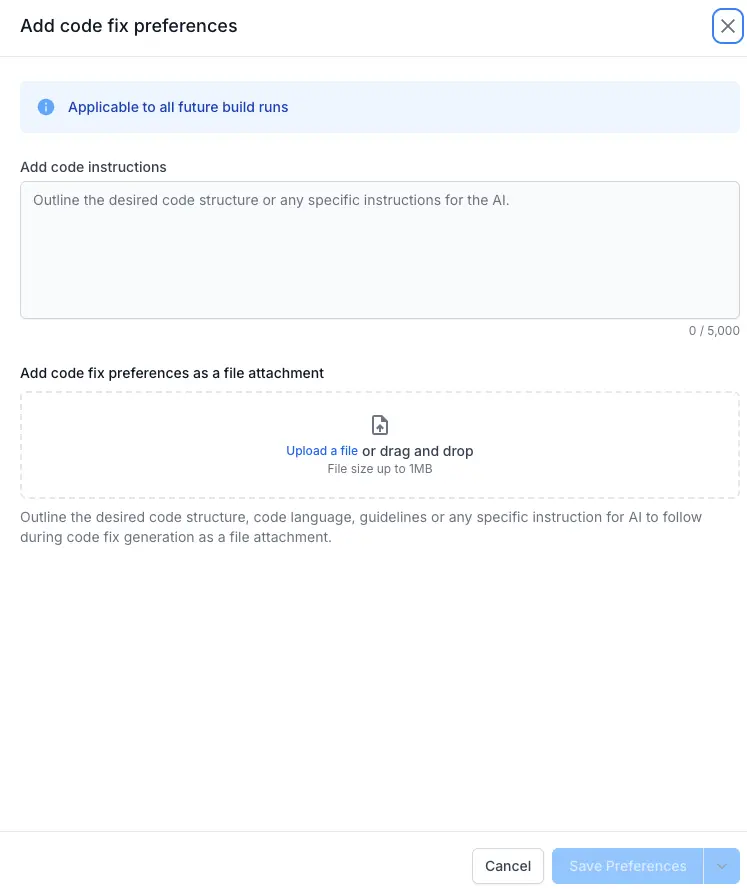
- Save your preferences:
- Click Save Preferences to apply them to all future build runs in the project.
- Click Save & Regenerate Analysis to apply them and regenerate the current RCA right away.
After you save preferences, the RCA pane shows Coding preferences applied with a Configure link, so you can review or change them at any time.
Apply the suggested code fix in your IDE
The agent suggests a code fix under View Steps to Fix. Instead of making the change by hand, you can have an AI assistant apply it to your local files. You can apply the fix in two ways.
Apply the fix with the BrowserStack Model Context Protocol (MCP) server
The MCP server works with any IDE that has an MCP-compatible AI assistant, such as GitHub Copilot in Visual Studio Code, Cursor, or Claude Desktop. Set up the BrowserStack MCP server before you start.
How to apply the fix using MCP
- In the RCA pane, under View Steps to Fix, click More Tools and select Fix using MCP.
- In the Fix with BrowserStack MCP Server dialog, click Copy Prompt. The prompt reads
Fetch RCA for test id <test-id> and apply fixes.
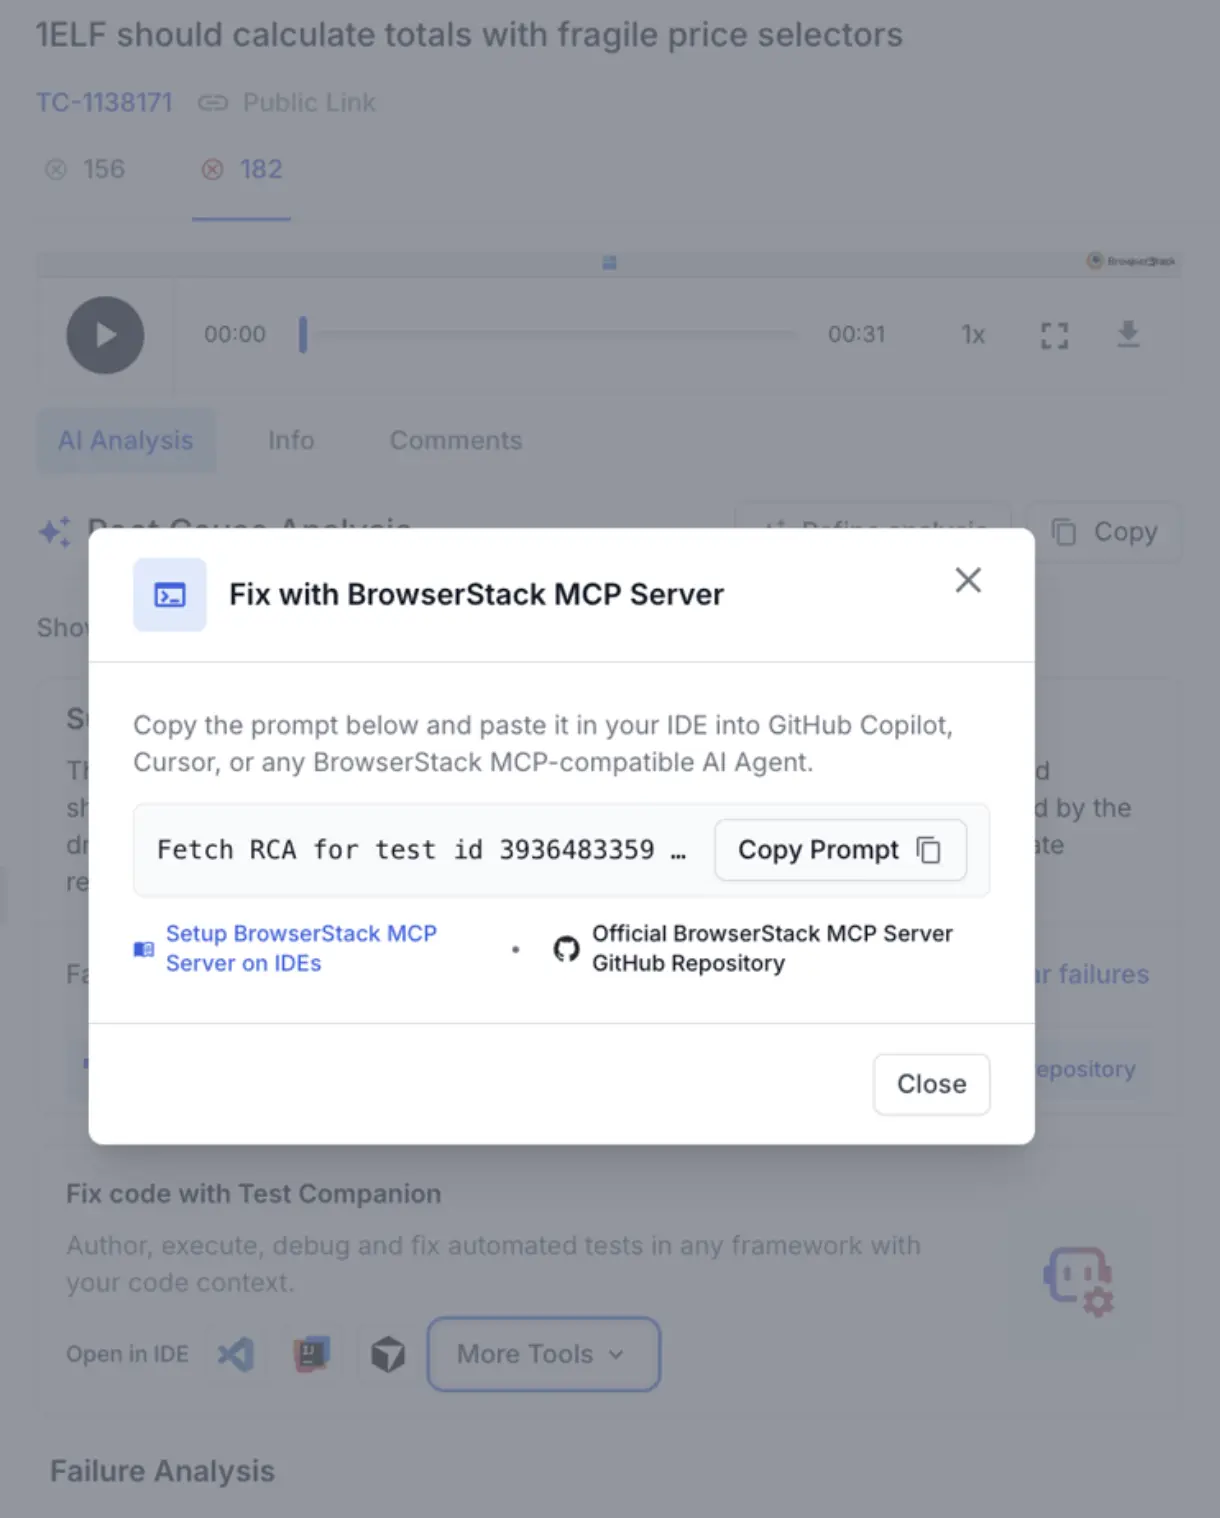
- Paste the prompt into your AI assistant’s chat.
- The assistant fetches the analysis from BrowserStack through the MCP server and edits your local source files to apply the fix. Review the change before you commit it.
Apply the fix with Test Companion
If you use the BrowserStack Test Companion extension, the RCA pane shows a Fix code with Test Companion card. Click Open in IDE, then select your IDE to apply the fix without copying a prompt. To set up the extension, see the Test Companion installation guide.
File a Jira ticket from an RCA
When a failure needs a developer to fix it, you can raise a Jira ticket straight from the RCA pane. The agent pre-fills the ticket with the analysis, so the developer doesn’t have to investigate the failure from scratch.
Before you start, integrate Jira with Test Reporting & Analytics.
How to file a Jira ticket
- Open the root cause analysis of a failed test.
- Click the Report a bug icon next to the failure category. You can also do this from Timeline Debugging.
- Select your Jira host and project.
- Choose what you want to do:
- Create issue: The agent fills in the issue type, summary, description, and labels from the RCA. The description carries the failure analysis, log evidence, and suggested fix.
-
Update existing issue: Select a ticket. The agent appends the analysis to the existing description under an AI Root Cause Analysis heading and leaves the rest of the ticket untouched.
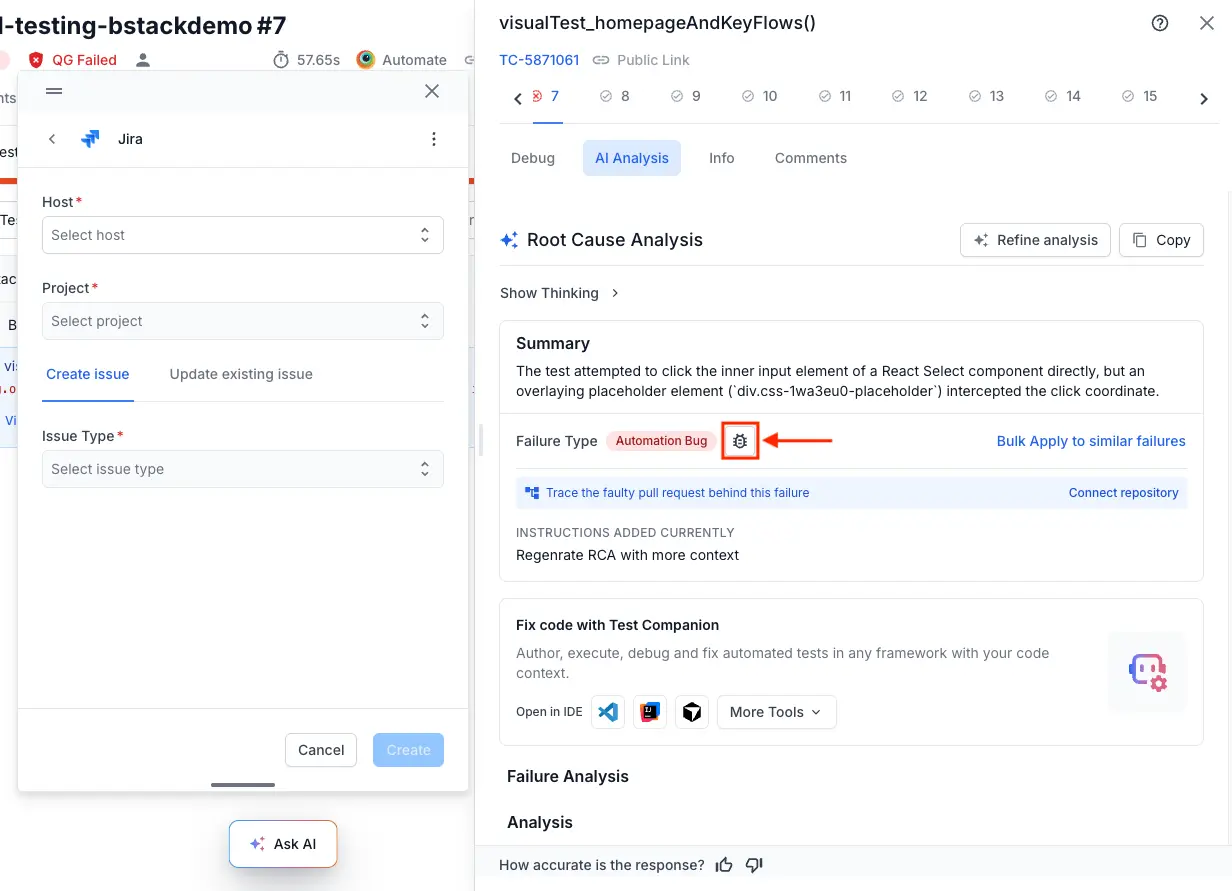
- Fill in any remaining required fields, such as assignee or sprint, and click Create or Update.
Fair Usage Policy
The following Fair Usage Policy applies when using the Test Failure Analysis agent:
| Product | Fair Usage Policy (FUP) Limit |
|---|---|
| Test Reporting & Analytics | 30 test failures analyzed per 1000 TRA test executions per month |
| Test Management | 30 test failures analyzed per 1000 TRA test executions per month |
| Automate | 1000 test failures analyzed per parallel per month |
| App Automate | 1000 test failures analyzed per parallel per month |
We're sorry to hear that. Please share your feedback so we can do better
Contact our Support team for immediate help while we work on improving our docs.
We're continuously improving our docs. We'd love to know what you liked
We're sorry to hear that. Please share your feedback so we can do better
Contact our Support team for immediate help while we work on improving our docs.
We're continuously improving our docs. We'd love to know what you liked
Thank you for your valuable feedback!