
 Join our Discord
Failure Rate by Folders widget in custom dashboards
View the failure rate of different modules in a folder list.
Hover over a folder to view the test statistics of that module. You can click through folders and subfolders to compare the failure rate of tests across multiple modules of your test suites.
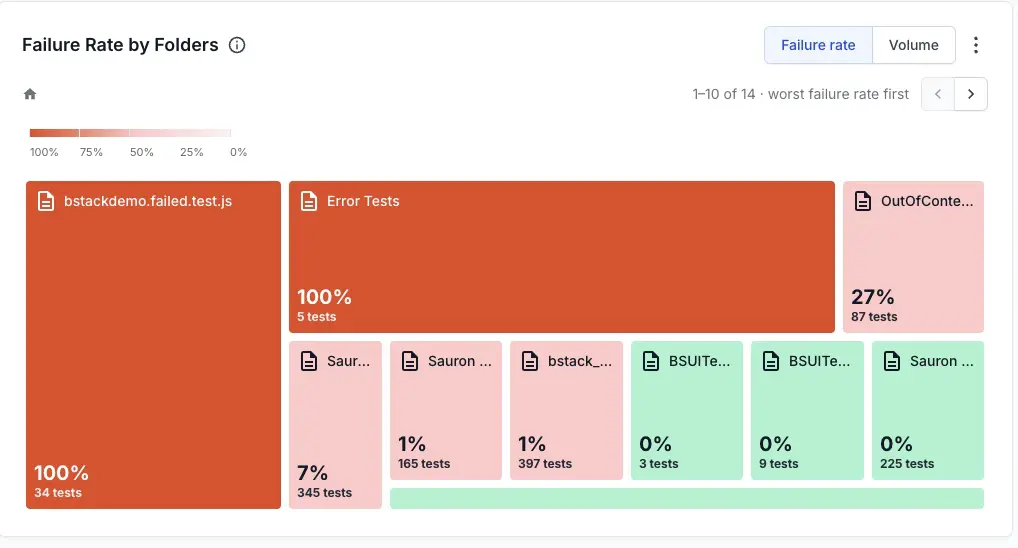
The color scale runs from 0% to 100% failure rate, so you can tell healthy modules from unhealthy modules at a glance.
Organize your tests into logical folders to get the maximum benefit from this widget. If the number of folders is high, the widget lists them across multiple pages. Click the arrow buttons to browse the entire folder list.
Sort by failure rate or volume
The Failure Rate by Folders widget has two sort options. Click Failure rate or Volume to sort the folders in descending order of failure rate or test volume, respectively.
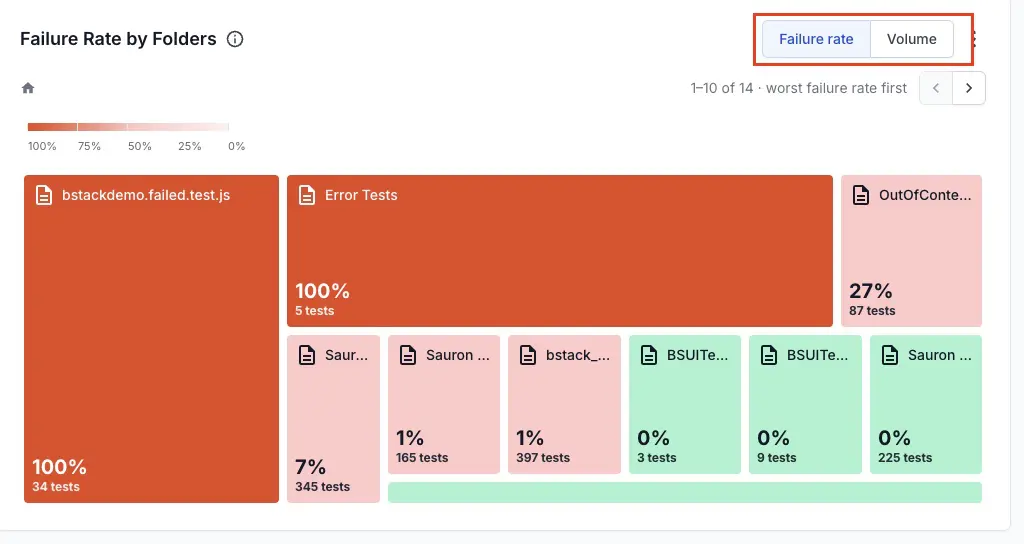
Sort by Failure rate to find the least reliable modules. Sort by Volume to find the modules that account for the largest share of your test executions.
Drill down for more information
Use the drill-down feature in the Failure Rate by Folders widget to analyze the reasons for test failures. For example, if you see a folder with a large number of test failures, you can investigate the reasons.
To use the drill-down feature:
-
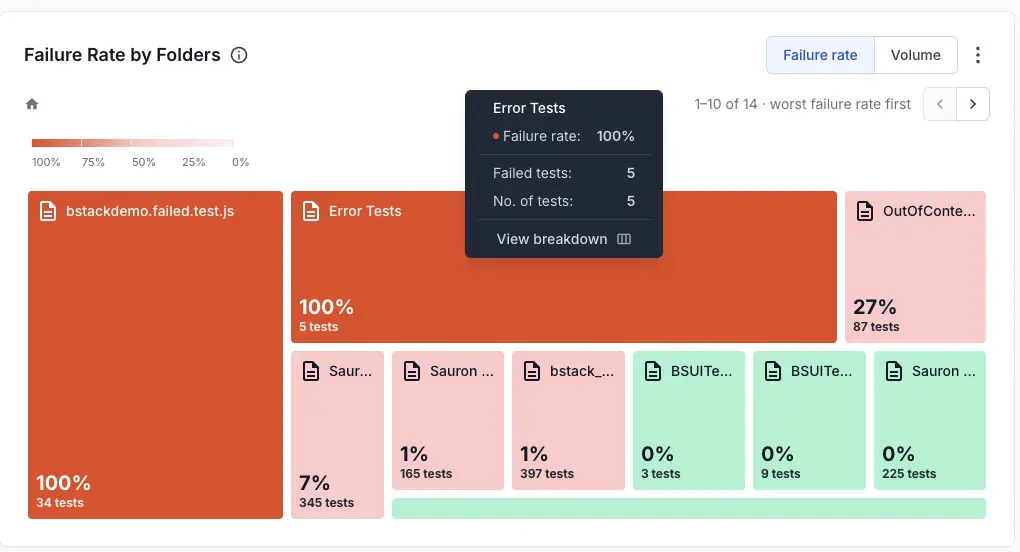
Hover over any folder in the Failure Rate by Folders widget to view its failure rate, failed test count, and total test count.
-
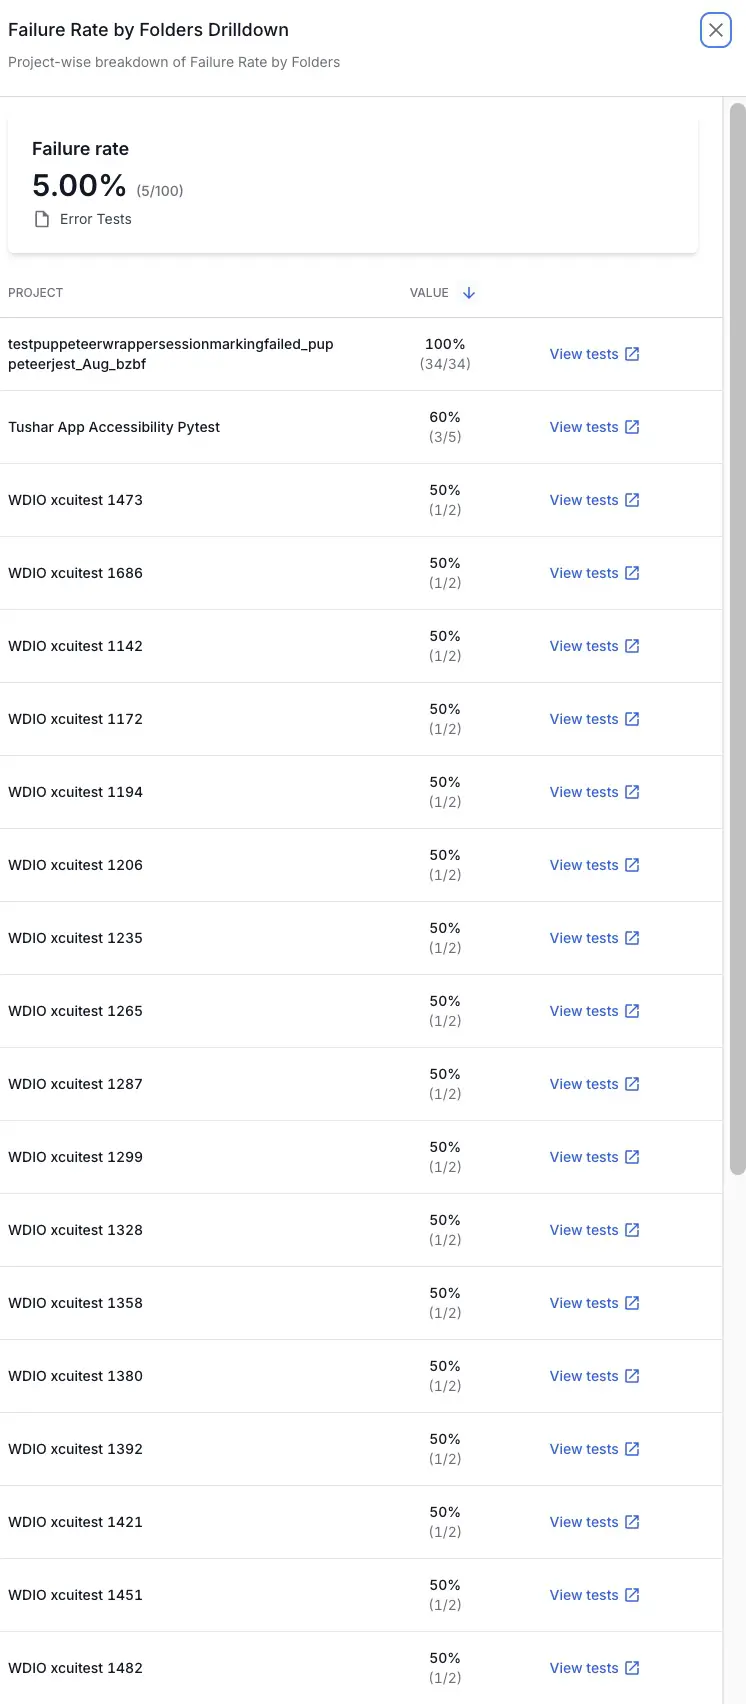
Click View breakdown. A project-wise breakdown of the metrics for the selected date range opens in a side pane.
-
Click View tests next to a project to view the tests that contribute to the test failures.
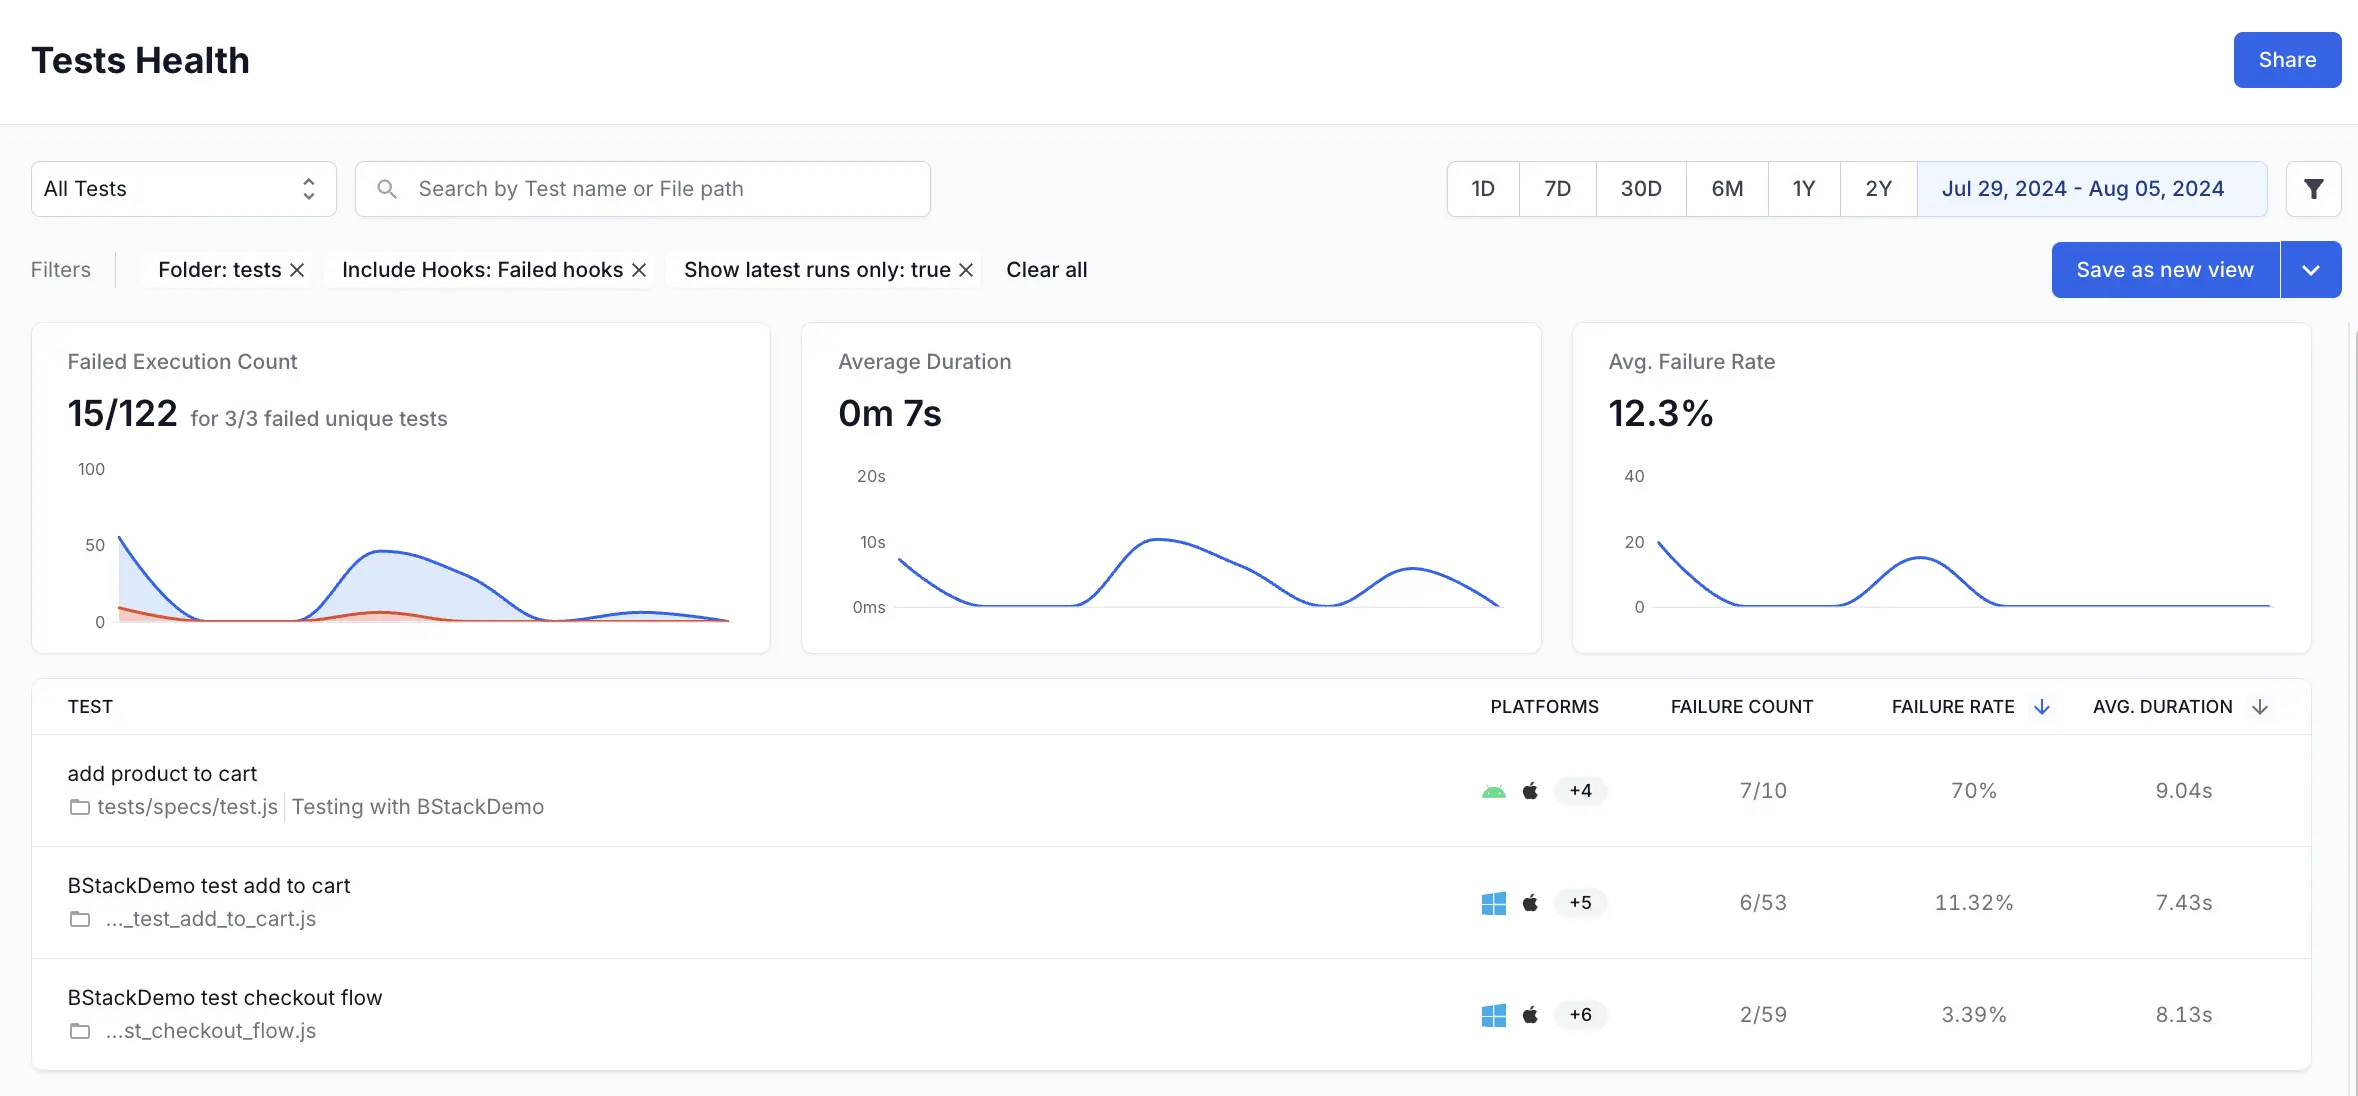
The Tests Health page opens in a new tab with the applicable filters. On Tests Health, you can view the individual tests that contribute to the failure count in specific folders and investigate what caused the test failures.
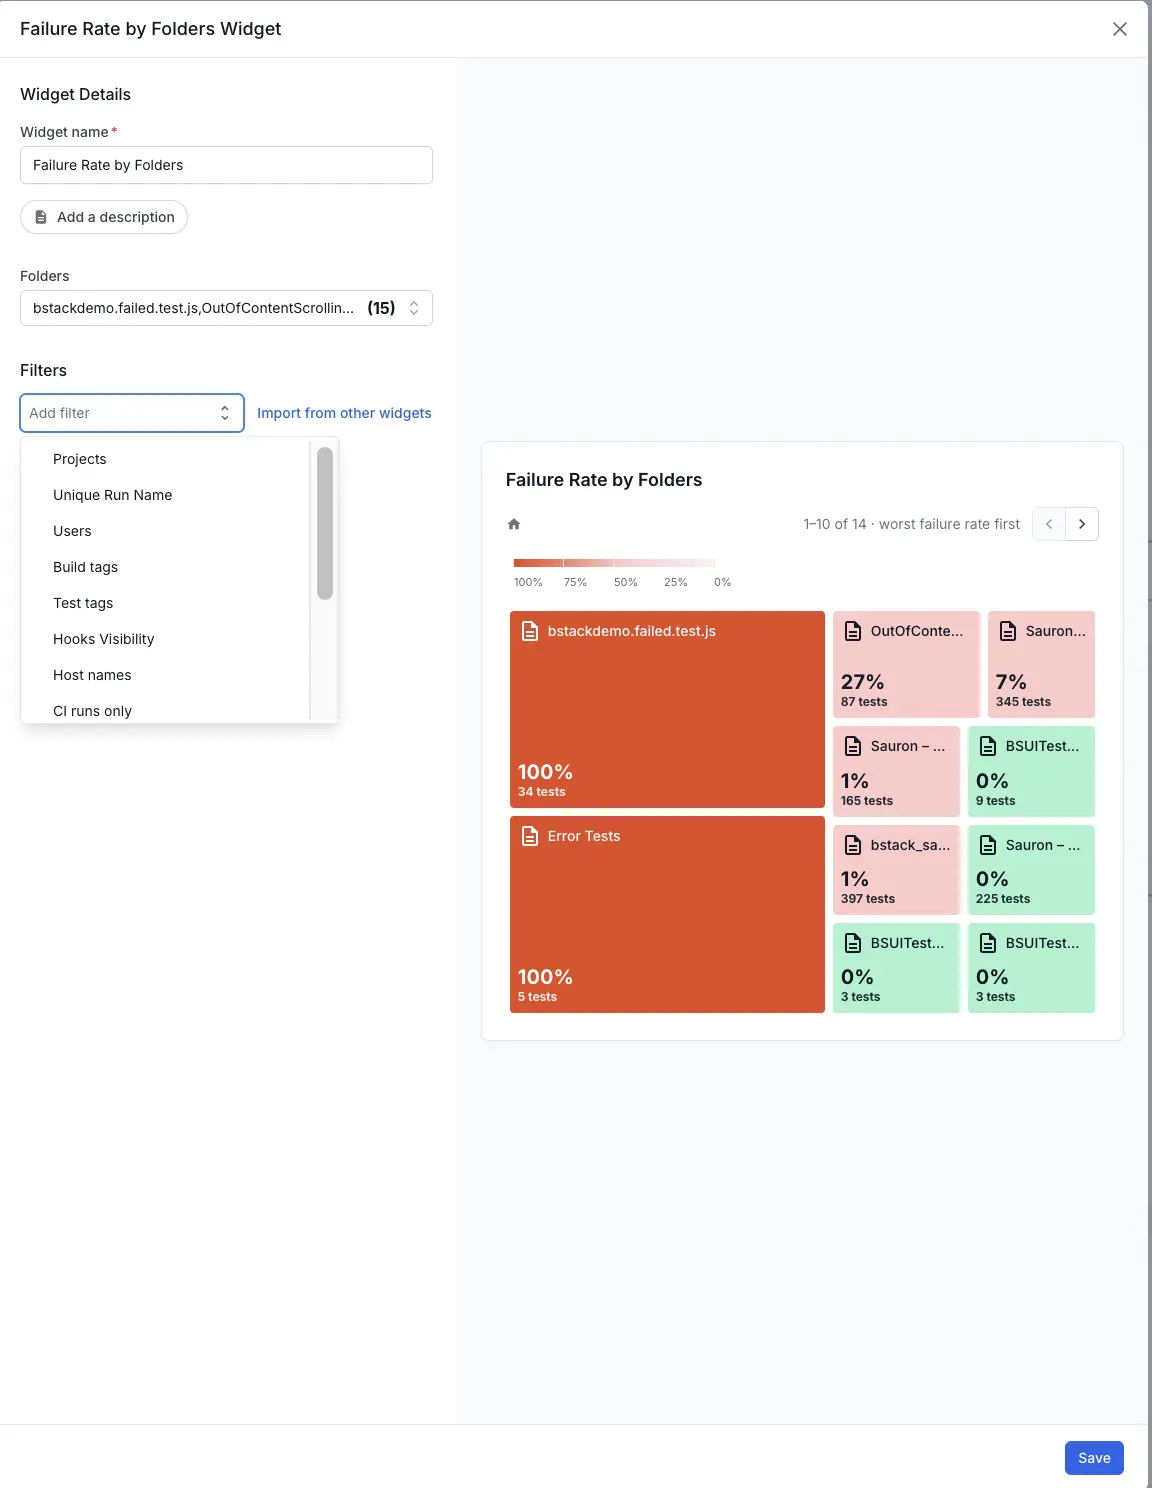
Widget configuration: Failure Rate by Folders
You can configure the following options in the Failure Rate by Folders widget:
- Widget name: A required name to easily identify the purpose of the widget.
- Description: An optional widget description to explain the purpose in detail. You can view this description by hovering over the info icon on the widget.
- Folders: The folders to include in the widget. Select one or more folders from your test repository to scope the widget to the modules you care about.
- Filters: A filter to include only the data you want. The parameters by which you can filter data are Projects, Unique Run Name, Users, Build Tags, Test Tags, Hooks Visibility, Host Names, CI runs only, Branch, Device, OS, Browser, and Custom fields. You can also import filters from other widgets to avoid duplicate efforts.
Sample use cases
You can use the Failure Rate by Folders widget to find the parts of your test suite that need attention first. Here are a few sample use cases to get you started:
Find the least reliable modules
Sort the widget by Failure rate to rank folders from the worst failure rate down. The folders at the top are the modules that fail most often, which makes them the first candidates for a stability audit. Drill into a folder to see which projects contribute to its failures, then use the drill-down feature to reach the individual tests on Tests Health.
Separate high-impact failures from low-volume noise
A folder with a 100% failure rate across three tests matters less than a folder failing at 40% across 90,000 tests. In folder view, tile size represents test volume and shade represents failure rate, so a large dark tile is a high-impact module. Sort by Volume to confirm which folders carry the bulk of your test executions before you assign fixes.
Track module ownership across teams
If your test repository maps folders to teams or modules, use the folder hierarchy to compare failure rates across those teams. Click through subfolders to narrow from a top-level module to the specific test files that drive the failure rate, and add a Users or Build tags filter to scope the widget to a single team’s runs.
We're sorry to hear that. Please share your feedback so we can do better
Contact our Support team for immediate help while we work on improving our docs.
We're continuously improving our docs. We'd love to know what you liked
We're sorry to hear that. Please share your feedback so we can do better
Contact our Support team for immediate help while we work on improving our docs.
We're continuously improving our docs. We'd love to know what you liked
Thank you for your valuable feedback!