
 Join our Discord
Statistics cards
Show one number on your dashboard, as a count of test cases or defects, or as a percentage whose numerator and denominator you define.
The Statistics Cards (Single) widget shows one number on your dashboard. Filters decide which test cases or defects that number counts, so a single card can track a figure as specific as the count of automated functional test cases.
This widget counts test cases or defects, not test executions, runs, or builds.
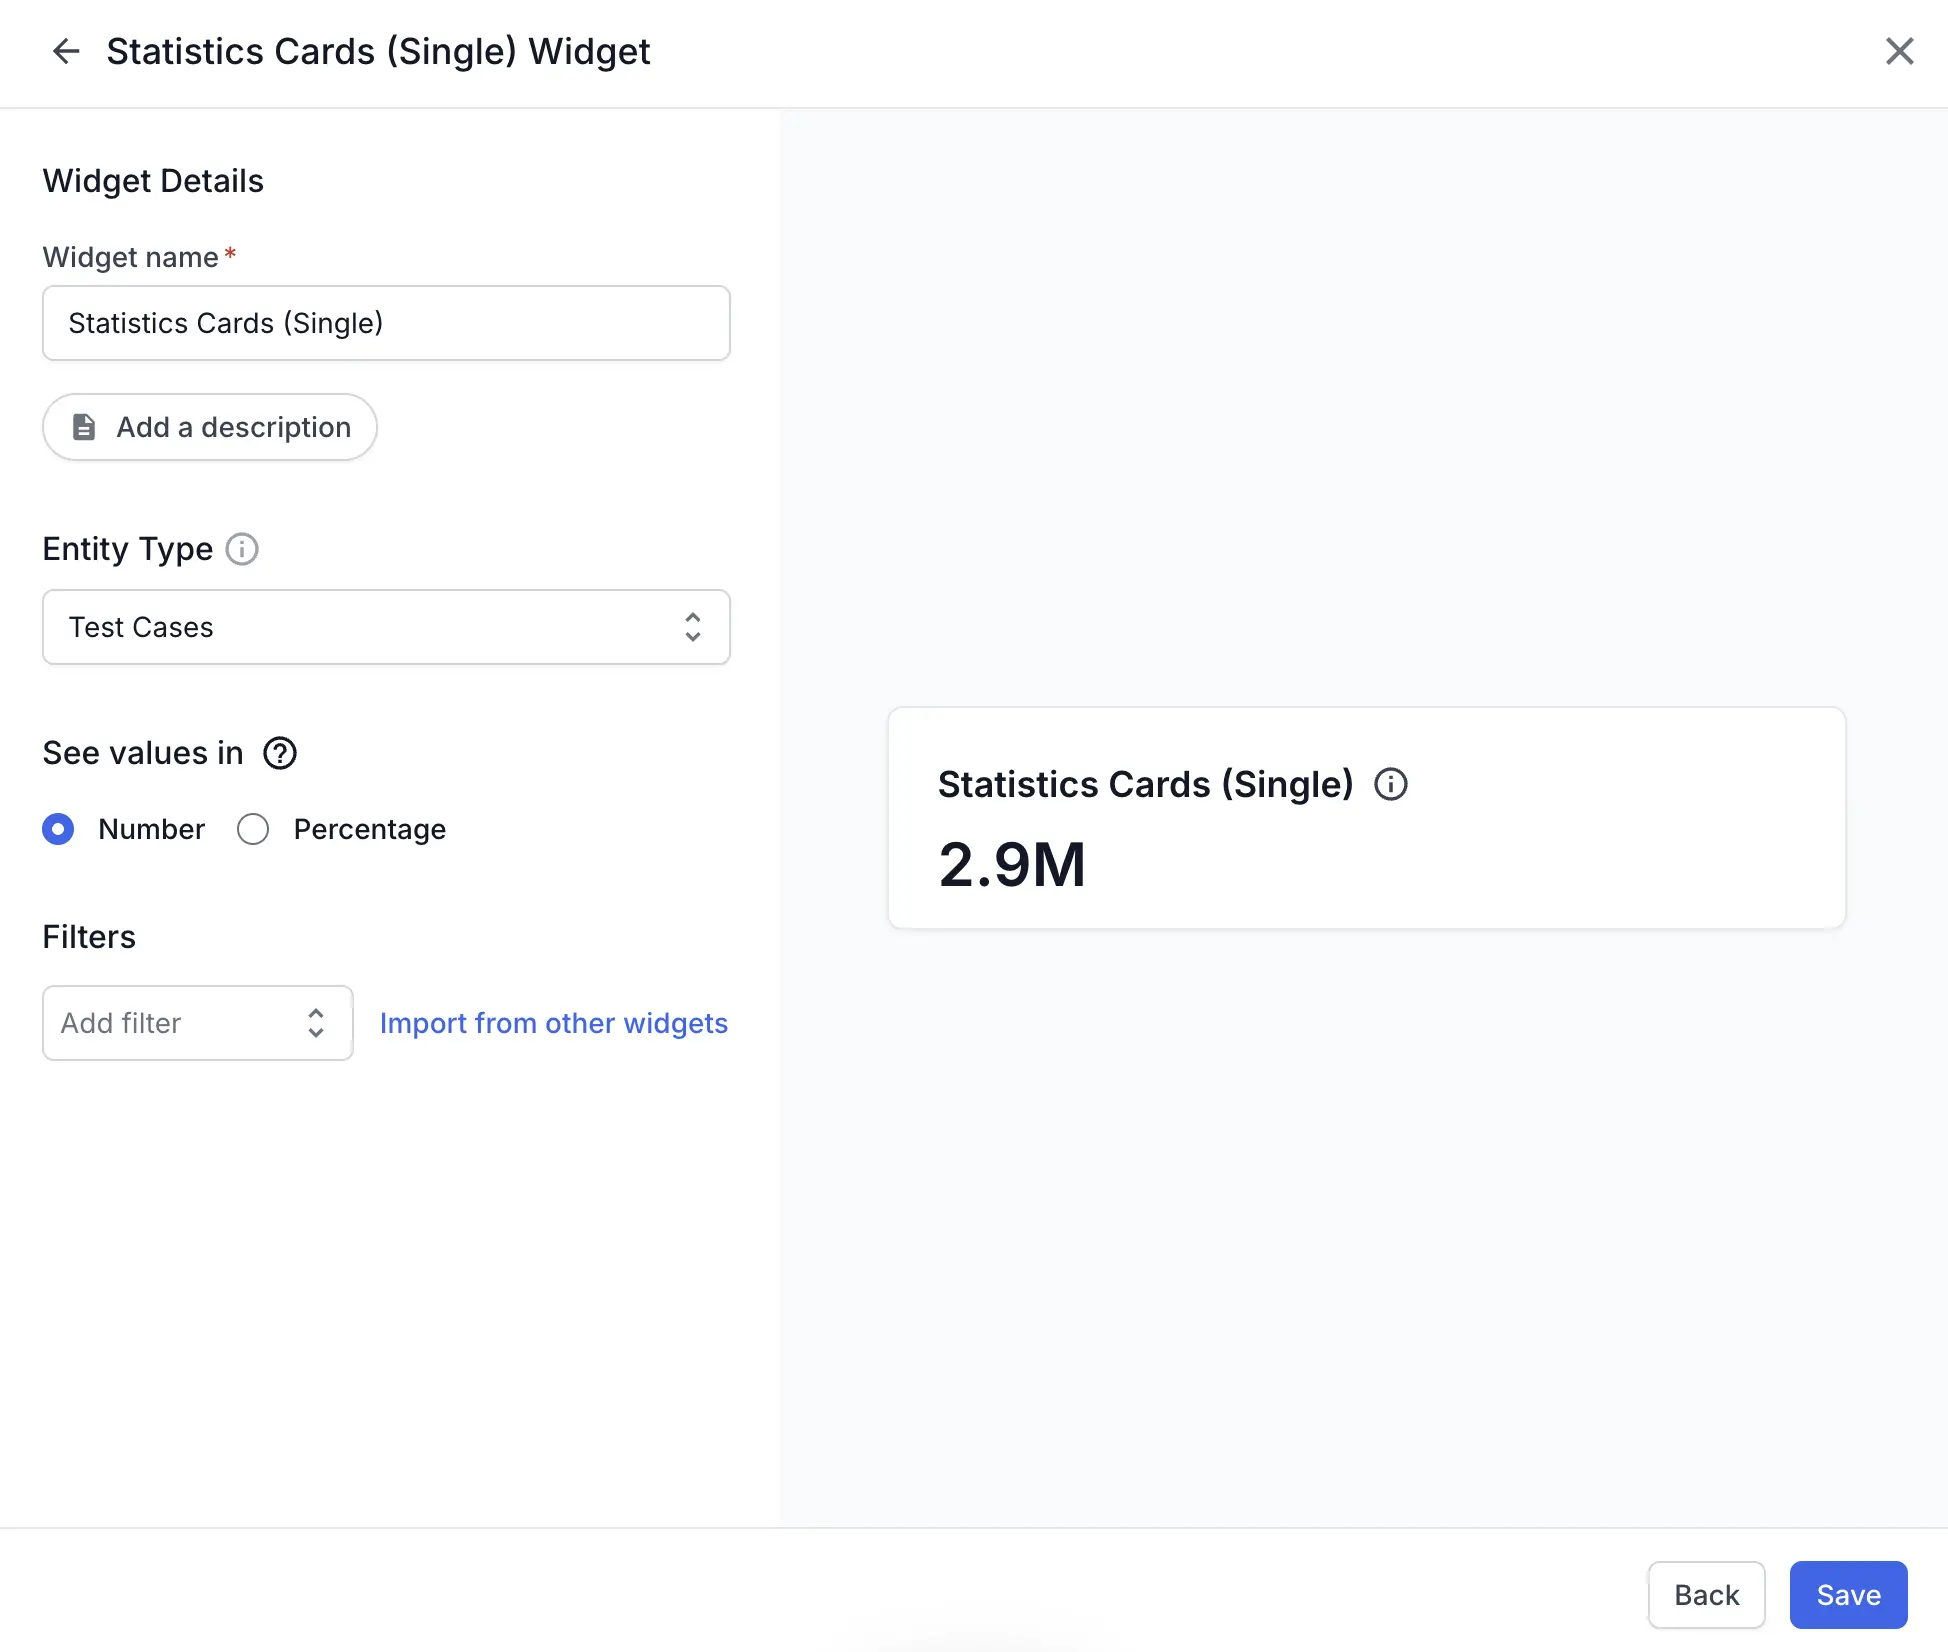
Summary of widget data and visualization
The card has no chart and no axis. It shows the widget name above one value. Name the card after the metric it reports, because that name is the only label a reader sees.
Select an Entity Type to set which records the card counts:
| Entity type | Description |
|---|---|
| Test Cases | Count test cases in your test case repository, across all time. This is the default. |
| Defects | Count defects logged within the timeframe selected on the dashboard. |
Switching Entity Type clears the filters you have already set, so pick the entity before you add filters.
Key metric information and visualization
See values in sets what the card shows. Select Number for a count. Select Percentage for a share.
The card abbreviates large counts, so 2,400,000 test cases read as 2.4M. A percentage shows two decimal places, such as 4.83%.
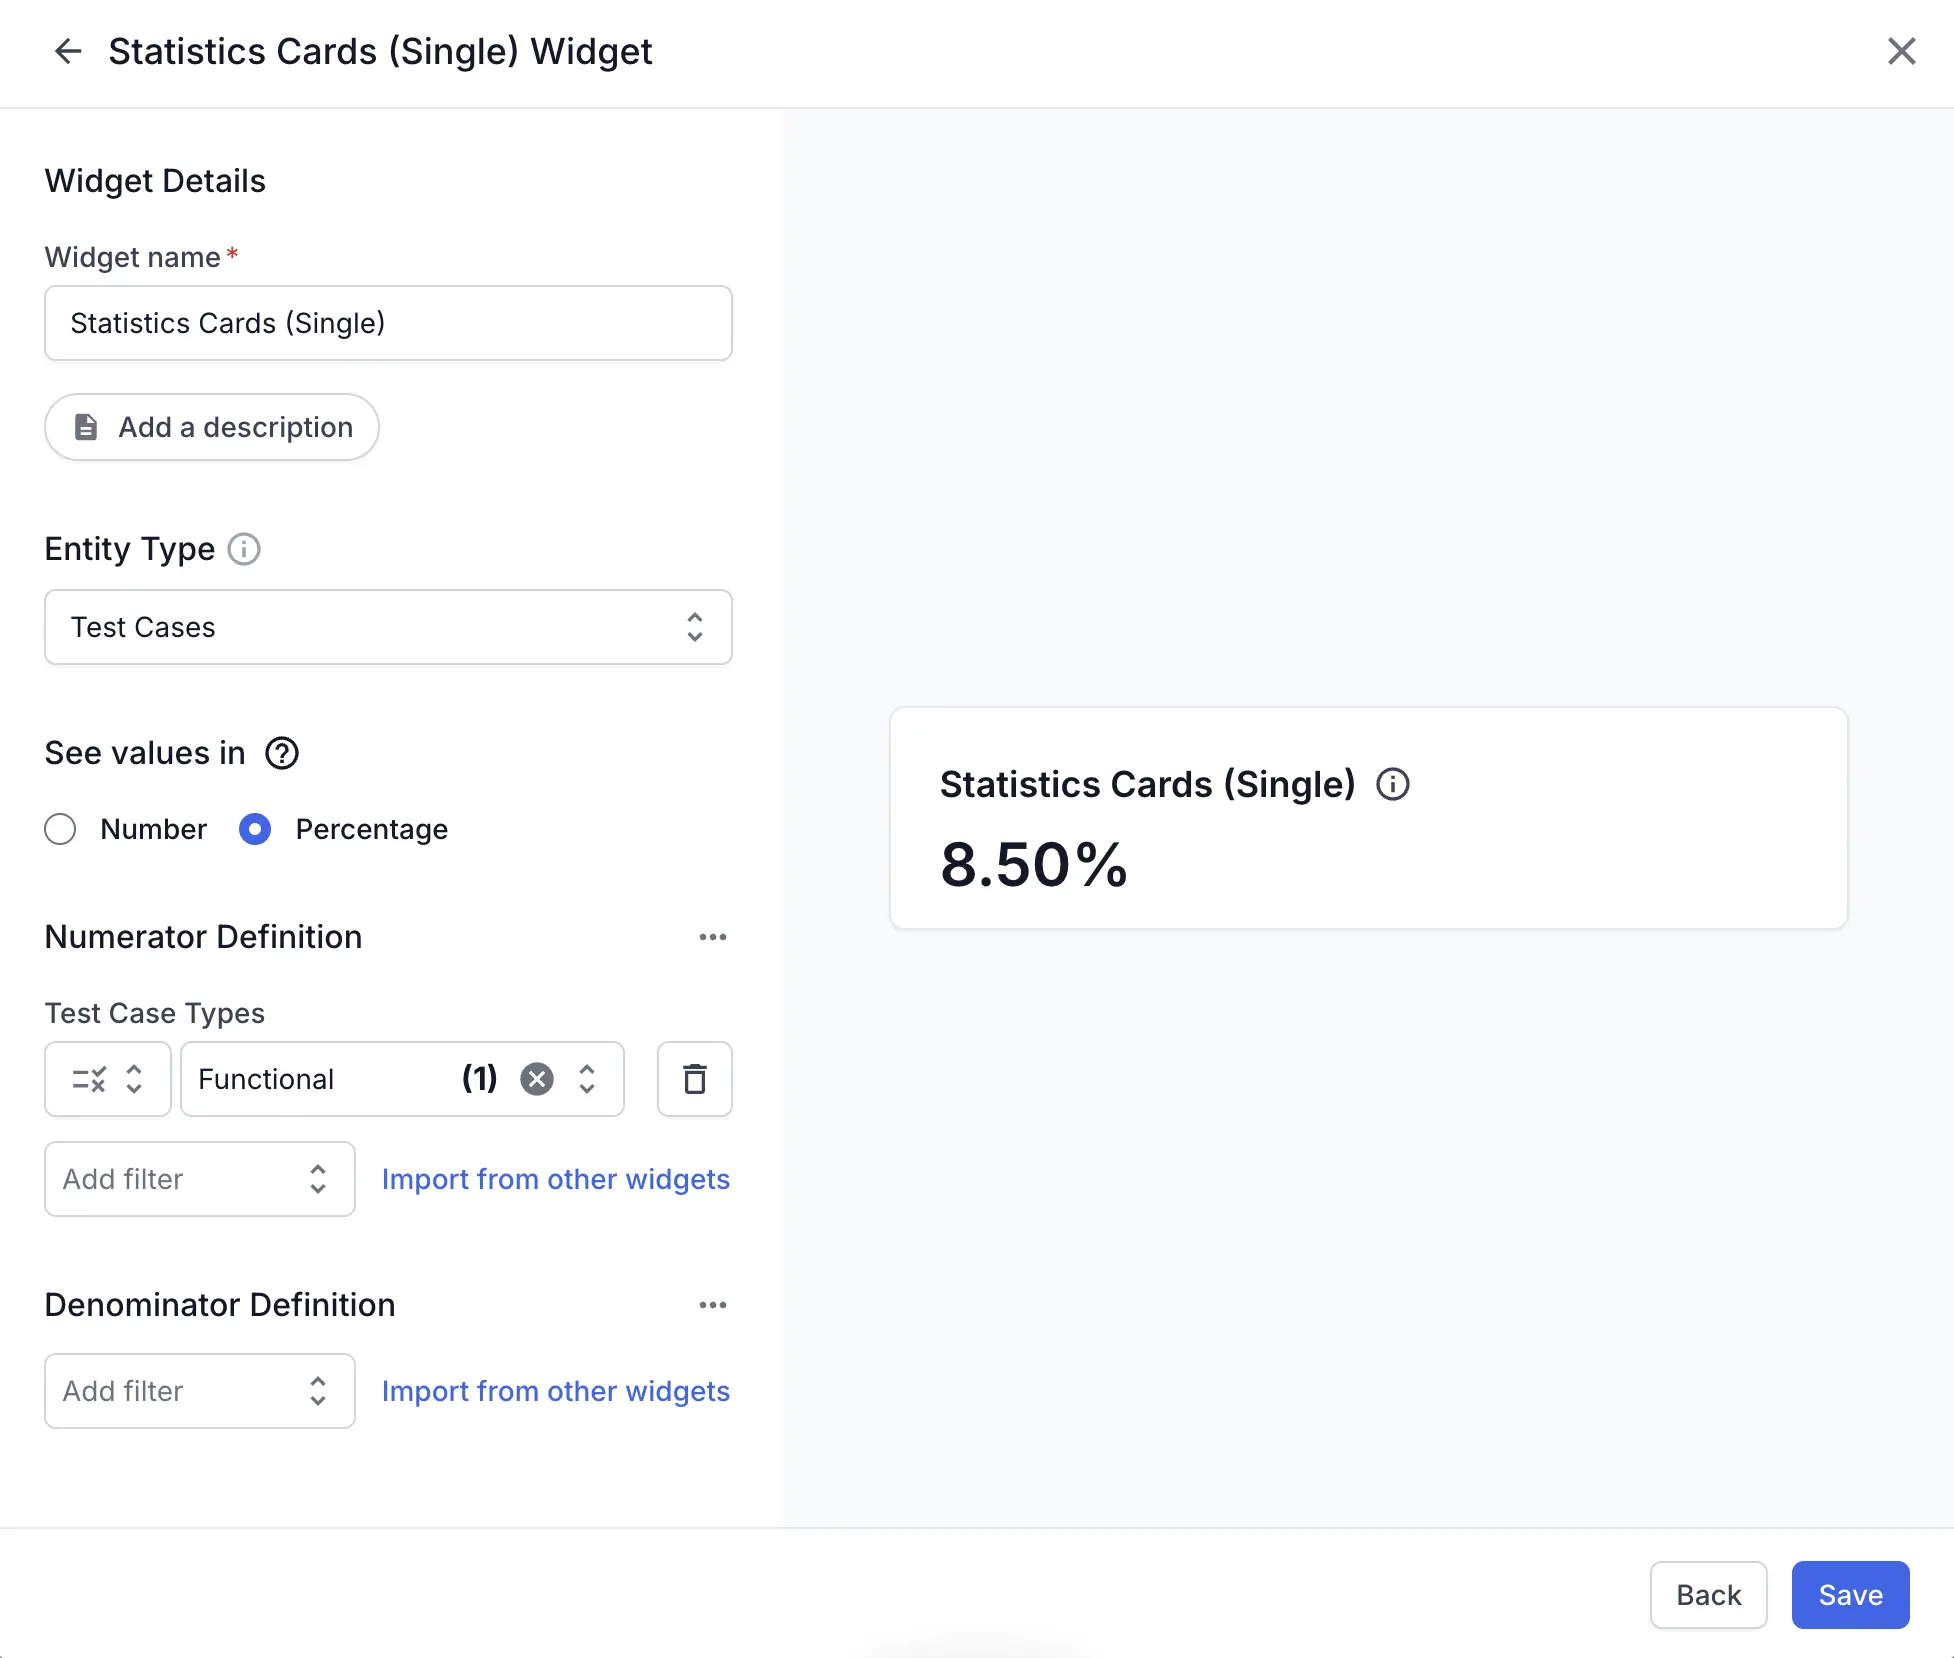
In Number mode, one Filters section decides which records the card counts. In Percentage mode, the widget replaces that section with Numerator Definition and Denominator Definition.
Add the widget
Follow these steps to add the card to a dashboard:
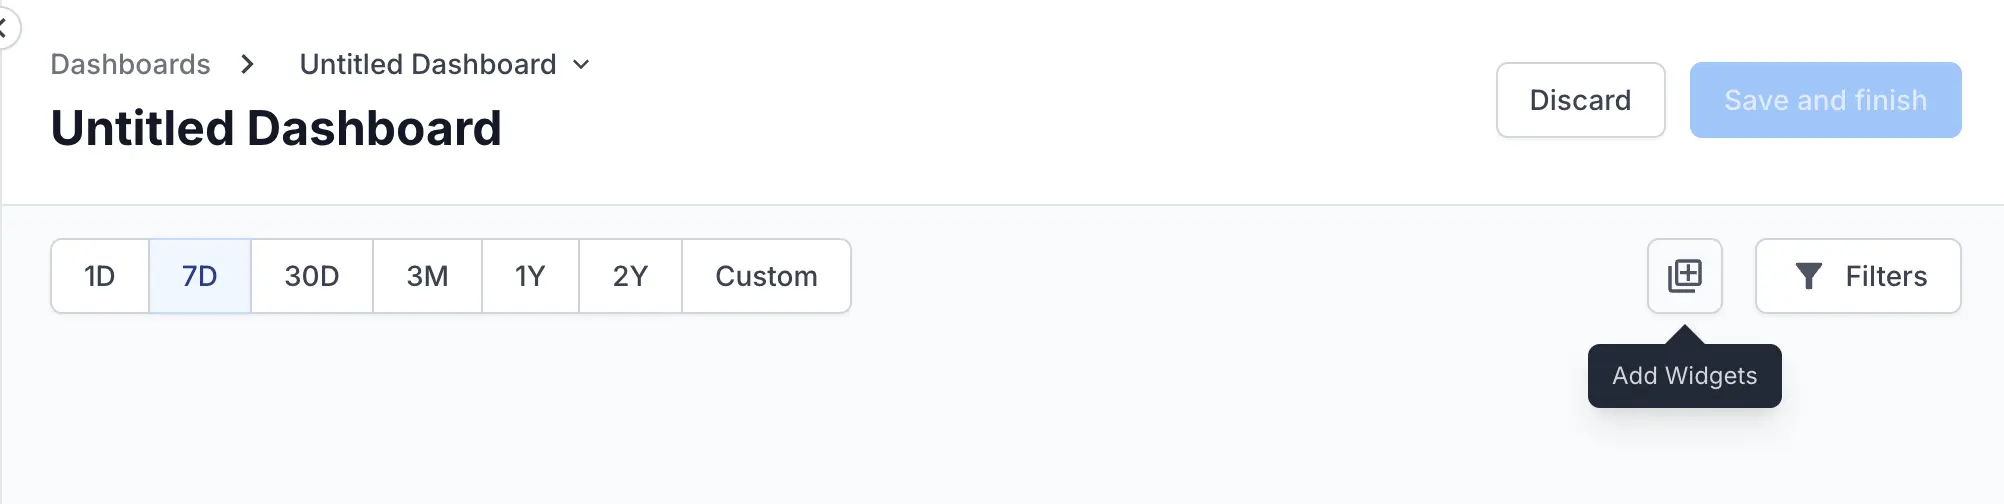
On your dashboard, click the Add Widgets icon, then select Statistics Cards (Single).
In Widget name, enter a name for the card.
To record what the card tracks, click Add a description and enter up to 200 characters.
In Entity Type, select Test Cases or Defects.
Under See values in, select Number or Percentage.
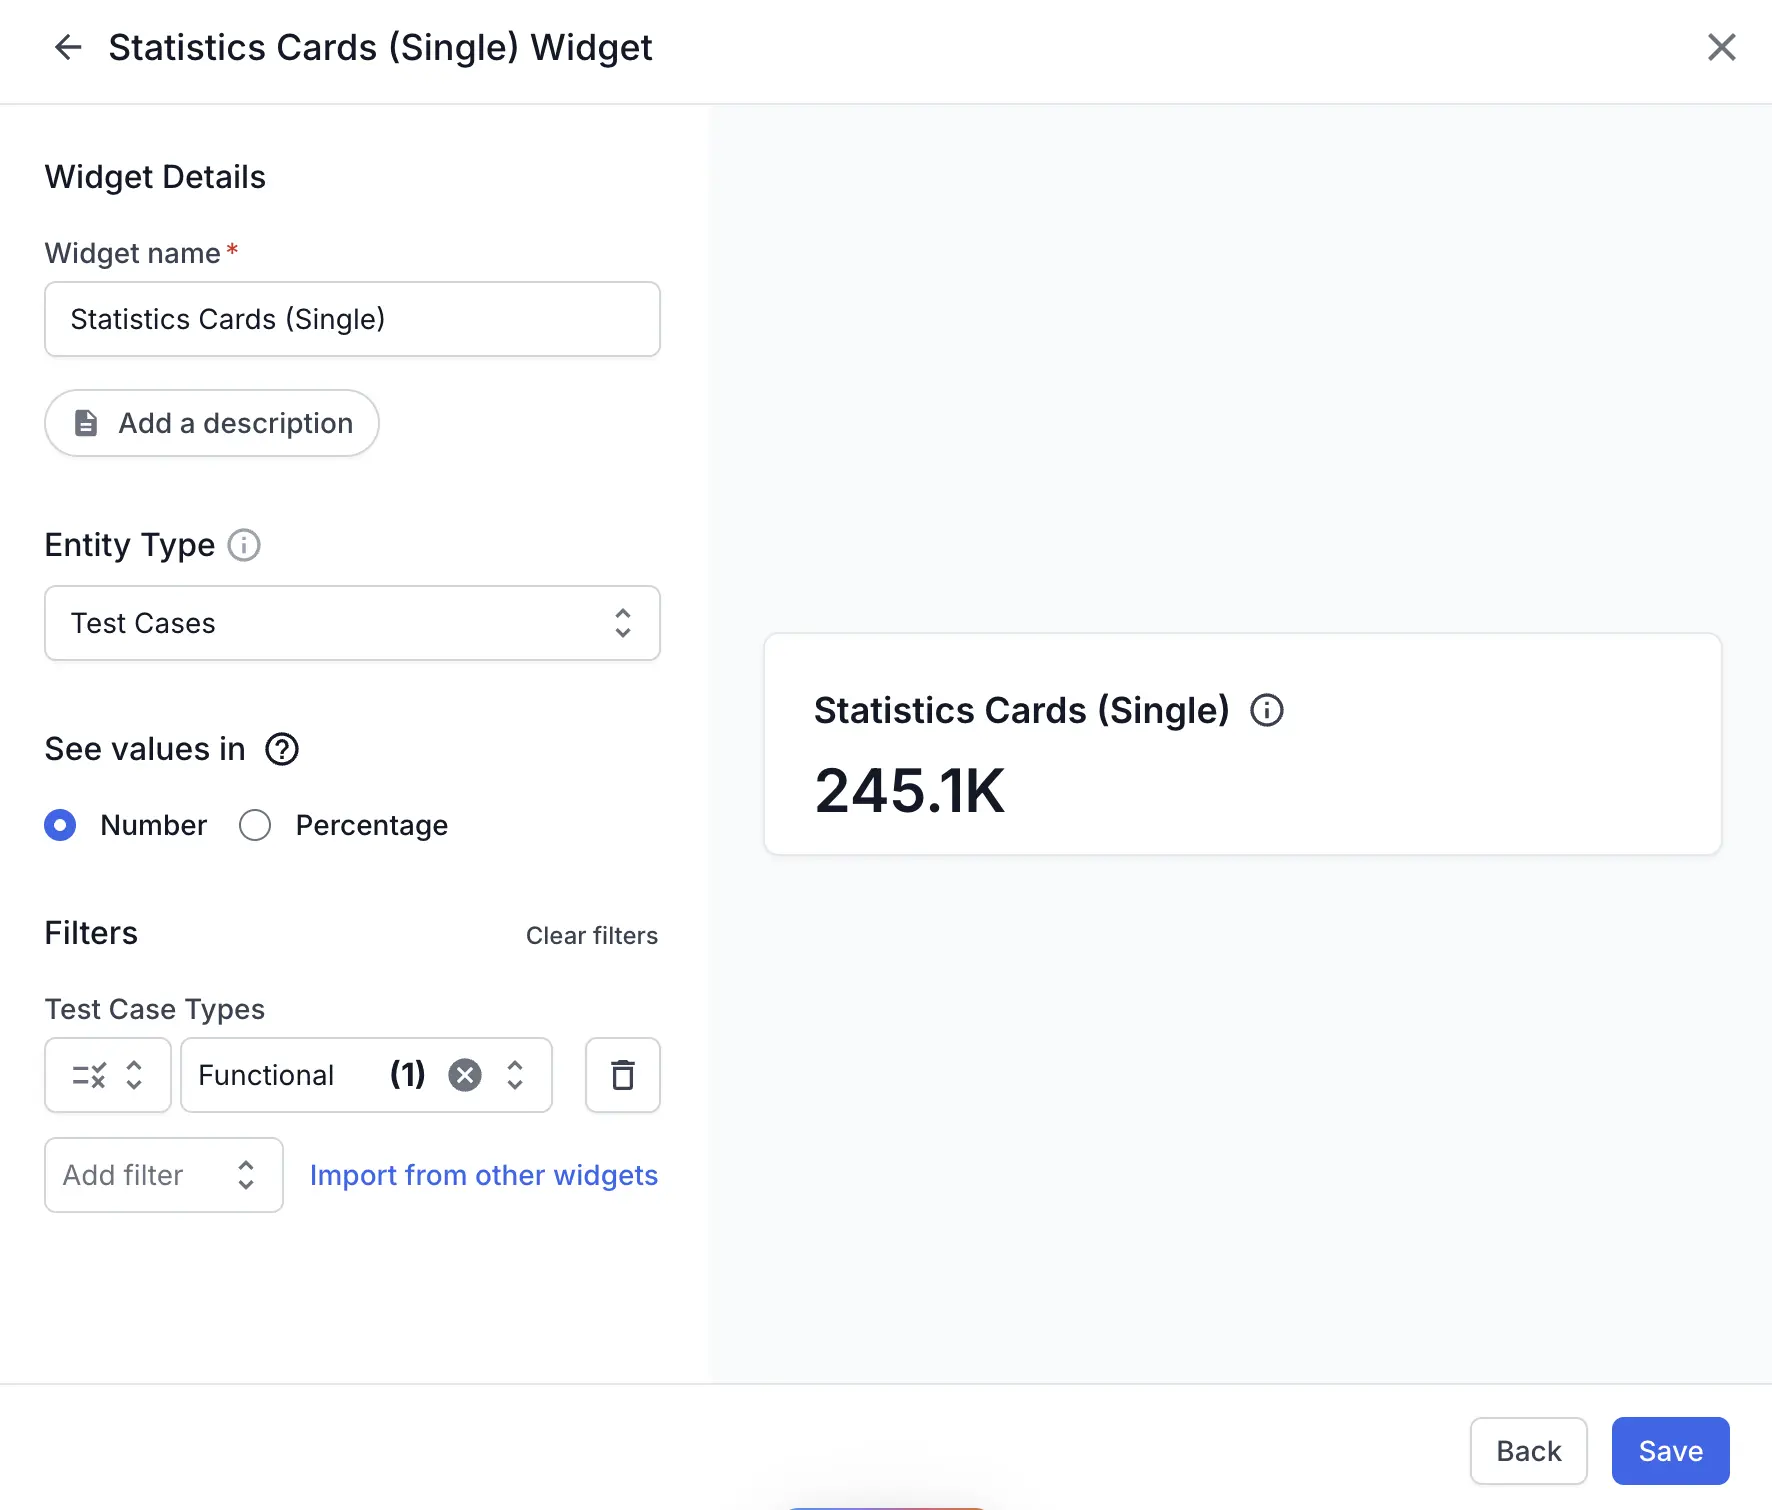
Add the filters you need, then click Save.
To keep the dashboard, click Save and finish.
Define a percentage
The card divides the numerator count by the denominator count. Each definition takes its own filters, so you choose both the group you measure and the base you measure it against.
Filters are scoped to the definition you add them under. A filter under Numerator Definition does not change the denominator.
A definition that holds no filters counts every record the Entity Type covers. So a card with no filters under either definition divides that total by itself and reads 100.00%. Add filters to at least one definition to get a meaningful share.
Automation coverage of one kind of test is the clearest example. Add Test Case Types and Automation Status to Numerator Definition, then add only Test Case Types to Denominator Definition. The card then reports how much of that one type is automated.
To define a percentage, follow these steps:
Under See values in, select Percentage.
Under Numerator Definition, click Add filter and select a filter.
Click the value box and select the values to match. Until you select a value, the filter does not change the count.
Repeat the previous two steps for each filter the numerator needs.
Under Denominator Definition, add the filters that define the base you compare against.
Click Save.
Reuse a filter set
Two shortcuts save you from building the same filter set twice:
- To copy one definition onto the other, click the more options (…) icon and select the copy action. Denominator Definition offers Copy from numerator, and Numerator Definition offers Copy from denominator. Each action stays unavailable until the other definition holds a filter.
- To pull a filter set from another widget on the same dashboard, click Import from other widgets in either definition. For the full steps, read import filters from other widgets.
Copy the denominator onto the numerator when the two definitions share most of their filters. You then add the one filter that narrows the numerator.
Available filters
Filters narrow which records the card counts. The filter list depends on the Entity Type you select.
When Entity Type is Test Cases, the following filters are available:
| Filter | Description |
|---|---|
| Projects | Count test cases from the projects you select. |
| Folders | Count test cases from the folders you select. |
| Test Case Types | Count test cases of the types you select, such as Functional or API. |
| Test Case Tags | Count test cases that carry the tags you select. |
| Test Case Priority | Count test cases at the priority levels you select. |
| Test Case State | Count test cases in the states you select. |
| Test Case Owner | Count test cases owned by the users you select. |
| Automation Status | Count test cases at the automation statuses you select. |
The list also includes the custom fields defined for your projects.
When Entity Type is Defects, the following filters are available:
| Filter | Description |
|---|---|
| Projects | Count defects from the projects you select. |
| Users | Count defects related to the users you select. |
| Assigned To | Count defects assigned to the users you select. |
| Build tags | Count defects from builds that carry the tags you select. |
| Unique Run Name | Count defects from the runs you name. |
| Run status | Count defects from runs at the statuses you select. |
| Branch | Count defects from runs on the code branches you select. |
| Test Case Status | Count defects whose linked test cases hold the statuses you select. |
| CI runs only | Select True to count only the defects from runs a CI pipeline triggered. |
To add a filter, click Add filter and select the filter you want. To remove a filter, click the Delete (trash) icon on its row. After you add the first filter, Clear filters appears beside the section name, and it removes every filter in that section.
Each filter row has a match operator to the left of the filter name. It shows Matches any one value (OR) by default. So when you select Functional and API under Test Case Types, the card counts test cases of either type.
Use cases and actionable insights
Use the card to spot issues in your test suite or defect backlog and act on them:
| Insight | Action |
|---|---|
Few test cases hold the Automated status. |
Pick the highest-value manual cases and add them to your automation backlog. |
| One test case type has a low automated share. | Automate the highest-risk cases of that type first. |
| Many defects stay open. | Assign owners and plan triage. |
| Most test cases sit at a single priority level. | Rebalance priorities so that the critical paths stand out from the rest. |
Interpreting test data
A single number moves for a small set of reasons. Use the following patterns to guide your analysis:
| Pattern | Cause | Action |
|---|---|---|
| The percentage is lower than you expect. | The denominator covers a wider set of records than the numerator. | Open both definitions and compare their filters. |
The percentage reads 100.00%. |
Neither definition holds a filter, so the card divides the entity total by itself. | Add the filters that define the numerator, and leave the denominator empty to compare against the entity total. |
| The count is lower than you expect. | A filter narrows the records more than you intended. | Remove one filter at a time until you find the one that is too narrow. |
| The count stays flat while your test suite grows. | A filter scopes the card to a set that is not growing. | Check the Projects and Folders filters against the folders you add cases to. |
| The defect count changes when you change the dashboard date range. | The Defects entity counts defects logged within the selected timeframe. | No action needed. This is expected behavior. |
Next steps
Continue with the following pages:
- Read the Test Management statistics cards widget page to add the same card there. The defect filters differ.
- Track how many unique test cases reach your suites with the unique test cases widget.
- Reuse a filter set across widgets with import filters from other widgets.
- Review everything you can add to a dashboard in the list of widgets in custom dashboards.
We're sorry to hear that. Please share your feedback so we can do better
Contact our Support team for immediate help while we work on improving our docs.
We're continuously improving our docs. We'd love to know what you liked
We're sorry to hear that. Please share your feedback so we can do better
Contact our Support team for immediate help while we work on improving our docs.
We're continuously improving our docs. We'd love to know what you liked
Thank you for your valuable feedback!