
 Join our Discord
Test execution distribution widget
See how test execution work is spread across the users who ran your automated tests, and narrow the chart with build, platform, and repository filters.
The Test Execution Distribution widget draws one horizontal bar per user. Each bar is that user’s execution count, split into segments by test status. Because the widget groups executions by the user who ran them, and not by the date they ran, it answers who did the work. Use it to find uneven load. The chart also shows who owns the failures.
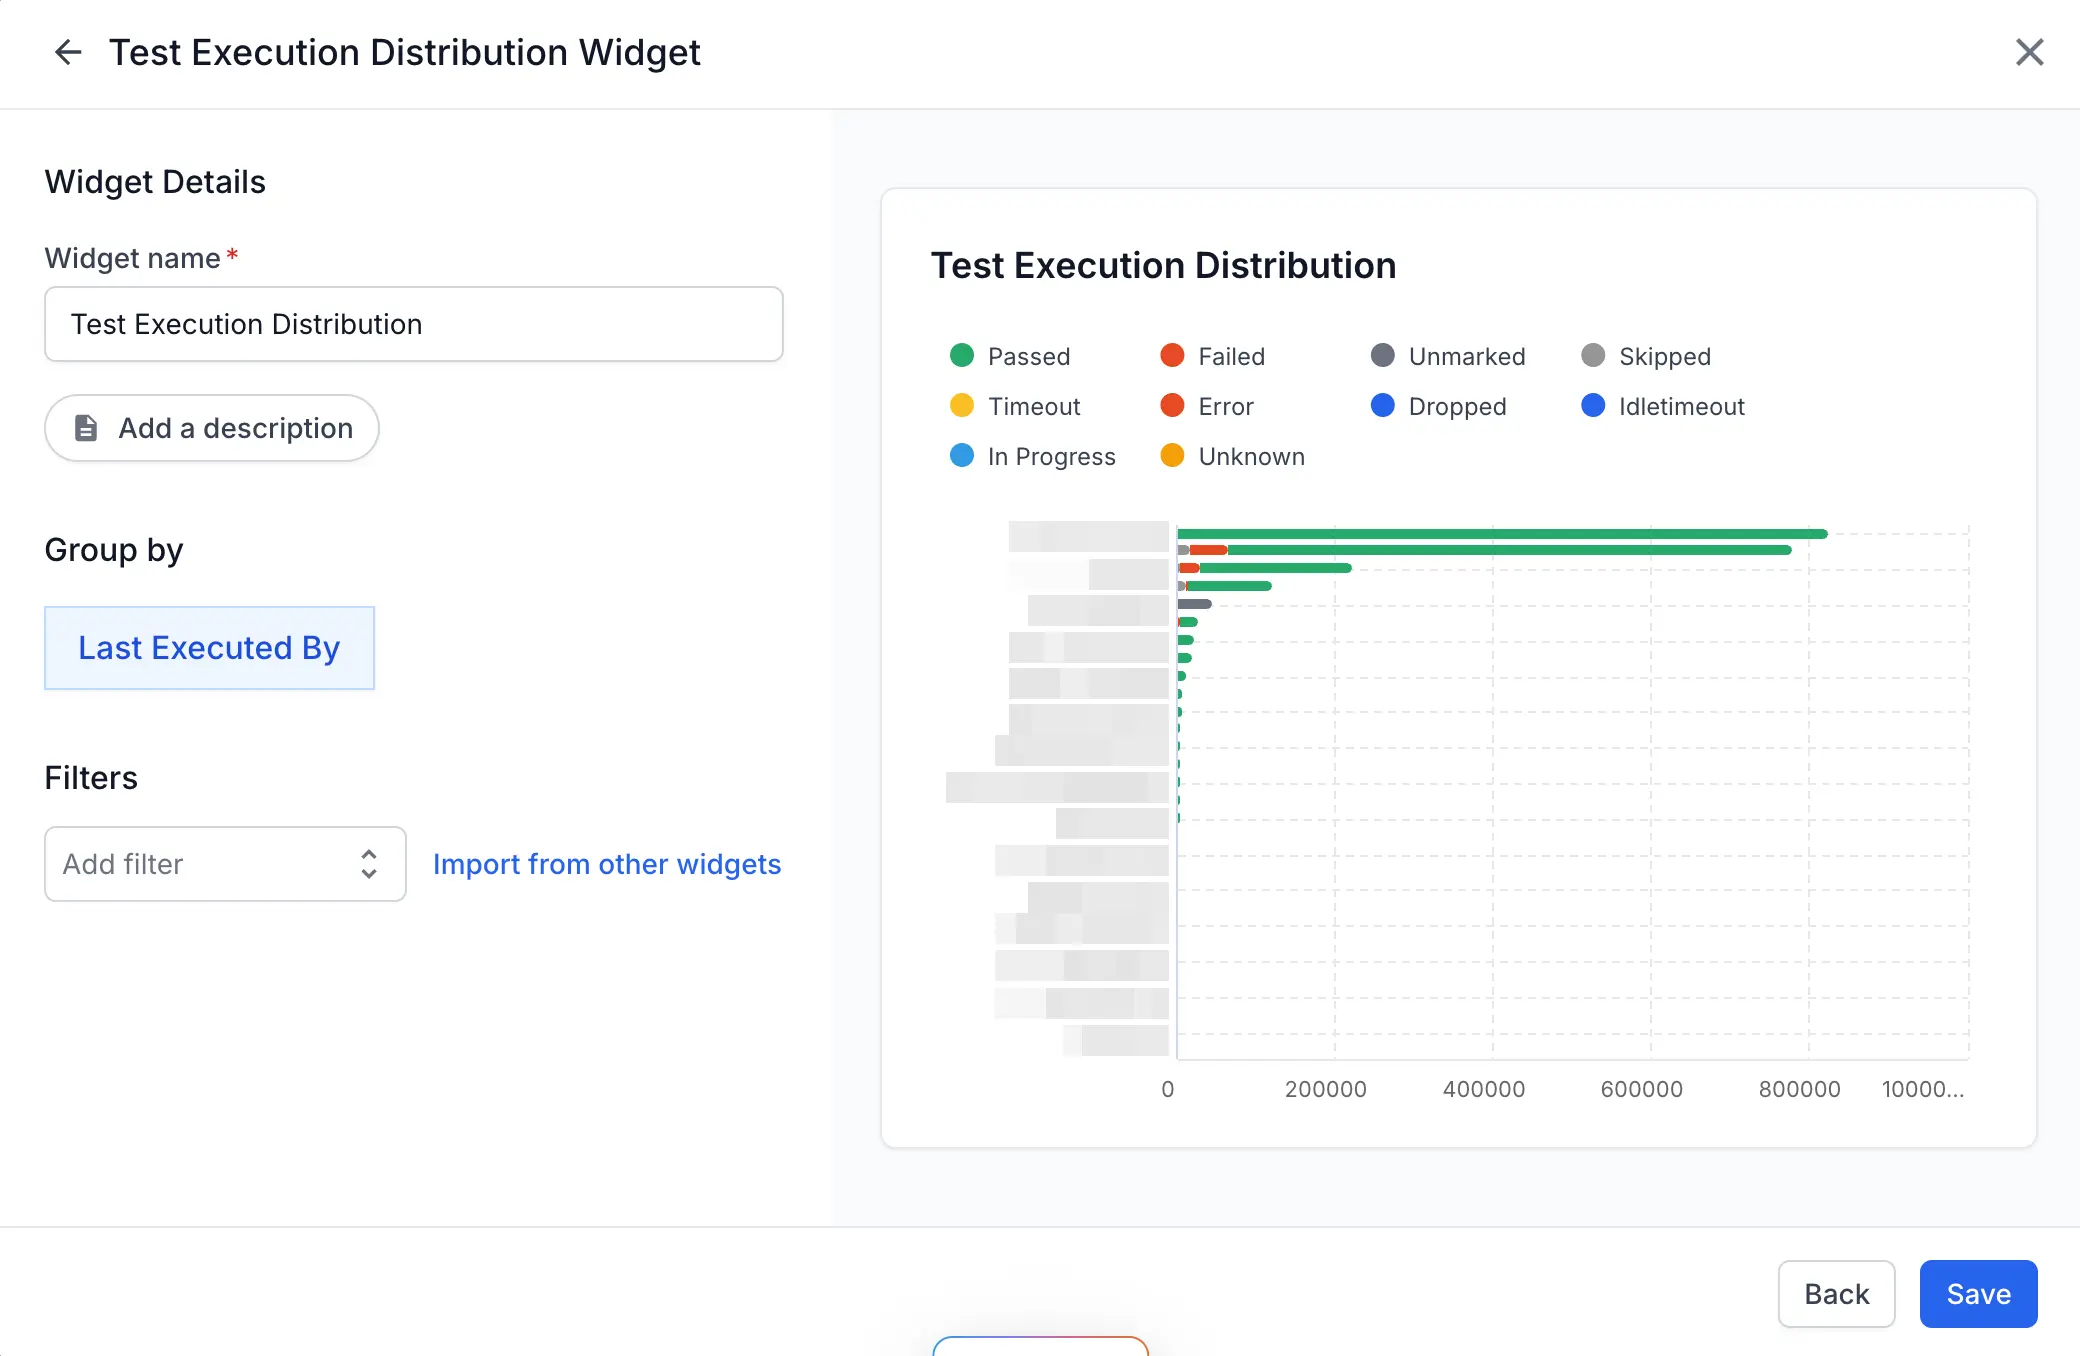
Summary of widget data and visualization
The widget plots users on the vertical axis and execution counts on the horizontal axis. Rows are sorted from the highest execution count down to the lowest. The busiest user is always first.
Test Reporting & Analytics reports automated runs only. Every execution the widget counts comes from an automated test, grouped by the user who ran that test most recently.
Key metric information and visualization
The following table describes each element of the chart:
| Element | Details |
|---|---|
| Row label | The user who last ran the tests in that row. |
| Bar length | That user’s total execution count across the executions that match your filters. |
| Bar segment | One test status. The segment length is the count of executions in that status. |
| Horizontal axis | The execution count. |
| Tooltip | Hover over a segment to read the user, the status, and the execution count. |
Group by
Group by has one option, Last Executed By. Each row represents the user who last set the result of the test. The user who triggered the run is the last executor of every test in it. When someone adds a manual result to a test, that user becomes its last executor. A service account that triggers runs appears under its own name.
Available filters
Filters narrow which executions the widget counts. No filter applies until you add one.
To add a filter, click Add filter and select the filter you want. To reuse the filters already set on another widget, click Import from other widgets. After you add the first filter, Clear filters appears next to Filters. Click it to remove every filter.
| Filter | Details |
|---|---|
| Projects | Count executions from the projects you select. |
| Unique Run Name | Count executions from the runs you name. |
| Build tags | Count executions from builds that carry the tags you select. |
| Test tags | Count executions of tests that carry the tags you select. |
| Last executed by | Count executions whose test result the users you select updated last. One widget holds up to 30 users. |
| Hooks Visibility | Set which hooks count toward the test count. See visibility of hooks and tests. |
| Host names | Count executions from the hosts you select. |
| Folder names | Count executions from the folders you select in your test repository. Use it to identify modules. |
| Include muted tests | Set whether muted tests count toward the chart. |
| Include re-run attempts | Set whether re-run attempts count toward the chart. |
| CI runs only | Count executions from runs a CI pipeline triggered. |
| Branch | Count executions from the code branches you select. |
| Device | Count executions from the devices you select. |
| OS | Count executions from the operating systems you select. |
| Browser | Count executions from the browsers you select. |
Some filters carry a match operator to the left of the filter name. Use it to set how multiple values combine. Matches any one value (OR) is the default, and it counts an execution that matches any value you selected. When a filter also offers Matches all values (AND), that option counts only the executions that match every value you selected.
Some filters also cap how many values you can select. When a cap applies, the widget states it under the filter as soon as you add the filter.
Drill down for more information
The chart answers who ran the tests. To find which projects those executions sit in, open the breakdown for one segment:
- Hover over a bar segment.
- Select View breakdown in the tooltip.
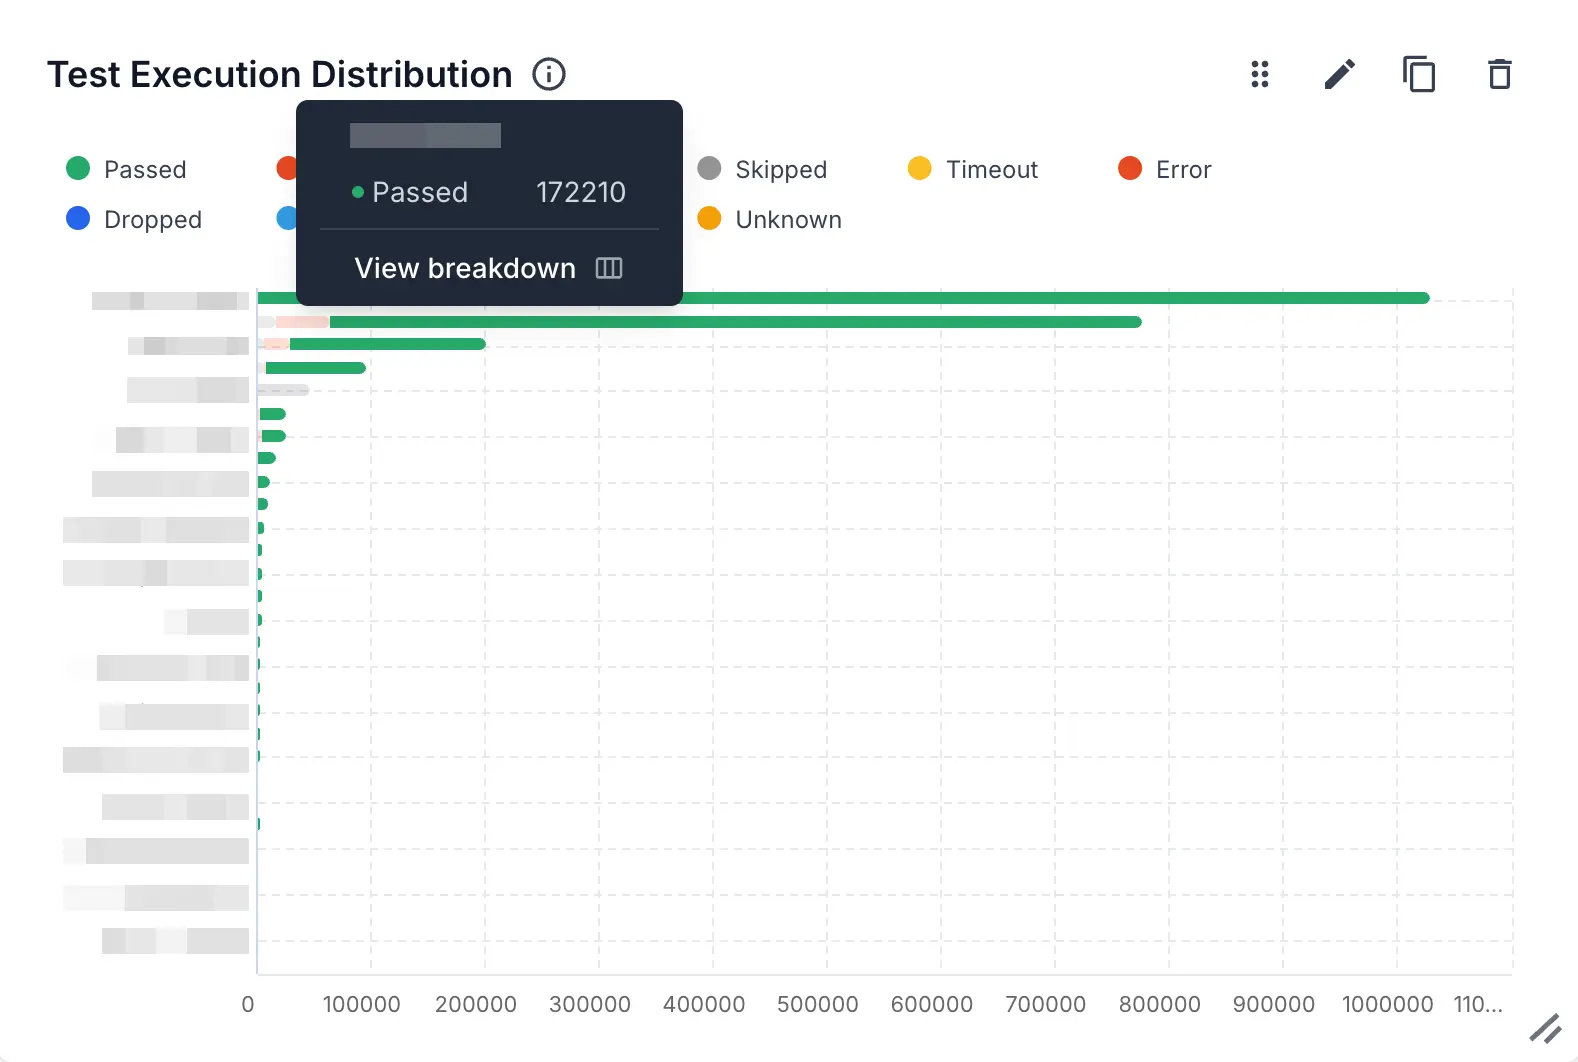
The Test Execution Distribution Drilldown panel opens a project-wise breakdown of the segment you selected. The top of the panel repeats the user, the execution count, and the status. Under Projects, each project shows its matching test count.
Interpreting test data
The shape of the chart tells you as much as the numbers. Use the following patterns to guide your analysis:
| Pattern | Cause | Action |
|---|---|---|
| One bar much longer than the rest. | A single user or CI account triggers most of the runs. | Add the CI runs only filter to separate pipeline runs from runs people started. |
A long Timeout or Idletimeout segment. |
Tests are stalling rather than failing on an assertion. | Review the session logs for those tests, then check the wait and timeout settings. |
| The chart is empty after you add a filter. | No execution matches every filter you applied. | Remove the filters one at a time to find the one that excludes everything. |
Next steps
- Track the total scale of automation activity with the Test Executions widget.
- Compare status trends over time with the Tests by Status widget.
- Review everything you can add to a dashboard in the list of widgets in custom dashboards.
We're sorry to hear that. Please share your feedback so we can do better
Contact our Support team for immediate help while we work on improving our docs.
We're continuously improving our docs. We'd love to know what you liked
We're sorry to hear that. Please share your feedback so we can do better
Contact our Support team for immediate help while we work on improving our docs.
We're continuously improving our docs. We'd love to know what you liked
Thank you for your valuable feedback!