View app profiling for Flutter integration tests
View app profiling for your Flutter test executions on BrowserStack App Automate. Test your apps on a real device cloud.
An app’s performance is considered poor if it responds slowly, freezes, crashes, or consumes excessive power.
To prevent performance issues, you need to regularly monitor your app for inefficiencies with the CPU, memory, battery, and network. App profiling offers graphical charts for monitoring app performance and resource utilization.
You can access these charts in the App Profiling tab on the test session details page of the App Automate dashboard.
- The default app performance (v1) is supported for Android only and enabled by default.
- The detailed app performance (v2) is available only under BrowserStack’s Device Cloud Pro, Device Cloud Pro + Visual Cloud, and Enterprise Pro plans. It supports both Android (versions 10 to 16 Beta) and iOS (versions 14–18 and 26 Beta). For more details check out our pricing page.
- If the test case meets v2’s requirements, the system by default displays v2. Else, it falls back to the default app performance (v1).
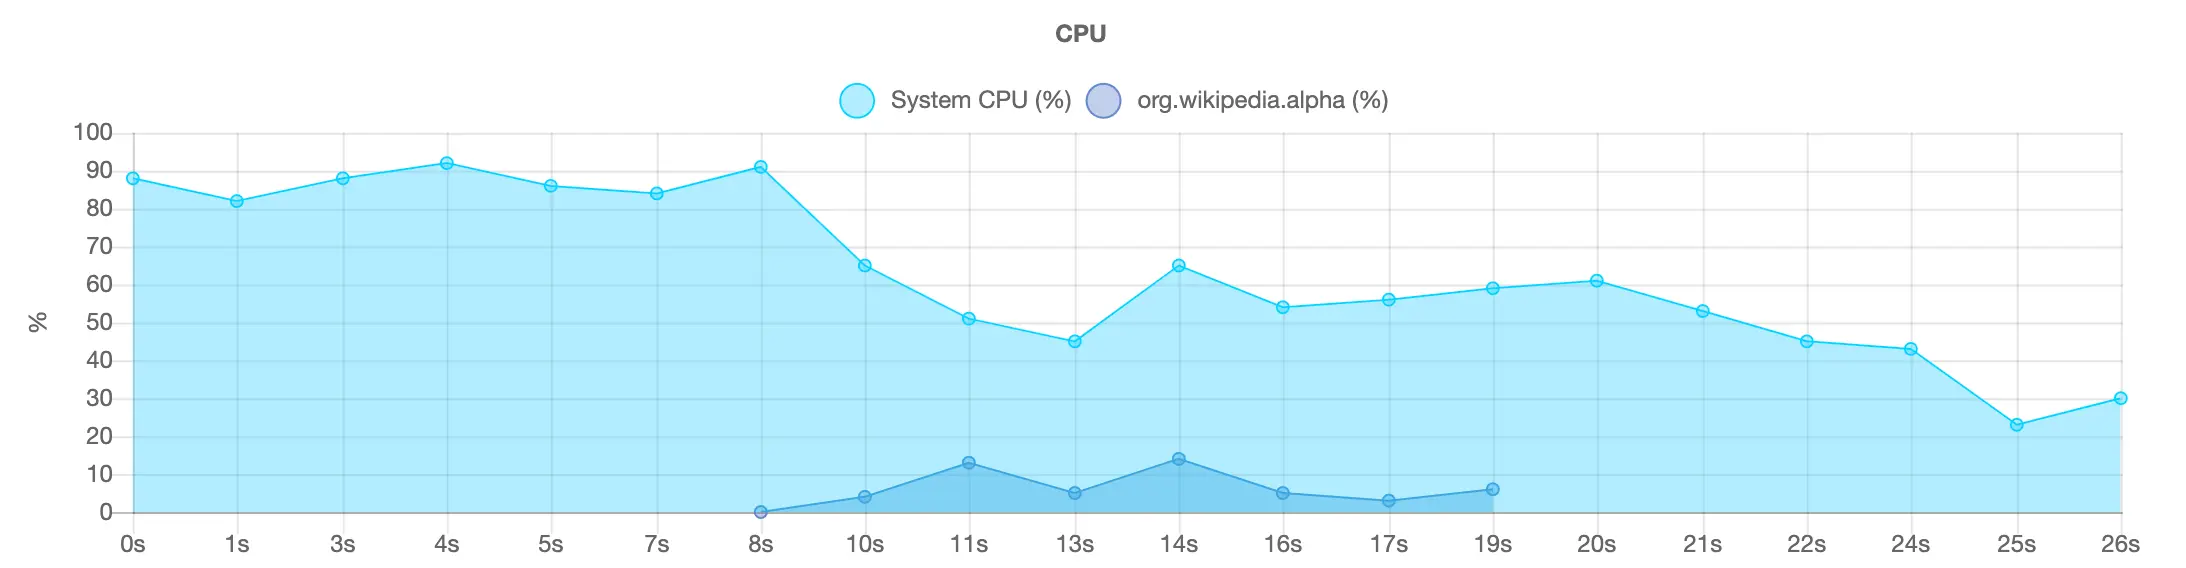
CPU usage
Optimize your app’s CPU usage to achieve a faster and smoother user experience while conserving device battery life. Monitor your app’s CPU usage (%) on real devices.
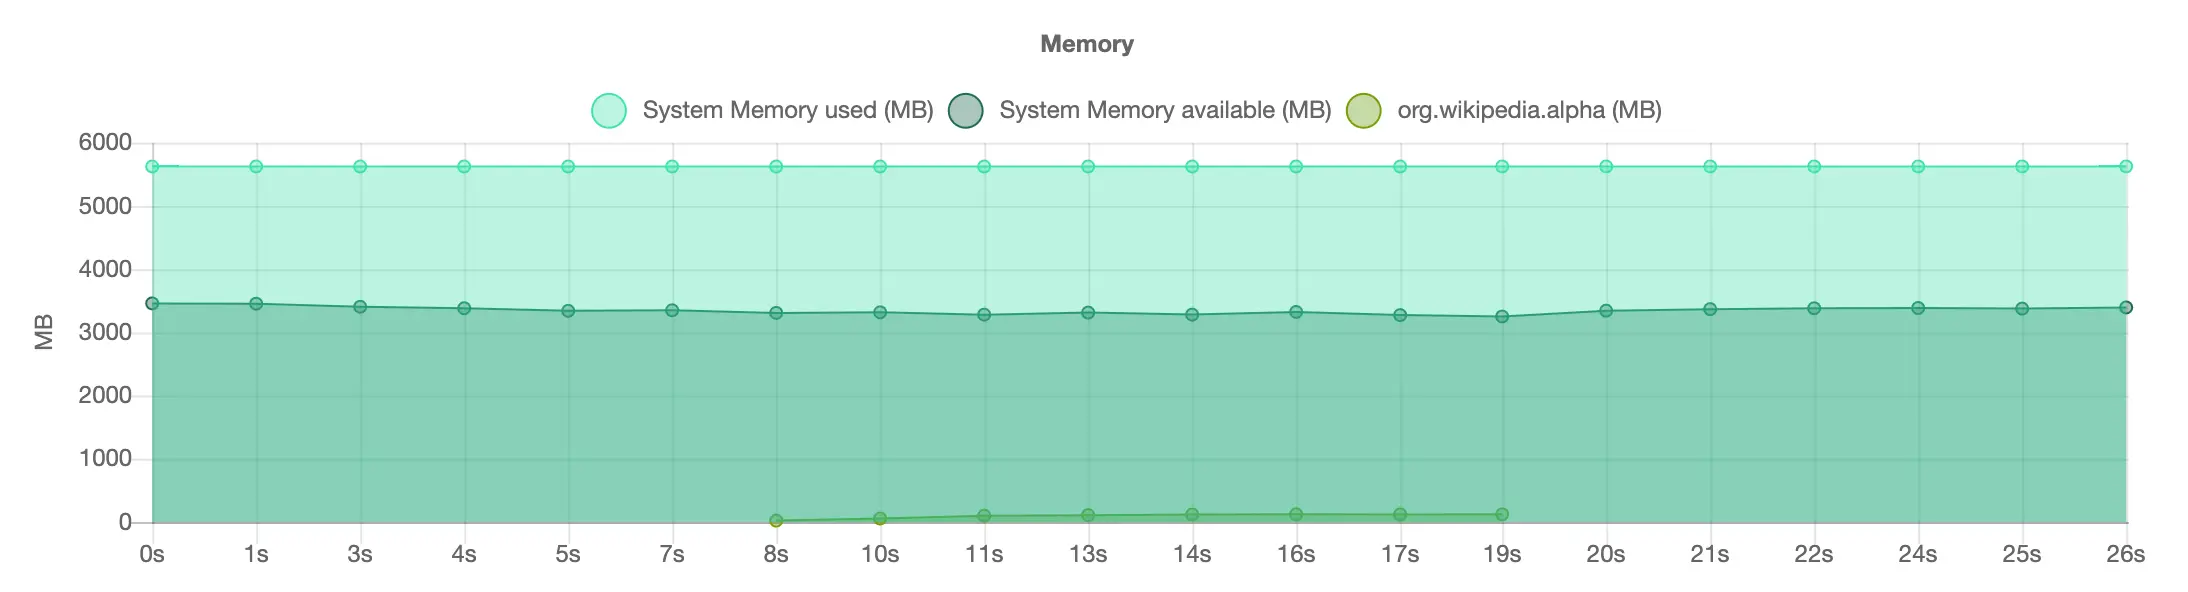
Memory consumption
Identify memory leaks or excessive memory usage that could lead to app freezes or crashes. Track your app’s memory usage (MB) on a real device.
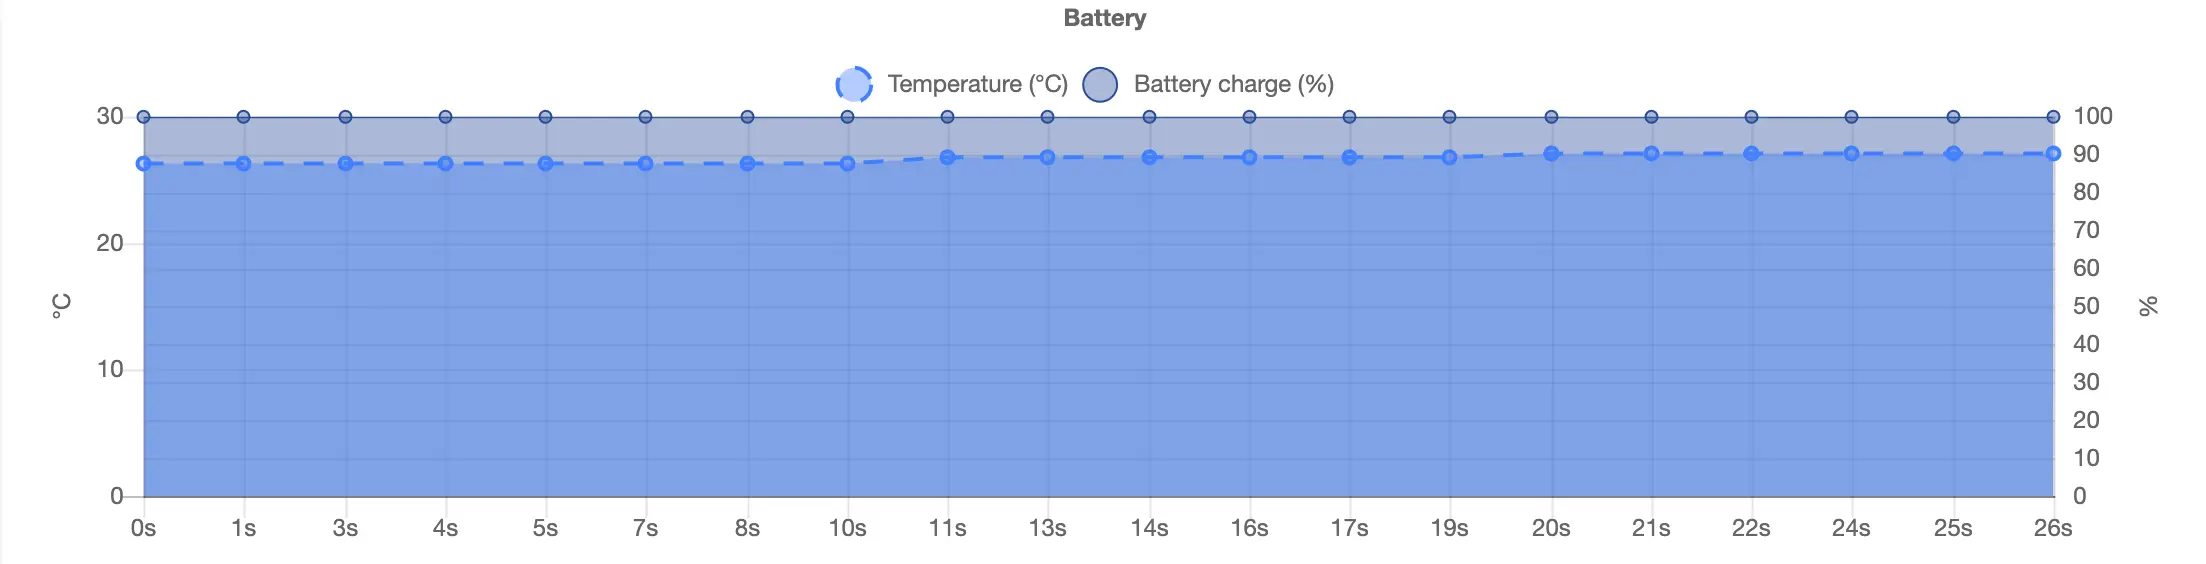
Battery usage
Monitor the impact caused by your app on battery temperature (°C) and battery charge (%) on a real device.
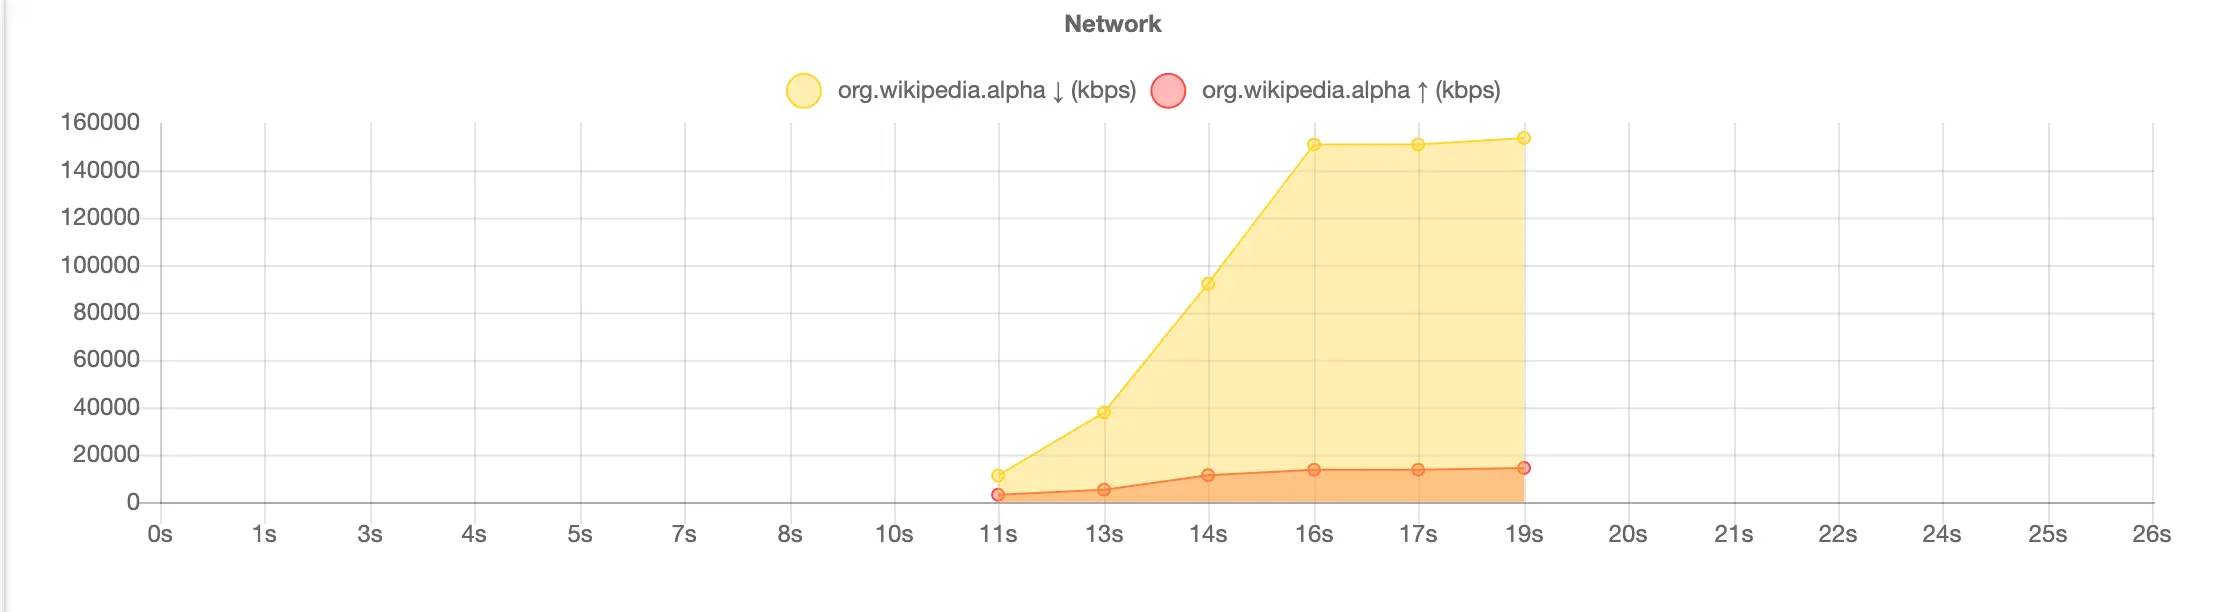
Network usage
Observe network activity on a timeline, displaying data sent and received. Analyze how and when your app transfers data to optimize underlying code. Track your app’s network usage (kbps) on a real device.
Related topics
-
Manage your uploaded apps using our REST API.
-
Use the recent apps API endpoint to list your recently uploaded apps.
-
Delete your uploaded apps using the delete app API endpoint.
We're sorry to hear that. Please share your feedback so we can do better
Contact our Support team for immediate help while we work on improving our docs.
We're continuously improving our docs. We'd love to know what you liked
We're sorry to hear that. Please share your feedback so we can do better
Contact our Support team for immediate help while we work on improving our docs.
We're continuously improving our docs. We'd love to know what you liked
Thank you for your valuable feedback!