Integrate your Test Suite with BrowserStack
Learn how to integrate your existing Cypress tests with BrowserStack Automate.
You are currently viewing the documentation for the old dashboard. We’ve revamped the dashboard experience. Explore the new dashboard now!
This guide assumes that you are integrating an existing Cypress project. If you don’t have access to an existing Cypress project, you can try running your first test using the Cypress Kitchen Sink web app.
This guide covers:
Prerequisites
Before you integrate your test with BrowserStack, ensure that the following prerequisites are met:
- BrowserStack Username and Access key, which you can find in your account settings. If you have not created an account yet, you can sign up for a Free Trial or purchase a plan.
- Node.js installed on your machine.
- Git installed on your machine.
- NPM installed on your machine.
- An existing Cypress project that you want to integrate with BrowserStack.
Run your test
To run your Cypress test, perform the following steps:
Step 1: Install the BrowserStack CLI. The BrowserStack - Cypress CLI is a command-line tool that is used to enable communication between Cypress and BrowserStack. Use the npm command to install the BrowserStack - Cypress CLI as follows:
# Install the BrowserStack Cypress CLI
npm install -g browserstack-cypress-cli
Step 2: Generate and configure the browserstack.json file. The browserstack.json file contains configurations, such as BrowserStack credentials, capabilities, etc, required for running the tests.
Navigate to your project’s root directory and run the following command to generate the browserstack.json configuration file.
# Create a sample configuration file for configurations and capabilities
browserstack-cypress init
After you create the browserstack.json file, add or modify the mandatory configurations required to run the Cypress tests, as shown in the following sample. These configurations include your BrowserStack credentials, the Cypress configuration file, browser-device combinations, and the number of parallels.
| Object | key | Value |
|---|---|---|
auth |
username |
BrowserStack username from the Automate dashboard |
auth |
access_key |
BrowserStack access key from the Automate dashboard |
browsers |
browser |
List of browsers where Cypress tests must be run |
os |
OS name to use for running tests | |
versions |
OS version to use for running tests | |
run_settings |
cypress_config_file |
Path to the cypress.json file for your project |
cypress_version |
Cypress version to be used for running tests | |
project_name |
Project name for the Cypress project | |
build_name |
Build name for Cypress build | |
parallels |
Number of parallels you want to use to run the tests. The maximum limit depends on your BrowserStack plan. |
The following sample browserstack.json file configuration can be used to create your own configuration:
      {
      "auth": {
        "username": "YOUR_USERNAME",
        "access_key": "YOUR_ACCESS_KEY"
      },
      "browsers": [{
          "browser": "chrome",
          "os": "Windows 10",
          "versions": ["latest", "latest - 1"]
        },
        {
          "browser": "firefox",
          "os": "OS X Mojave",
          "versions": ["latest", "latest - 1"]
        },
        {
          "browser": "edge",
          "os": "OS X Catalina",
          "versions": ["latest"]
        }
      ],
      "run_settings": {
        "cypress_config_file": "./cypress.config.js",
        // For Cypress v9 or lower using the following configuration
        // "cypress_config_file": "./cypress.json",
        "cypress_version": "12.3",
        "project_name": "Cypress sample build",
        "build_name": "Build no. 1",
        "parallels": "5"
      }
    }
Apart from the mandatory configurations, you can also add other configurations, such as setting dependencies, organizing tests, etc. Check out the sections under the CONFIGURE TEST RUNS header in the left navigation pane of our documentation site to learn more.
Step 3: Run the test using the following command:
browserstack-cypress run --sync
Access the test results
After you run your test, visit the Automate dashboard to view your test results as follows:
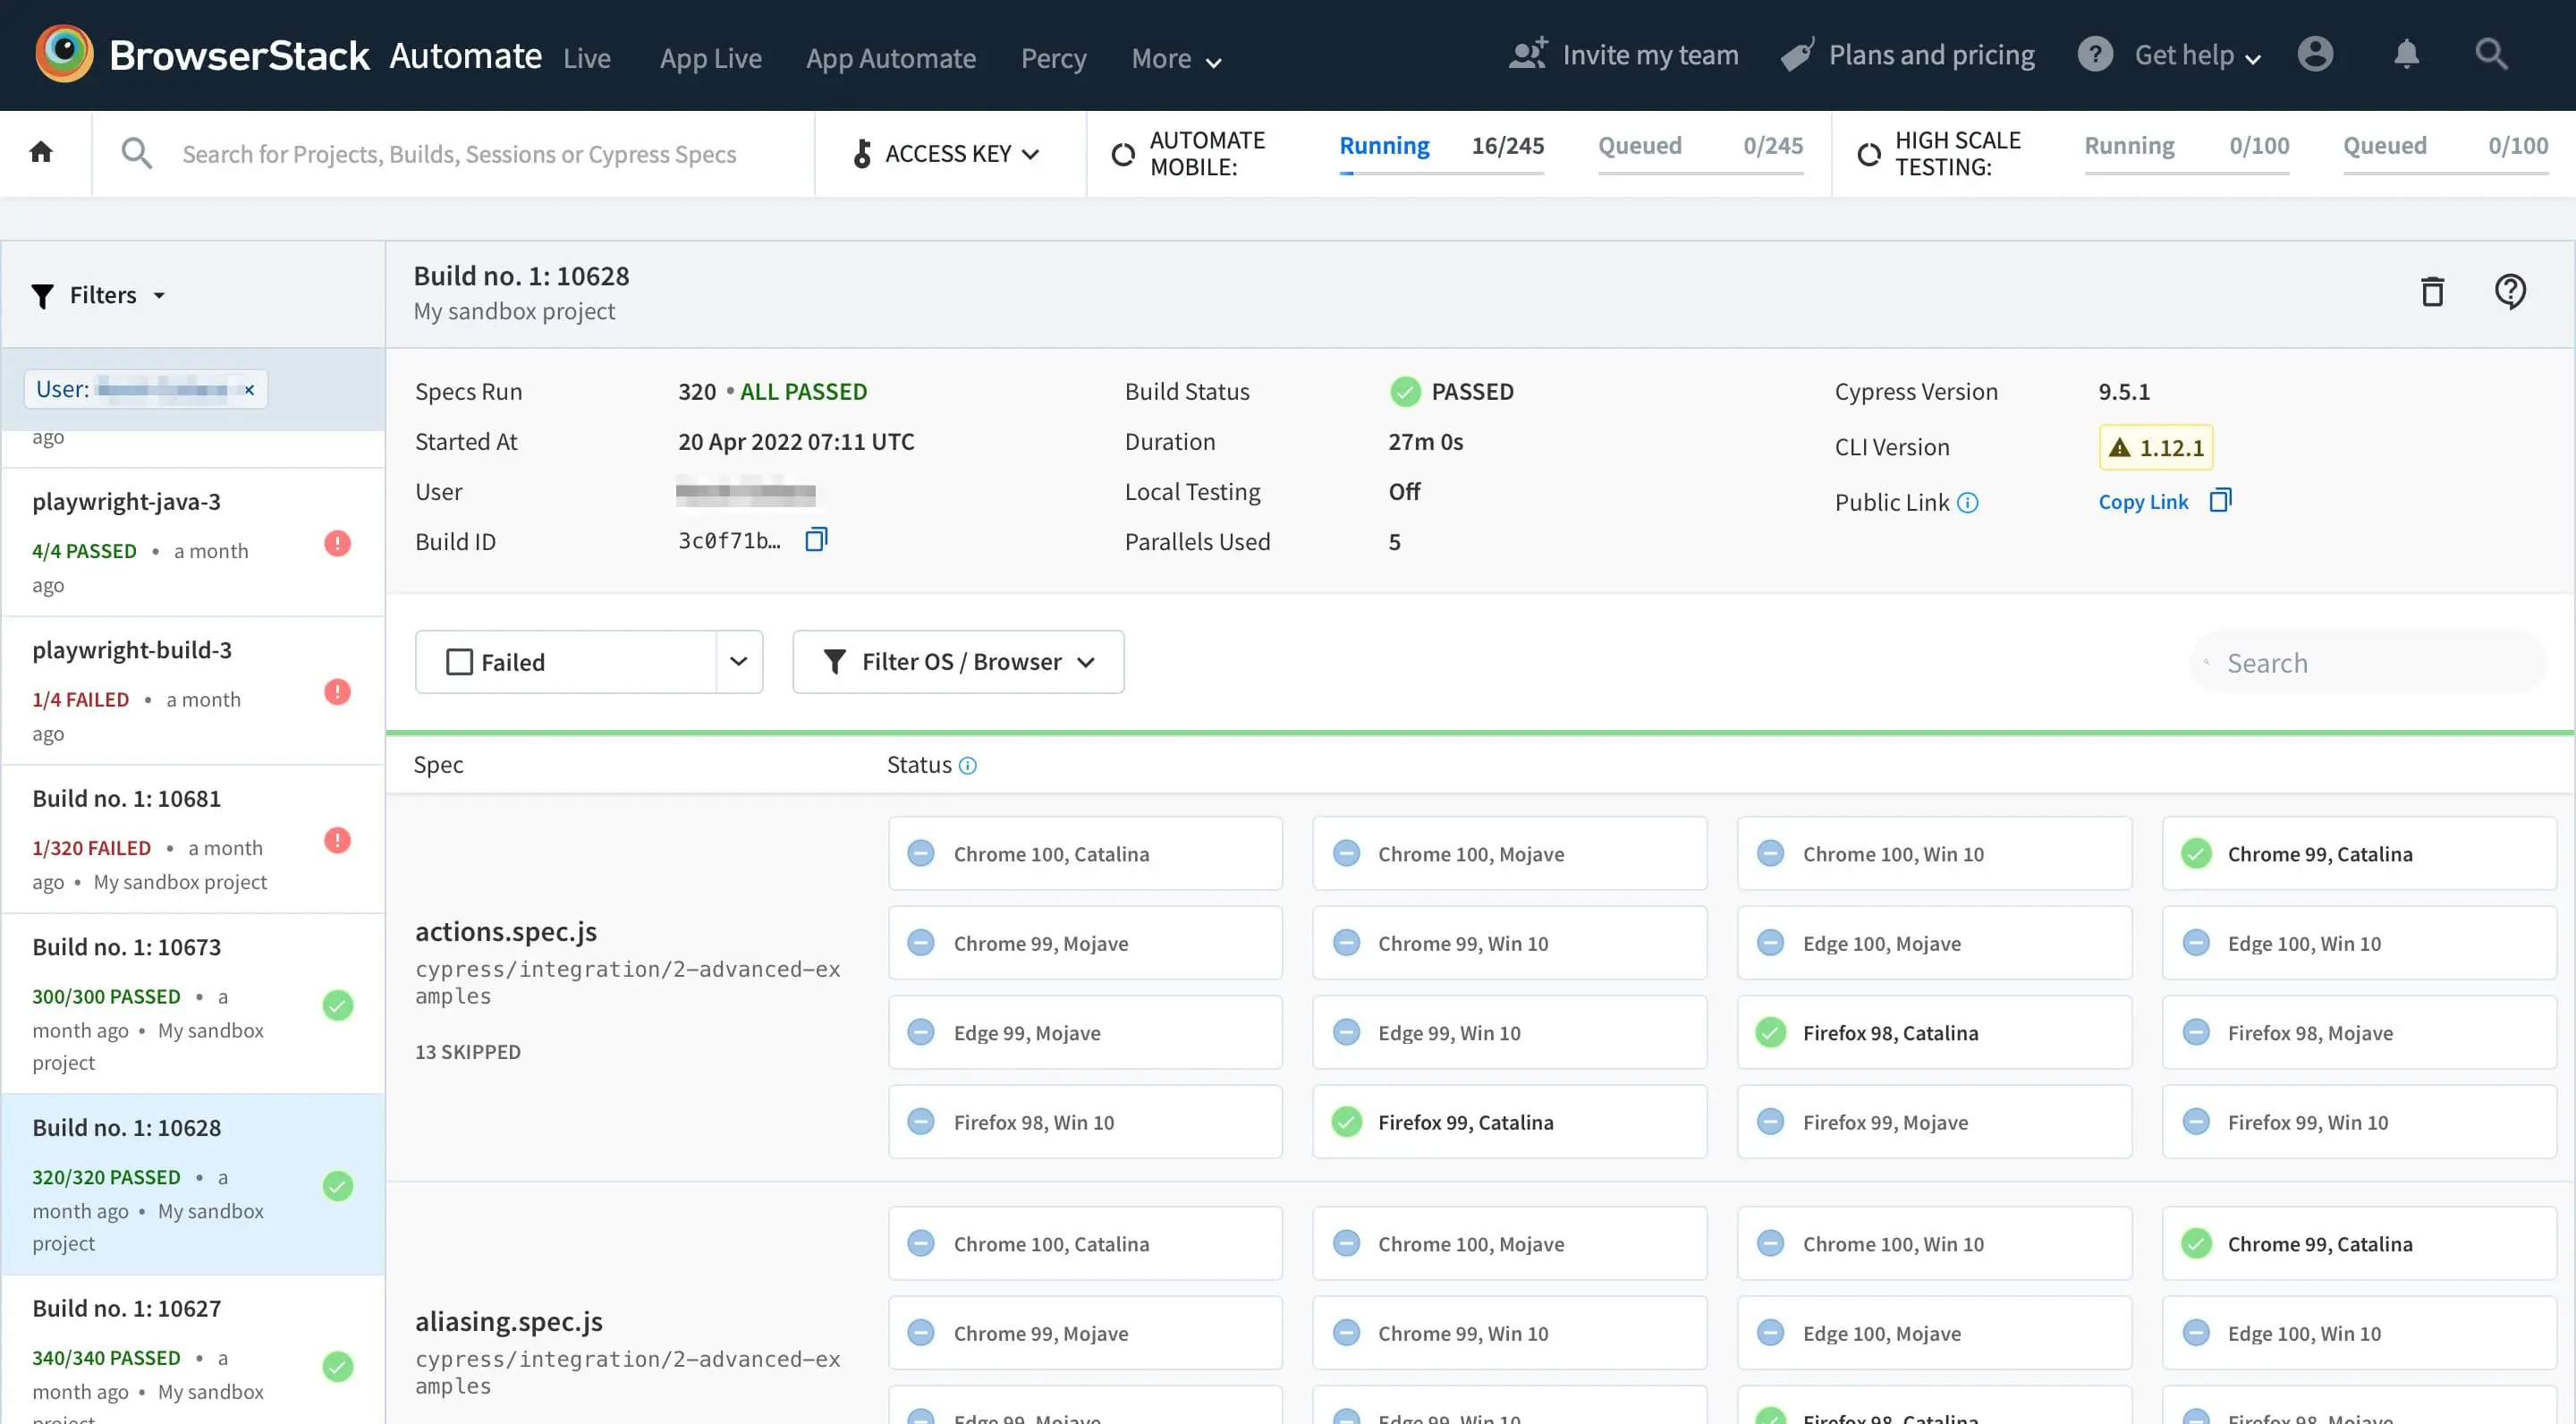
All tests in each spec file are grouped by browser combination. When you click a browser combination, you see a detailed view with video logs, text logs, and more. If any test fails, relevant screenshots appear in the Screenshots tab.
On your command-line tool, you see completed tests and their current status as the build runs. After execution, test results are saved in the results folder, which contains HTML and JSON files with the build summary.
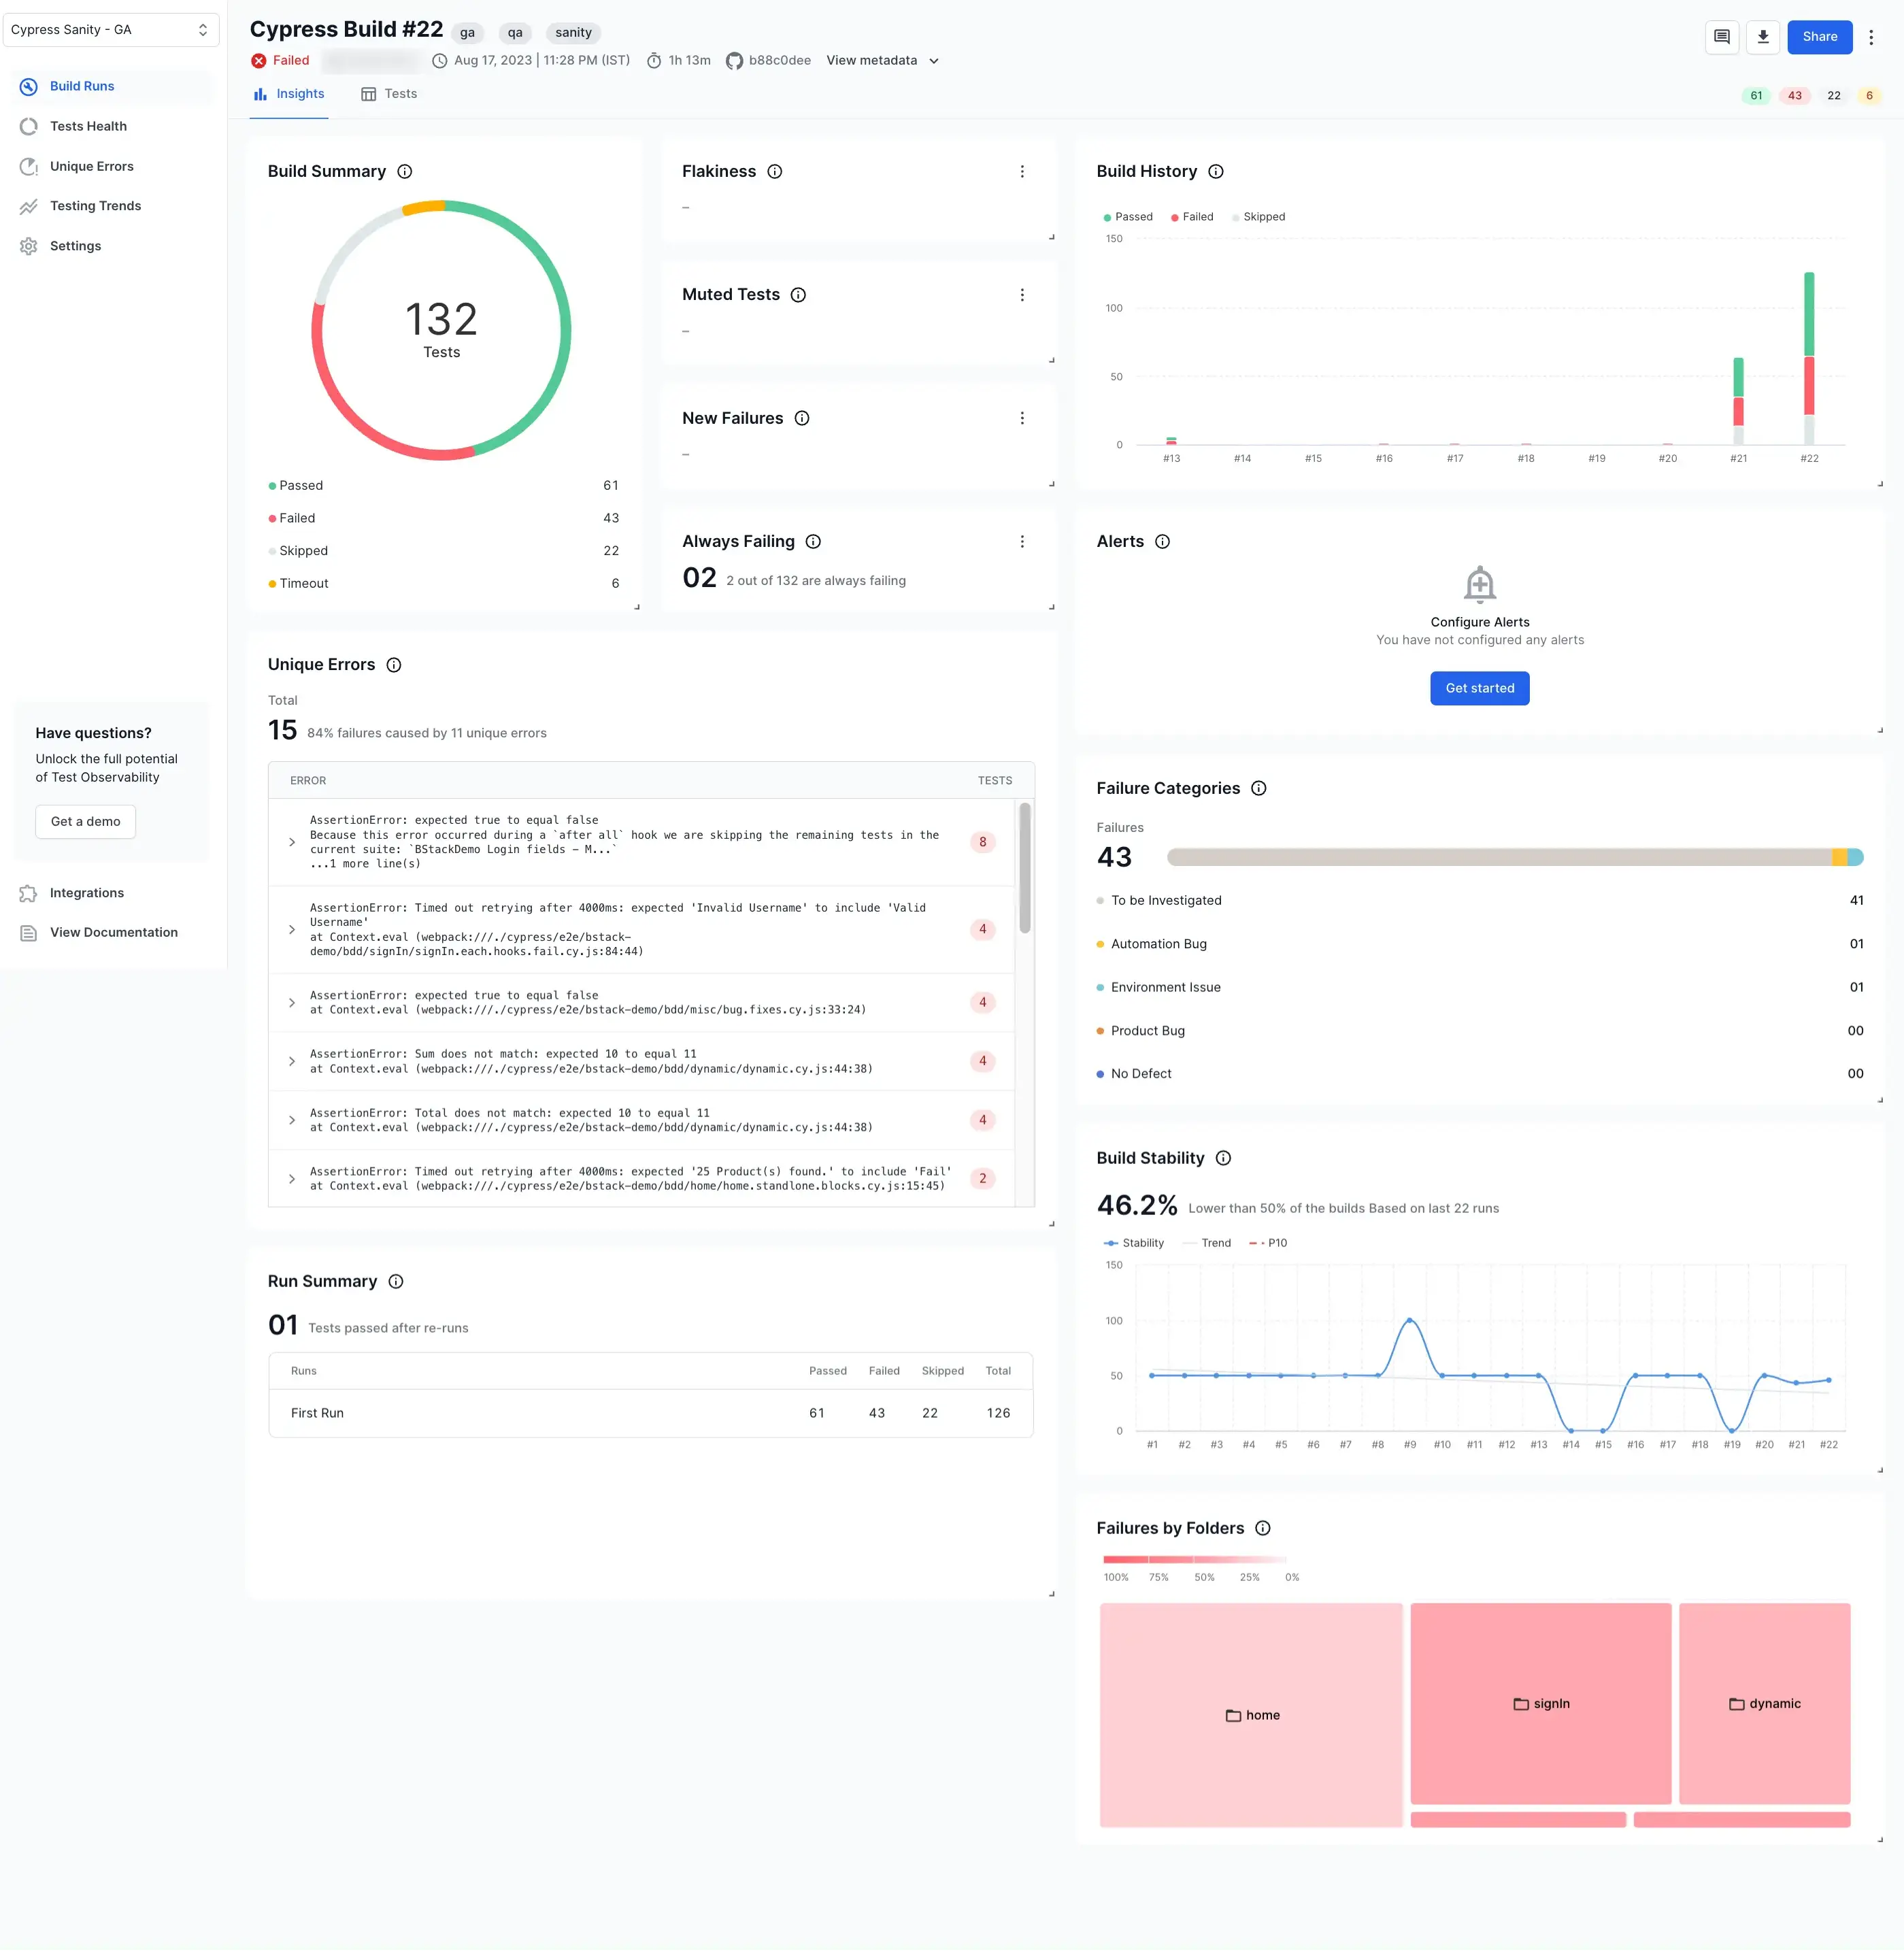
Debug builds and analyze trends with Test Reporting & Analytics
Level up your Cypress testing on BrowserStack with Test Reporting & Analytics, an advanced test reporting and debugging tool that helps you analyze test failures dramatically faster.
If enabled, Test Reporting & Analytics collects test data using the SDK. This capability is enabled (set to true) by default. You can explicitly turn off Test Reporting & Analytics by turning the testObservability flag to false. You can explore additional configurations and learn how to use Test Reporting & Analytics for Cypress here.
Test Reporting & Analytics currently doesn’t support other test reporters like Mochawesome. If any are set up, they are automatically disabled.
Next Steps
- Check out how to run your first test
- Learn how to test localhost and staging websites
- Learn how to run tests in parallel
We're sorry to hear that. Please share your feedback so we can do better
Contact our Support team for immediate help while we work on improving our docs.
We're continuously improving our docs. We'd love to know what you liked
We're sorry to hear that. Please share your feedback so we can do better
Contact our Support team for immediate help while we work on improving our docs.
We're continuously improving our docs. We'd love to know what you liked
Thank you for your valuable feedback!