
 Join our Discord
Configure Load Testing with Custom OpenTelemetry (OTLP)
Send Load Testing metrics and lifecycle events to any OTLP-compliant collector - Honeycomb, Grafana Cloud, CloudWatch, InfluxDB, or self-hosted.
Send your load-test metrics and lifecycle events to any OTLP-compliant collector - Honeycomb, Grafana Cloud, CloudWatch Metrics, InfluxDB (via OTel Collector proxy), or a self-hosted collector. You can also switch existing Datadog, New Relic, or Dynatrace tiles from their native SDK path to OTLP push with a single toggle - no new credentials required.
About OpenTelemetry (OTel)
OpenTelemetry is a vendor-neutral standard for emitting metrics, logs, and traces. An OTLP endpoint is any collector that accepts data in the OTel wire format. Because it’s a standard, one integration sends metrics to any tool that accepts OTLP.
For load testing, that means:
- Push the same 21 BrowserStack metrics (VU counts, response times, error rates, browser web-vitals, engine CPU/memory) to your own observability stack.
- Add BrowserStack lifecycle events (
test_started,test_completed,iteration_ended, etc.) as structured OTel Logs so you can correlate load-test phases with your app’s telemetry. - Keep your existing dashboards - no need to build BrowserStack-specific ones.
Set up custom OTLP
Choose your setup method - configure via the BrowserStack UI, or use the CLI for source-controlled configurations and CI/CD pipelines.
Use this for any OTLP-compliant collector that isn’t Datadog, New Relic, or Dynatrace.
Prerequisites
Before you start, make sure you have:
- A running OTLP collector you can reach over the public internet (Honeycomb, Grafana Cloud, CloudWatch Metrics, InfluxDB via OTel Collector proxy, self-hosted, or any other).
- Its endpoint URL (e.g.,
https://api.honeycomb.io/v1/metrics). - An auth header (if the collector requires authentication) - e.g., Honeycomb’s
x-honeycomb-team: <api-key>. - A BrowserStack Load Testing account with admin access to at least one project.
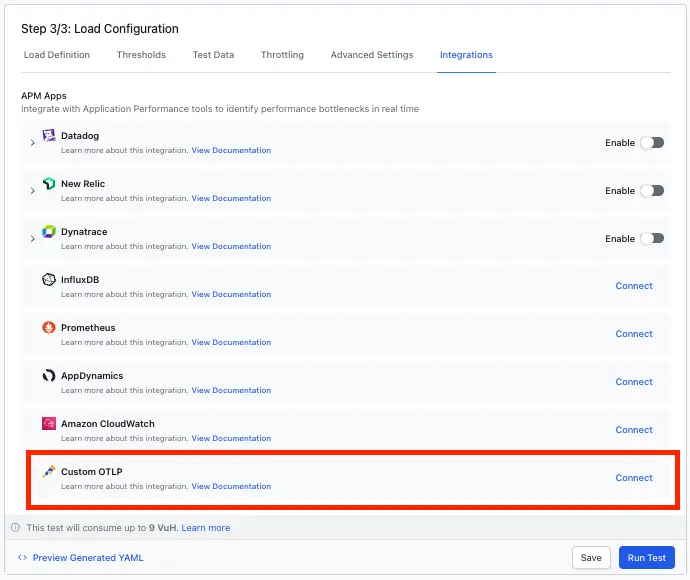
Open Load Testing > Project Settings > Integrations.
- Under Application Performance Monitoring, find the OTel tile.
- Click Connect.
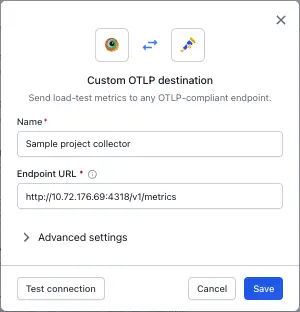
The form has four required fields and an optional auth-header section.
Enter the following information about your OTLP collector:
| Field | What to enter | Example |
|---|---|---|
| Name | A friendly name for this collector. Shown in dashboards and the per-load-test integration picker. | Honeycomb Prod |
| OTLP Endpoint | The direct OTLP intake URL of your collector. Must be http:// or https://. |
https://api.honeycomb.io/v1/metrics |
| Protocol | Choose http/protobuf (recommended for most collectors) or grpc. |
http/protobuf |
| Temporality | Choose cumulative, delta, or per-instrument - pick what your collector expects. |
cumulative |
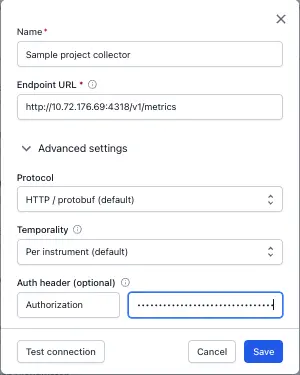
Expand Advanced settings to configure the Protocol and Temporality.
Which temporality does my collector need?
Select the temporality setting that matches your collector’s requirements:
| Collector | Temporality |
|---|---|
| Honeycomb | cumulative |
| Grafana Cloud (Mimir) | delta |
| CloudWatch Metrics OTLP | delta |
| InfluxDB (via OTel Collector proxy) | cumulative |
| Self-hosted OpenTelemetry Collector |
per-instrument (safe default; the collector re-aggregates) |
Click Test Connection. BrowserStack probes the endpoint in about 2-5 seconds and shows one of:
- Success - the endpoint is reachable, responds with a valid OTLP-shaped reply, and (if auth is set) accepts your header. You’re ready to save.
- Error - you’ll see a specific reason (see the Troubleshooting section below).
Test Connection does not save. Use it to catch typos before committing.
Expand the Auth header (Optional) section if your collector requires authentication. If you set a header key, you must provide a value - the save is rejected otherwise. If your collector needs no auth (e.g., some self-hosted collectors), leave this section blank.
Common header names:
- Honeycomb:
x-honeycomb-team - Grafana Cloud:
Authorization(with valueBasic <base64(instance:token)>) - Other collectors may use different header names
Click Connect & Save.
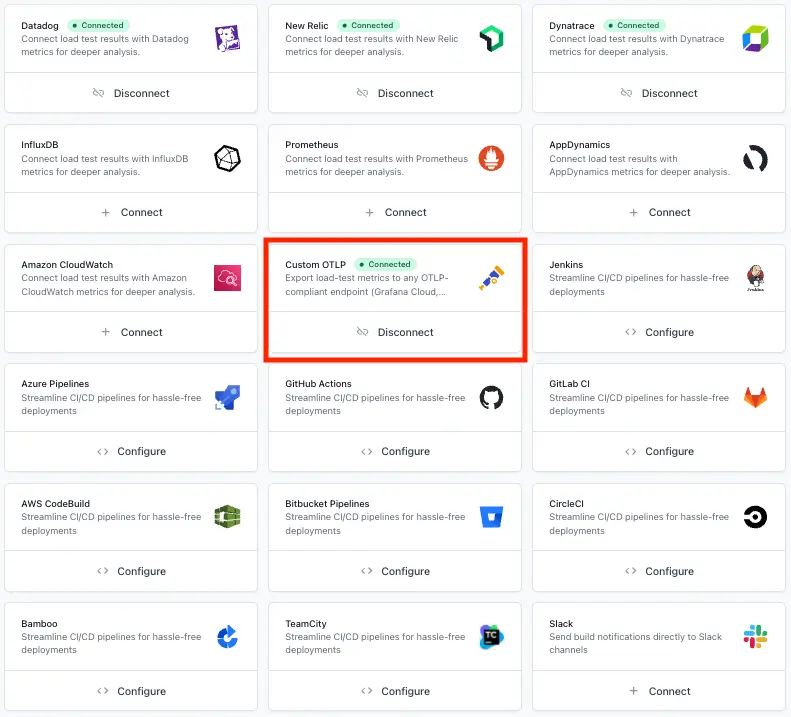
BrowserStack runs the same probe as Test Connection, then persists the credential. On success you’ll see a green Connected badge on the OTel tile. On failure, the specific field is called out.
Choose metrics and events per load test
Saving the credential (via UI or CLI) makes the OTel tile available. You still choose per load test whether and how to use it.
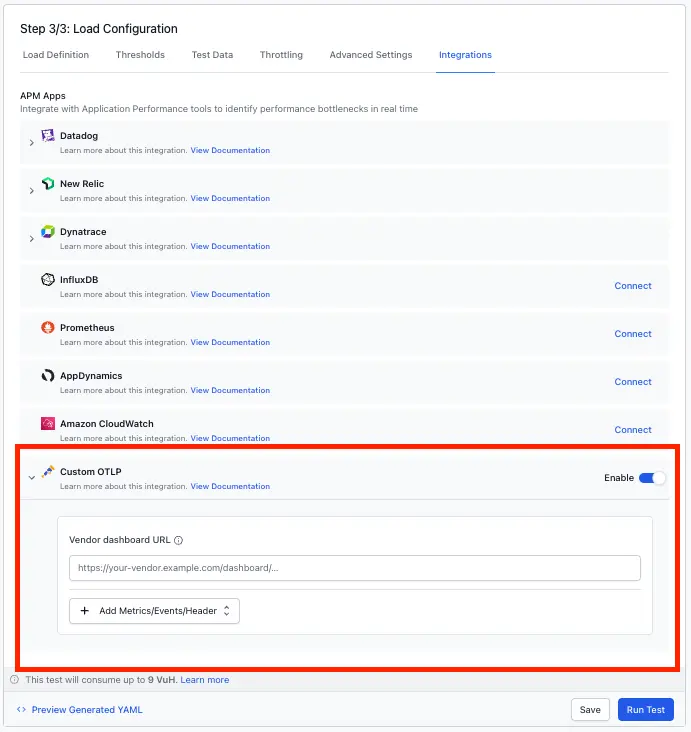
Open the load test > Integrations panel.
Select the OTel tile.
Configure which metrics and events to push for this run:
- (Optional) Enter a Vendor dashboard URL to link to your collector’s dashboard
- Click Add Metrics/Events/Header to select which BrowserStack metrics, lifecycle events, and custom headers to send
You can choose from:
- Any of the 21 BrowserStack metrics (VU counts, response times, error rates, browser web-vitals, engine CPU/memory)
- Lifecycle events (
test_started,test_completed,iteration_ended,scenario_start, etc.) as OTel Logs - Custom headers and tags for additional context
Supported collectors
The Custom OTLP integration works against any OTLP-compliant collector. The following collectors are verified end-to-end:
| Collector | Endpoint | Protocol | Temporality | Auth |
|---|---|---|---|---|
| Datadog |
https://otlp.datadoghq.com/v1/metrics (US) / https://otlp.datadoghq.eu (EU) |
http/protobuf |
delta |
DD-API-KEY: <api-key> |
| New Relic |
https://otlp.nr-data.net/v1/metrics (US) / https://otlp.eu01.nr-data.net/v1/metrics (EU) |
http/protobuf |
delta |
Api-Key: <license-key> |
| Dynatrace | https://<tenant>.live.dynatrace.com/api/v2/otlp/v1/metrics |
http/protobuf |
delta |
Authorization: Api-Token <classic-pat> |
| Honeycomb | https://api.honeycomb.io/v1/metrics |
http/protobuf |
cumulative |
x-honeycomb-team: <api-key> |
| Grafana Cloud (Mimir) | https://otlp-gateway-prod-<region>.grafana.net/otlp/v1/metrics |
http/protobuf |
delta |
Authorization: Basic <base64(instance:token)> |
| CloudWatch Metrics OTLP | https://monitoring.<region>.amazonaws.com/v1/metrics |
http/protobuf |
delta |
Authorization: Bearer <cw-otlp-token> |
| InfluxDB (via OTel Collector proxy) | http://<your-host>:4318/v1/metrics |
http/protobuf |
cumulative |
none (collector-side auth) |
| Self-hosted OpenTelemetry Collector |
http://<your-host>:4318/v1/metrics or <host>:4317
|
http/protobuf or grpc
|
per-instrument |
none (collector-side auth) |
Not on the list? It’ll still work as long as your collector accepts OTLP. Reach out to BrowserStack support if you’d like your collector added to the verified list.
Verify metrics are flowing
After your next load test completes:
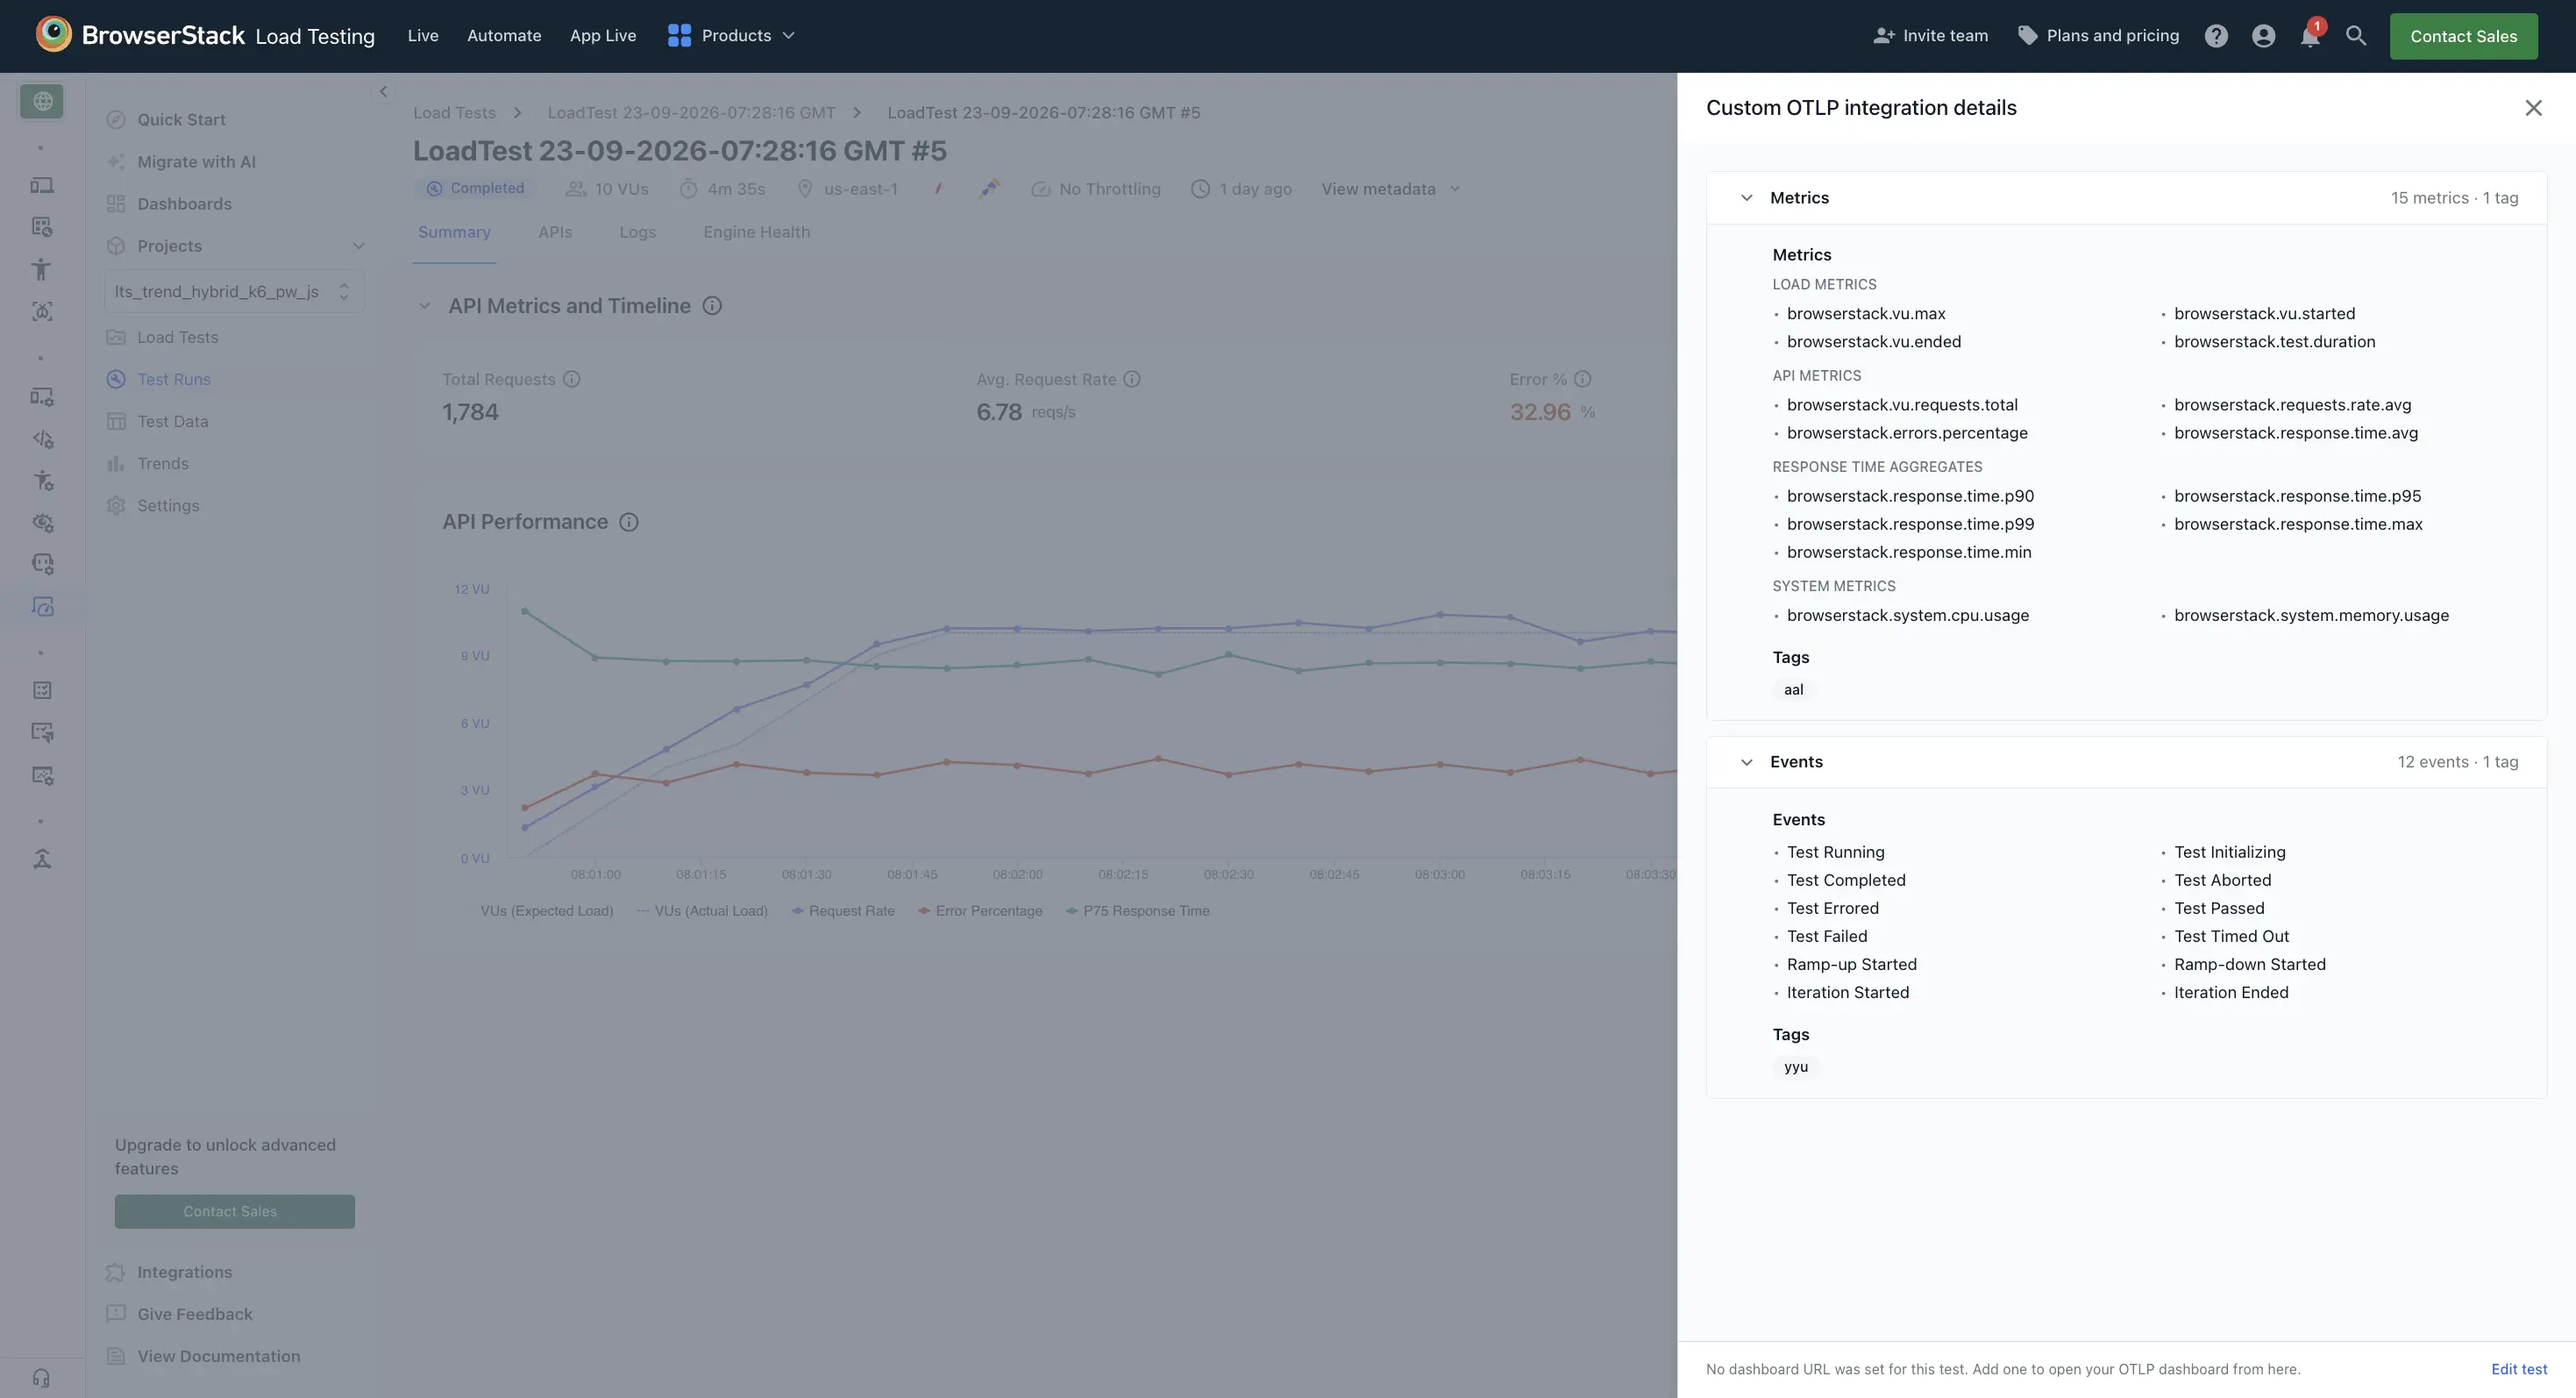
- In BrowserStack, open the test run’s detail page.
- Click APM Tools in the side panel.
- An OTel card is displayed with the collector name you configured (e.g., “Honeycomb Prod”).
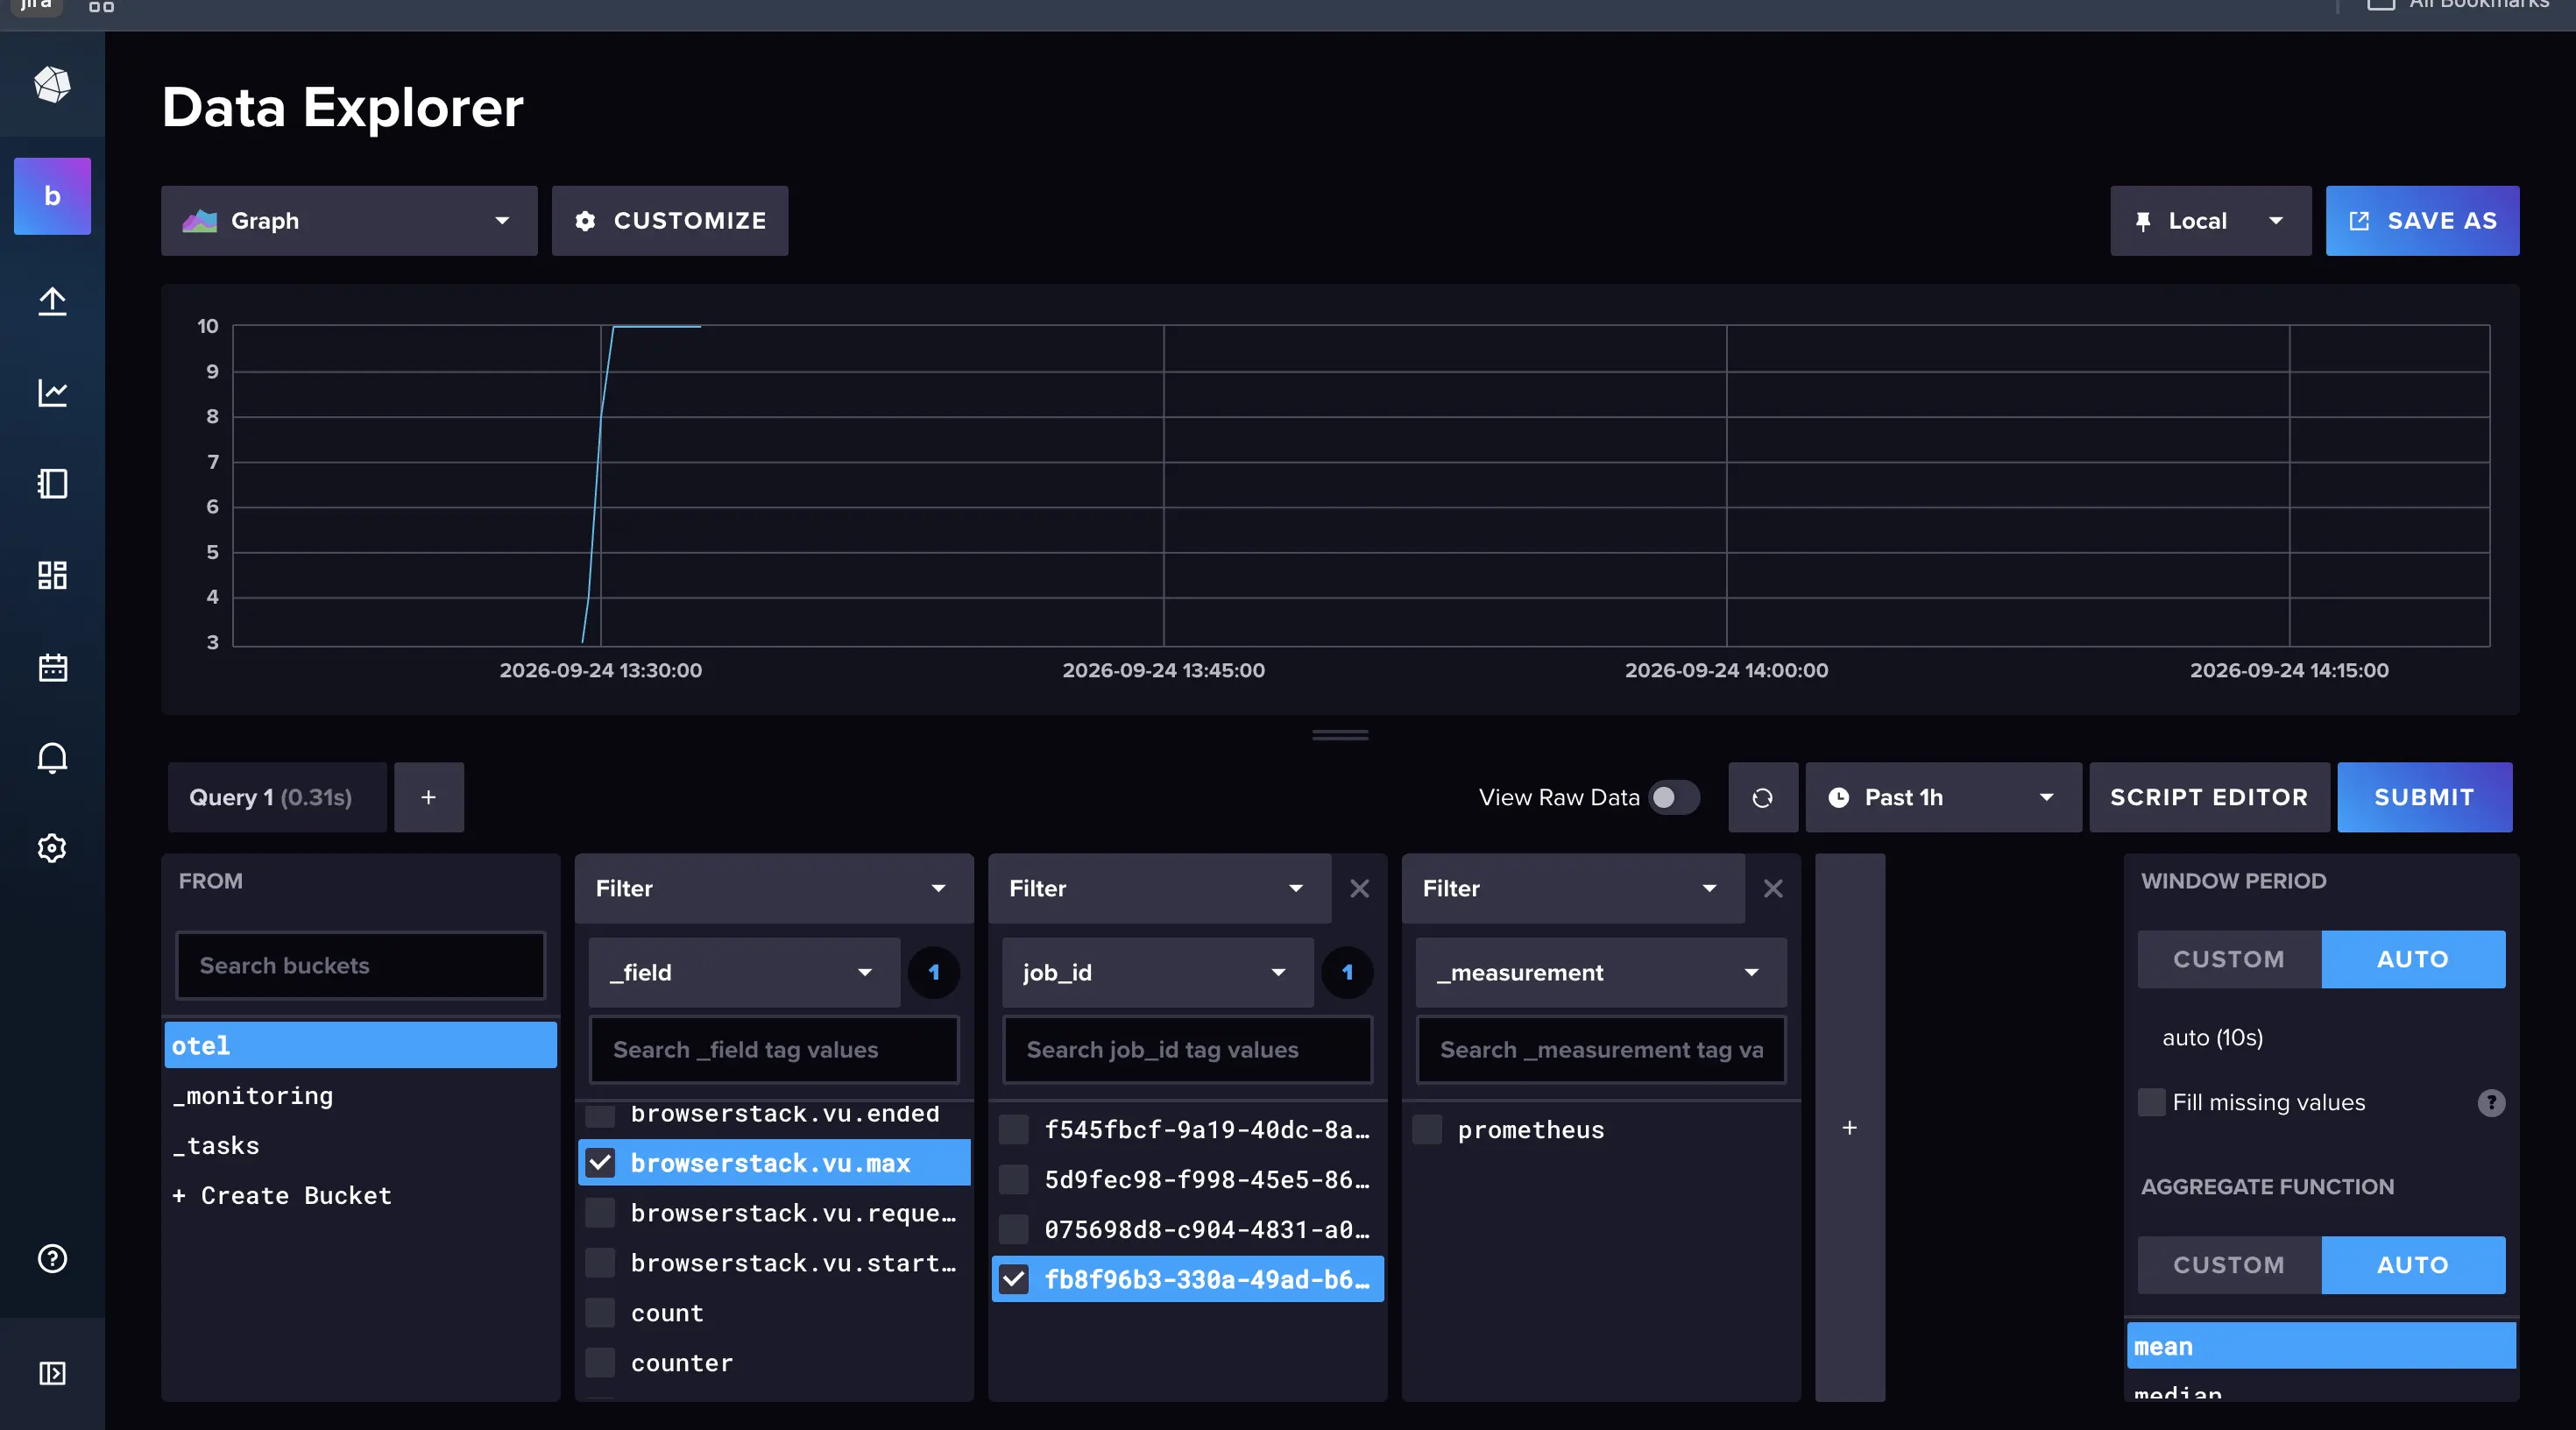
- Open your collector’s UI. Metrics with the
browserstack.*namespace and tags from your load test (test_id,dashboard_id,region,env, custom tags) appears within 30 seconds of the run starting.
Troubleshoot connection issues
If you encounter errors when saving your custom OTLP configuration, use this guide to identify and resolve the issue.
| Symptom | Cause | Fix |
|---|---|---|
| Save fails with “otlp_endpoint must be an http(s) URL” | Typo or missing scheme. | Endpoint must start with http:// or https://. Also must point at the direct OTLP intake path (e.g., /v1/metrics), not the collector’s marketing or UI URL. |
| Save fails with “OTLP endpoint responded with HTML - this looks like a web page, not an OTLP intake” | You pasted a vendor UI URL that redirected to a login SPA and returned an HTML page. | Copy the collector’s direct OTLP intake URL from its docs. For Grafana Cloud, look for the “OTLP Endpoint” field in Connections > OTLP; not the Grafana UI URL. |
| Save fails with “3xx redirect not followed” | The endpoint 3xx-redirects (typically to a login page). | Use the direct intake URL. OTLP endpoints respond to POSTs directly with 200/204/4xx - never with a redirect. |
| Save fails with “gRPC endpoint not reachable” on Grafana Cloud or CloudWatch | These vendors are HTTP-only. | Change protocol to http/protobuf. gRPC is only supported by self-hosted collectors that expose HTTP/2 on port 4317. |
| Save fails with “auth_header_value must be a non-empty string when auth_header_key is set” | You set the header key but the value is empty (or ${VAR} resolved to empty). |
Set both to non-empty, or leave both blank if the collector needs no auth. If using ${VAR}, export VAR="…" in the shell or CI environment. |
| Save fails with “Cannot reach OTLP endpoint” | DNS, firewall, or vendor region down. | Confirm the URL. Try curl -I <endpoint> - returns an HTTP status (any non-timeout, non-5xx is fine at the probe layer). |
| Save succeeds, but during the run metrics don’t appear in the collector | Auth header wrong (accepted at probe layer but rejected on real push), or metric selection excludes what you’re looking for. | Check the run’s APM Tools panel for an “APM credentials invalid” flag - that means the collector rejected the credential mid-run. Regenerate the token, re-save. If no flag, check the metric or event selection in the load-test config. |
| Only some metrics show up in the collector | Per-load-test selection filtered them out. | UI: open load test > Integrations > OTel > check the metrics list. CLI: broaden or remove the metrics.select array in YAML. |
Where your credentials are stored
Your credentials are stored encrypted at rest and only transmitted to the OTLP endpoint you configured. Your credentials are never logged or exposed to other integrations, and BrowserStack’s Load Testing service never accesses the raw values.
You can revoke the credential at any time by clicking Disconnect on the OTel tile in Project Settings > Integrations. Disconnect removes the credential immediately. Any in-flight test runs stop pushing to that collector on the next metric batch.
Next steps
- Run a load test: See the quick-start guide to set up and run your first load test (about five minutes).
- Combine with native APM tiles: Enable OTel push on your existing Datadog, New Relic, or Dynatrace tile in parallel with Custom OTLP for cross-vendor visibility.
- Use env-var interpolation in CI: For CI/CD pipelines, keep the YAML in source control and store the real API key in your CI’s secrets manager.
-
Set up alerts in your collector: Alert on metrics like
browserstack.errors.percentage > 5%during scheduled tests - see your collector’s alerting docs.
We're sorry to hear that. Please share your feedback so we can do better
Contact our Support team for immediate help while we work on improving our docs.
We're continuously improving our docs. We'd love to know what you liked
We're sorry to hear that. Please share your feedback so we can do better
Contact our Support team for immediate help while we work on improving our docs.
We're continuously improving our docs. We'd love to know what you liked
Thank you for your valuable feedback!