Logs and artifacts
Capture and download the output files your protocol load test produces, including framework-native results and custom files your script writes.
After a protocol load test finishes, BrowserStack Load Testing captures and surfaces the output files your script produces. These files include framework-native results, such as the k6 summary.json, JMeter kpi.jtl, Gatling simulation directory, and Locust stats CSV files, along with any custom files your script writes. This page covers how to turn capture on and how to add your own files. To store logs for every virtual user instead, see Store execution logs.
Artifact capture is available for protocol tests only. Browser and hybrid tests don’t support it.
Where artifacts appear
After a run completes, follow these steps to find the downloadable files:
Open the test in the Load Testing dashboard.
On the test results page, expand the View metadata section.
Next to the Artifacts entry, click View to open the list of downloadable files for the run.
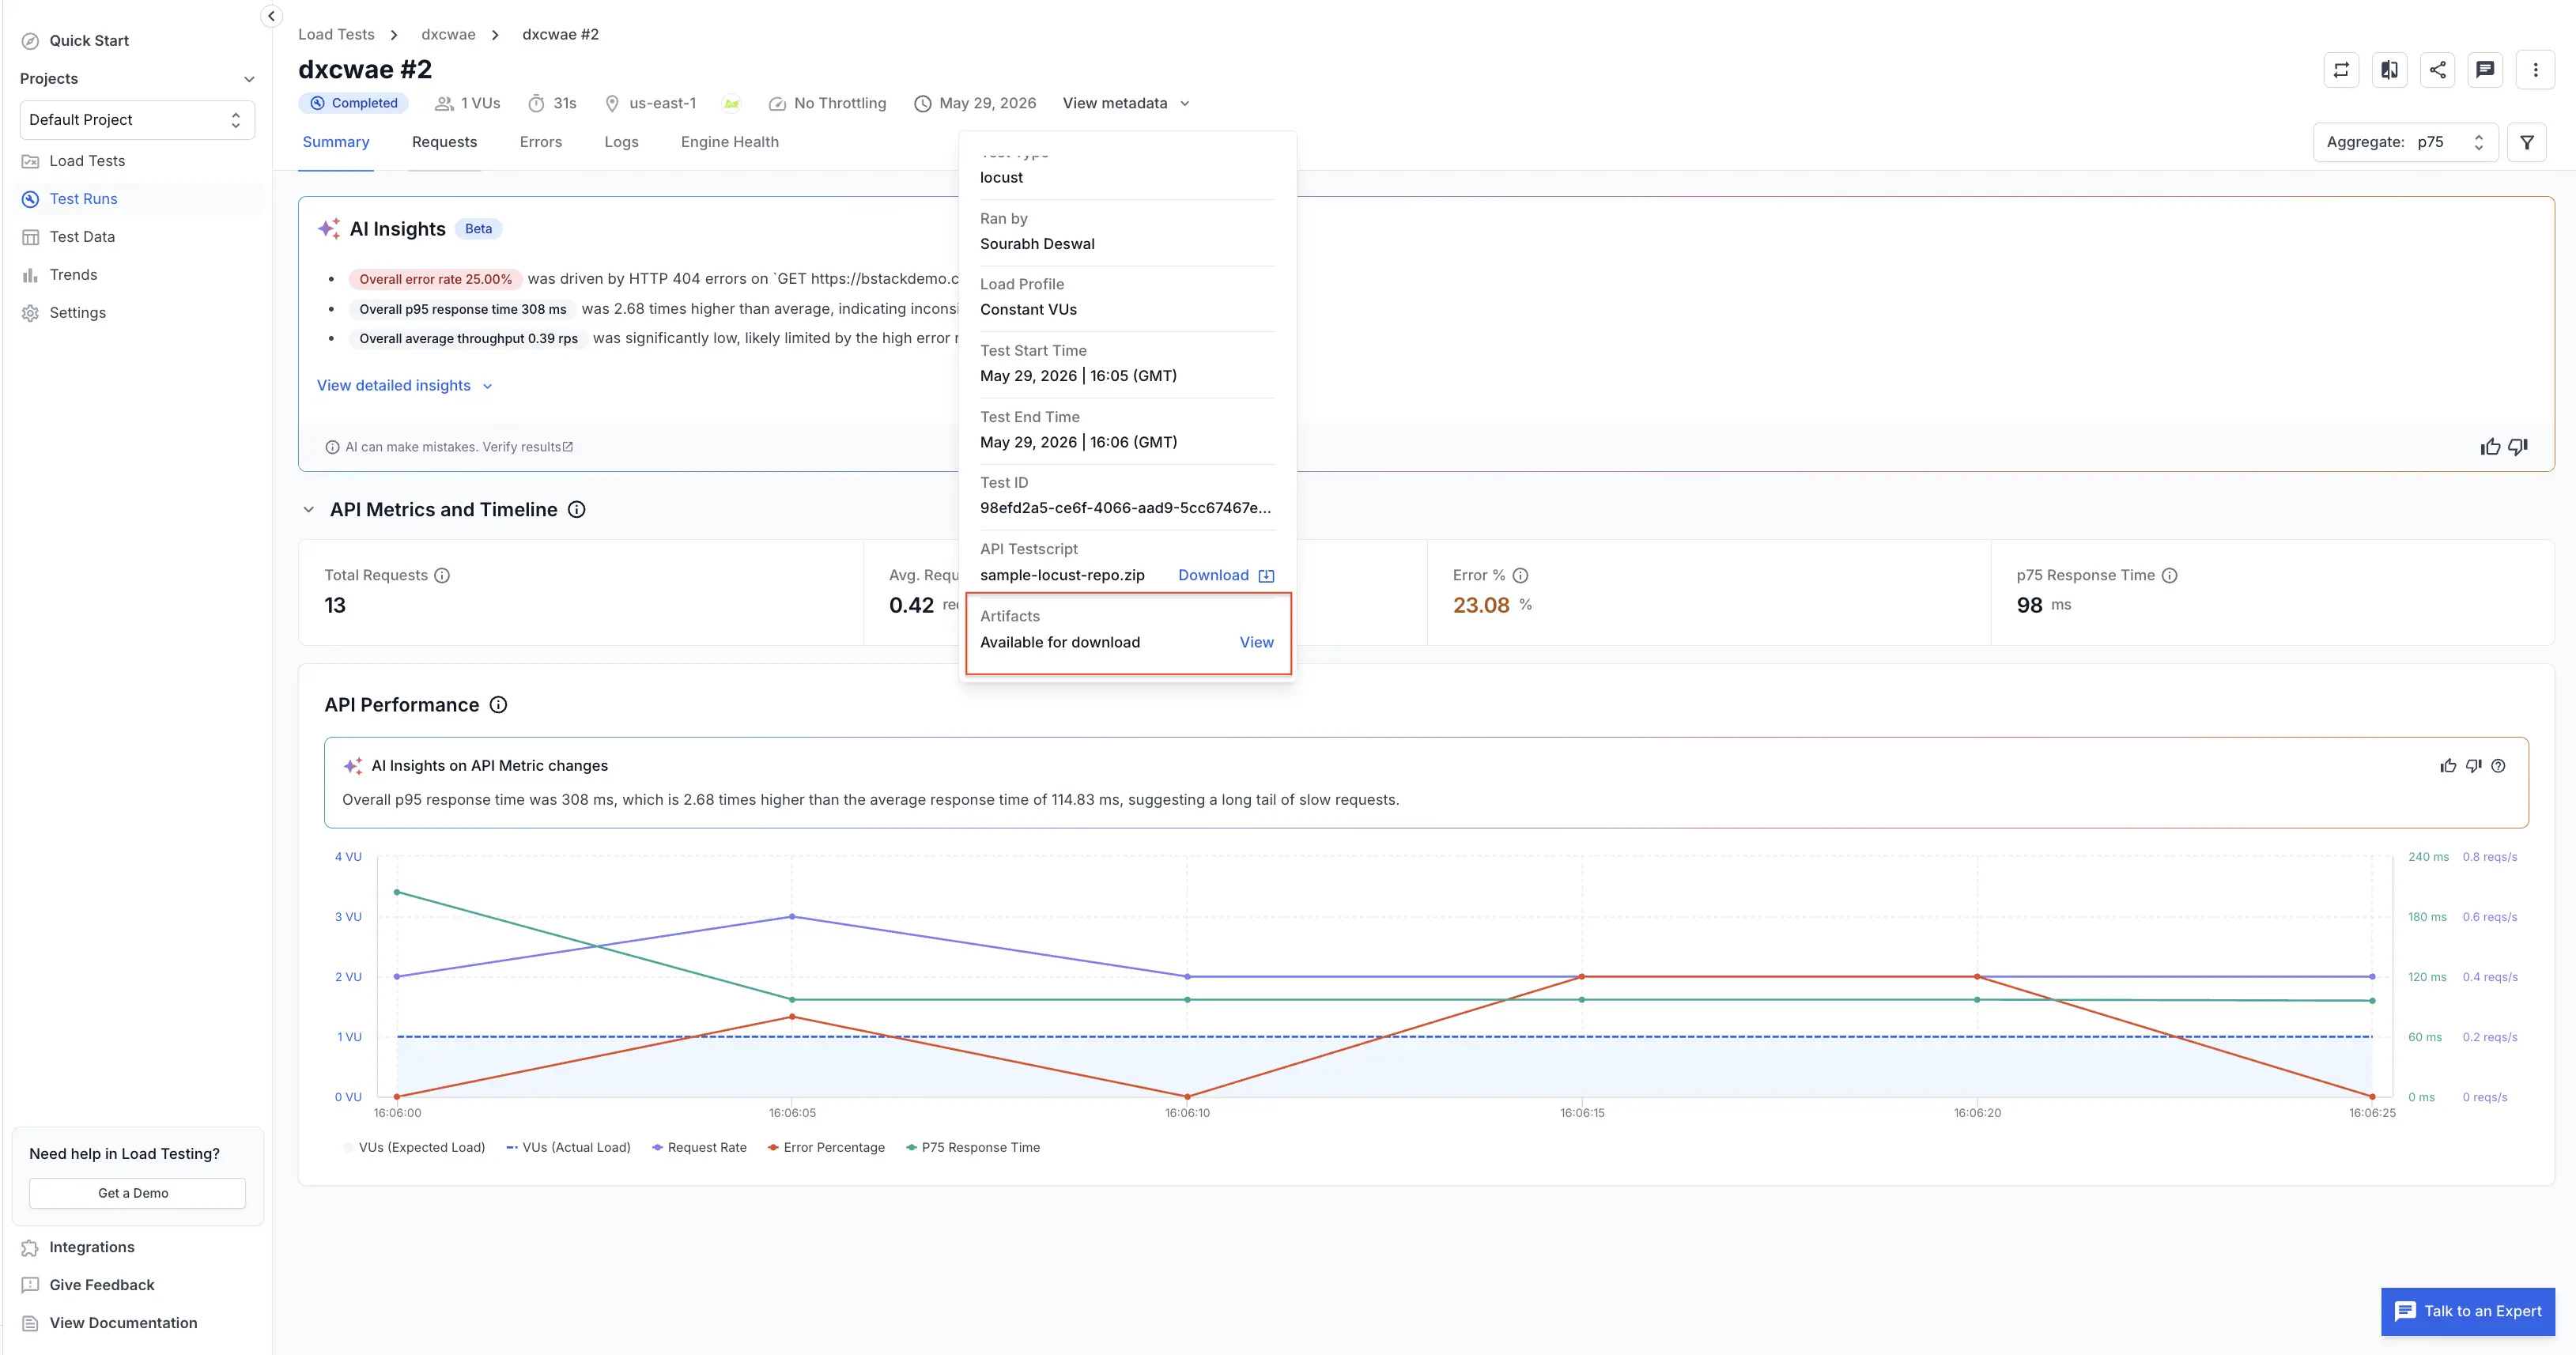
If the Artifacts entry isn’t there, or the list opens empty, artifact capture was most likely off for the run. To enable it, see Turn artifact capture on.
Turn artifact capture on
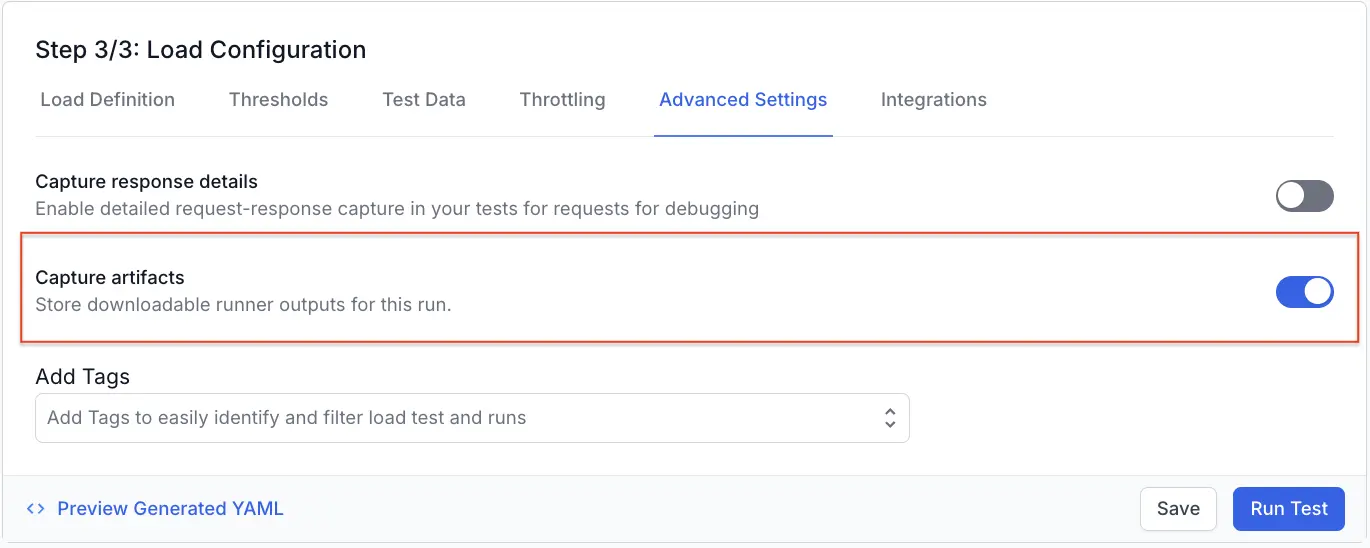
Artifact capture is off by default. Enable it for each run from the dashboard or the CLI:
Without artifact capture enabled, BrowserStack uploads no artifacts. The View metadata section stays empty even when your script writes files.
While creating or editing a test, open Additional settings and toggle Capture artifacts on.
Set captureArtifacts: true in your browserstack-load.yml:
Capture custom files
BrowserStack picks up the framework-native outputs automatically. To capture additional files, such as a custom CSV, a debug log, or a derived report, write them to the directory that BrowserStack exposes through the LT_USER_ARTIFACTS_DIR environment variable.
BrowserStack injects LT_USER_ARTIFACTS_DIR inside the runner. Anything your script writes to that directory before it exits gets uploaded and listed under View metadata alongside the framework-native outputs.
Always use the LT_USER_ARTIFACTS_DIR environment variable to build the output path. Don’t hardcode the path, because it differs per framework.
Select your framework to see how to write a custom file to the artifacts directory:
Use the handleSummary function to write custom files to the artifacts directory. Read the directory path from the LT_USER_ARTIFACTS_DIR environment variable:
Use a JSR223 PostProcessor in Groovy, or a Save Responses to a file listener. Read the environment variable with System.getenv():
For the Save Responses to a file listener, set the Filename prefix to the following value:
Read the directory path with sys.env, then write your custom file in an after block so it runs at the end of the simulation:
Read the directory path from os.environ, then write your custom file in a test_stop event listener so it runs when the test ends:
Common issues
The View metadata section is empty
The View metadata section is empty because captureArtifacts wasn’t enabled for the run. Re-run the test with the toggle on from the dashboard, or with captureArtifacts: true in your browserstack-load.yml.
My custom file isn't listed
Your custom file isn’t listed. Confirm that your script wrote it under LT_USER_ARTIFACTS_DIR, not a relative path or /tmp, and that the write happened before the script exited.
The file exists but won't download
The file exists but won’t download. Download links are time-limited. Reopen the test results page to refresh them.
We're sorry to hear that. Please share your feedback so we can do better
Contact our Support team for immediate help while we work on improving our docs.
We're continuously improving our docs. We'd love to know what you liked
We're sorry to hear that. Please share your feedback so we can do better
Contact our Support team for immediate help while we work on improving our docs.
We're continuously improving our docs. We'd love to know what you liked
Thank you for your valuable feedback!