
 Join our Discord
Hybrid browser test results
Analyze browser test results including web vitals and test execution for hybrid load testing.
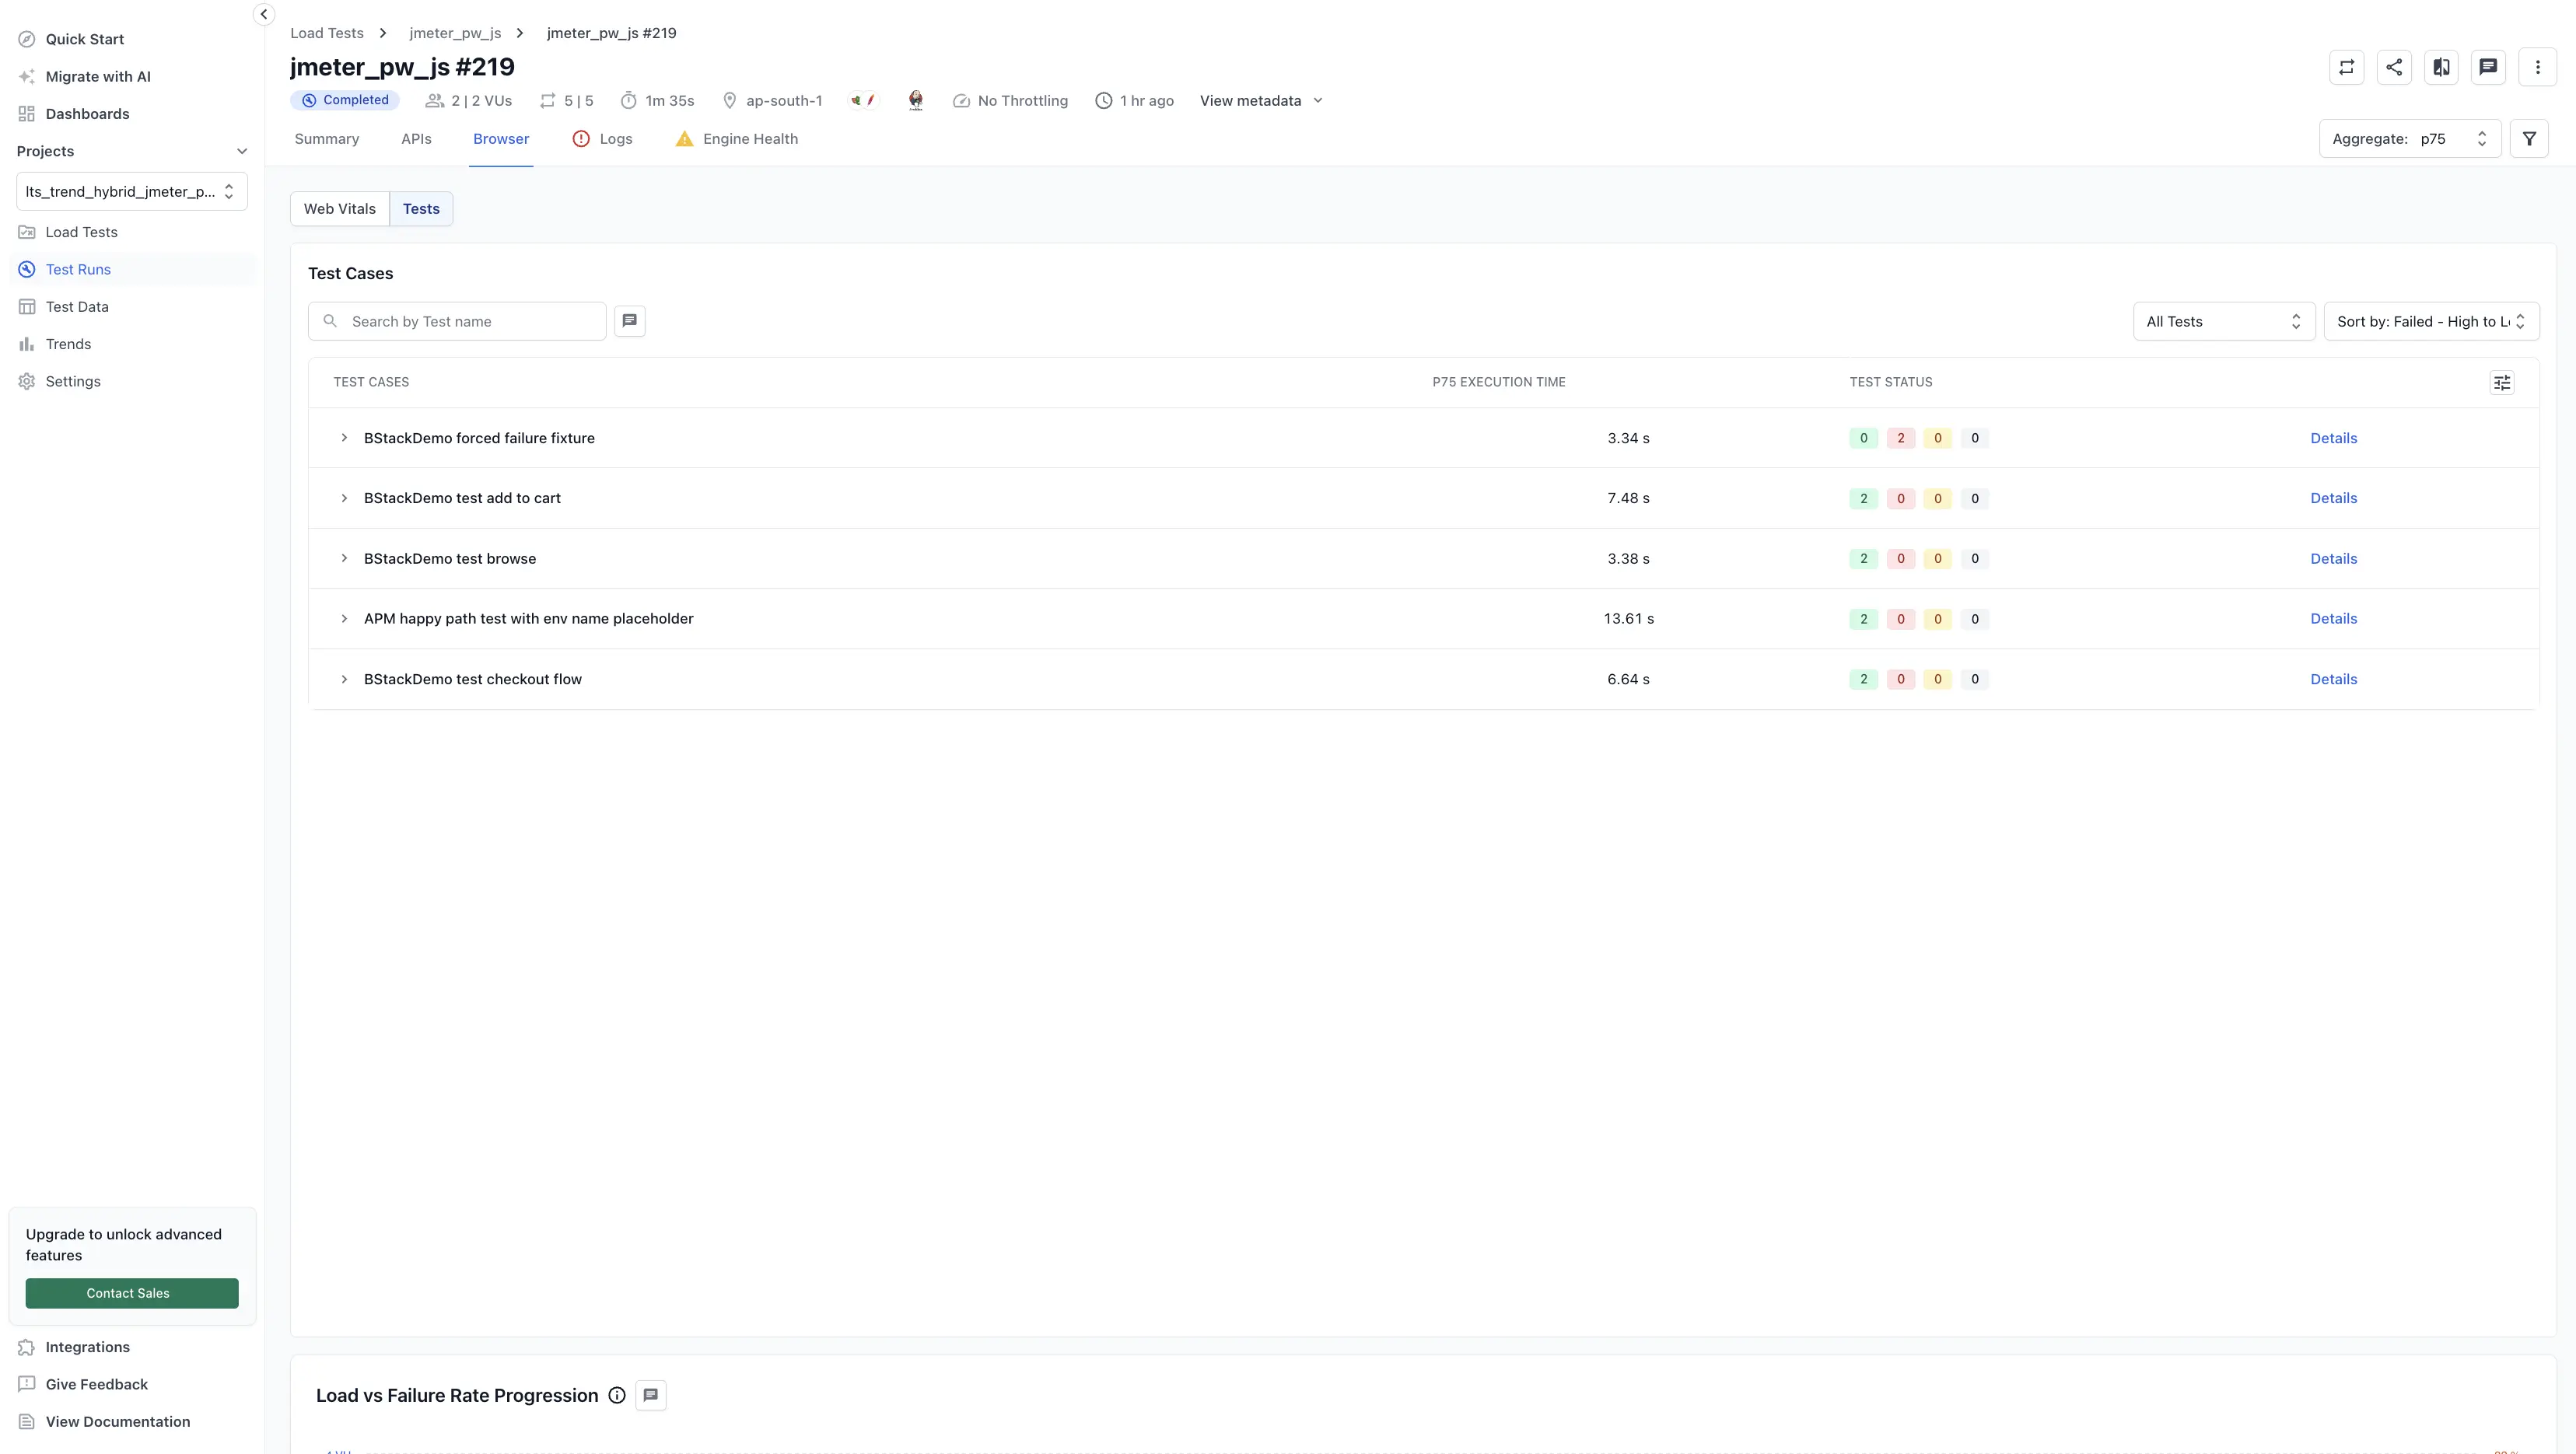
The Browser tab is divided into two sub-tabs: Web Vitals and Tests. Network data isn’t available for hybrid tests. Use these to drill into browser performance and test execution results during hybrid load testing.
Navigate browser results
Select a sub-tab to view its results:
Identify slow URLs and inspect page-load phases during a hybrid load test.
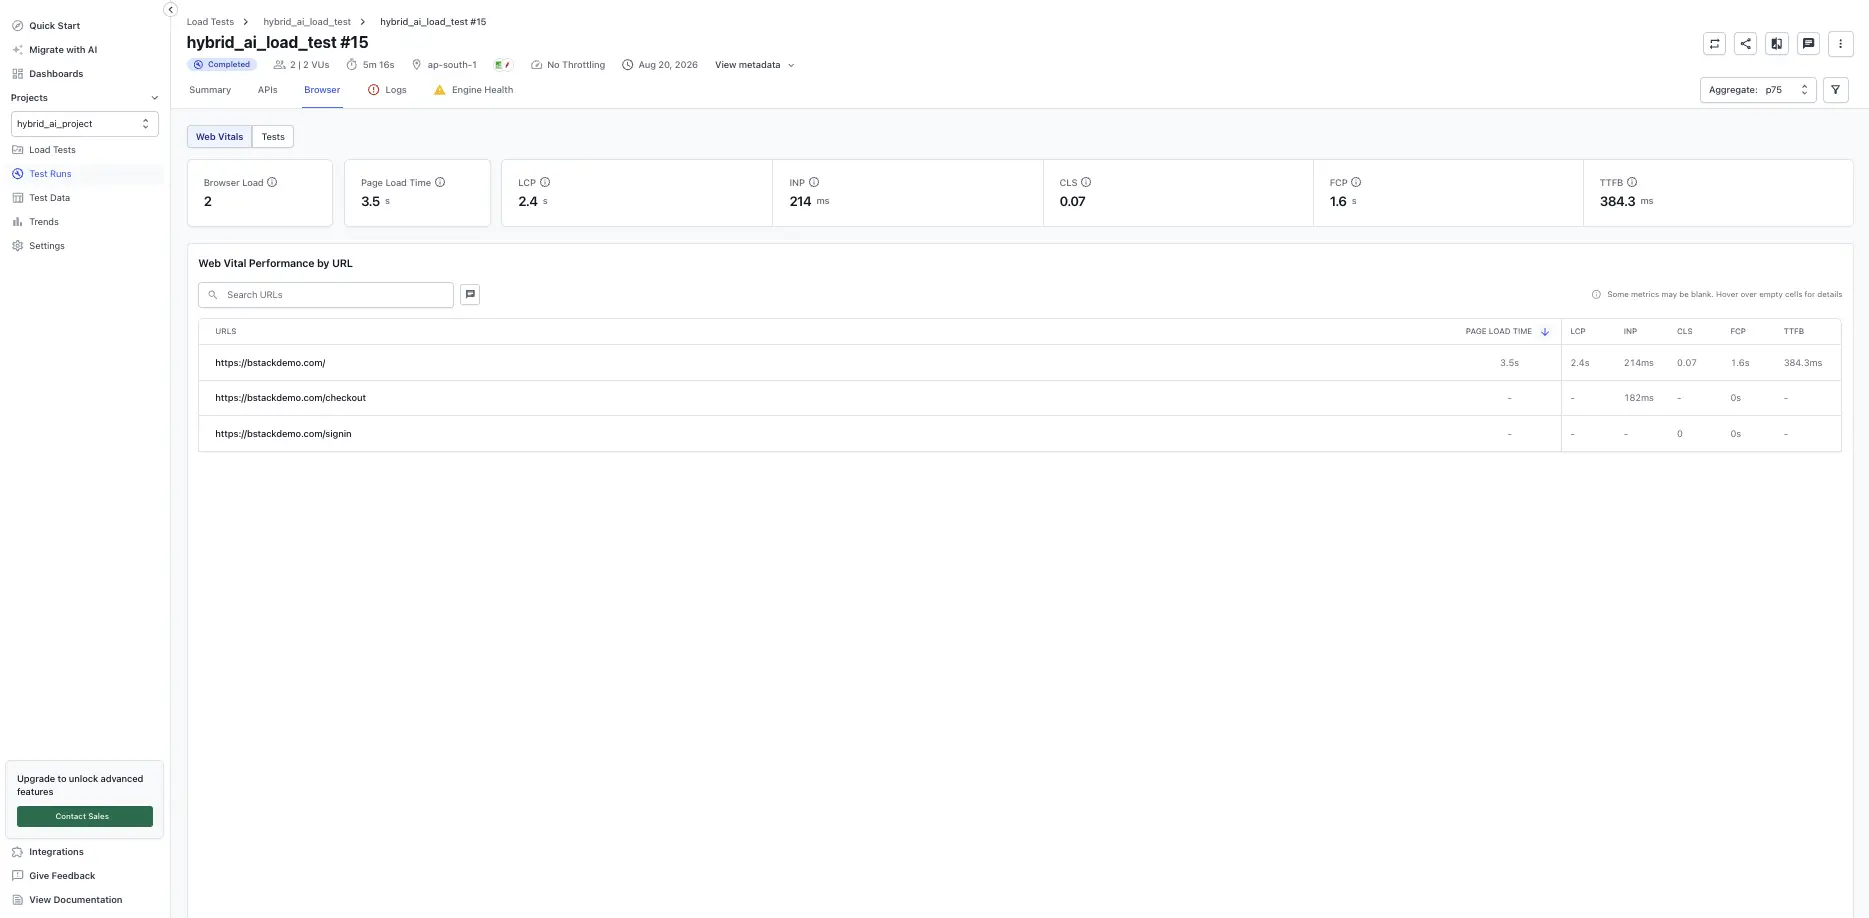
The Web Vitals tab highlights the most important frontend performance signals for your application during load. Use this page to identify slow URLs and compare key metrics across the site.
Worst-performing URLs
The Worst-performing URLs chart surfaces the top 5 URLs with the worst values for the selected metric. Use the toggle to switch between LCP, INP, CLS, FCP, and TTFB. Values represent the percentile selected in the report header (for example, p75) across all virtual users.
Use this view to decide which URLs to prioritize for optimization.
Detailed URL table
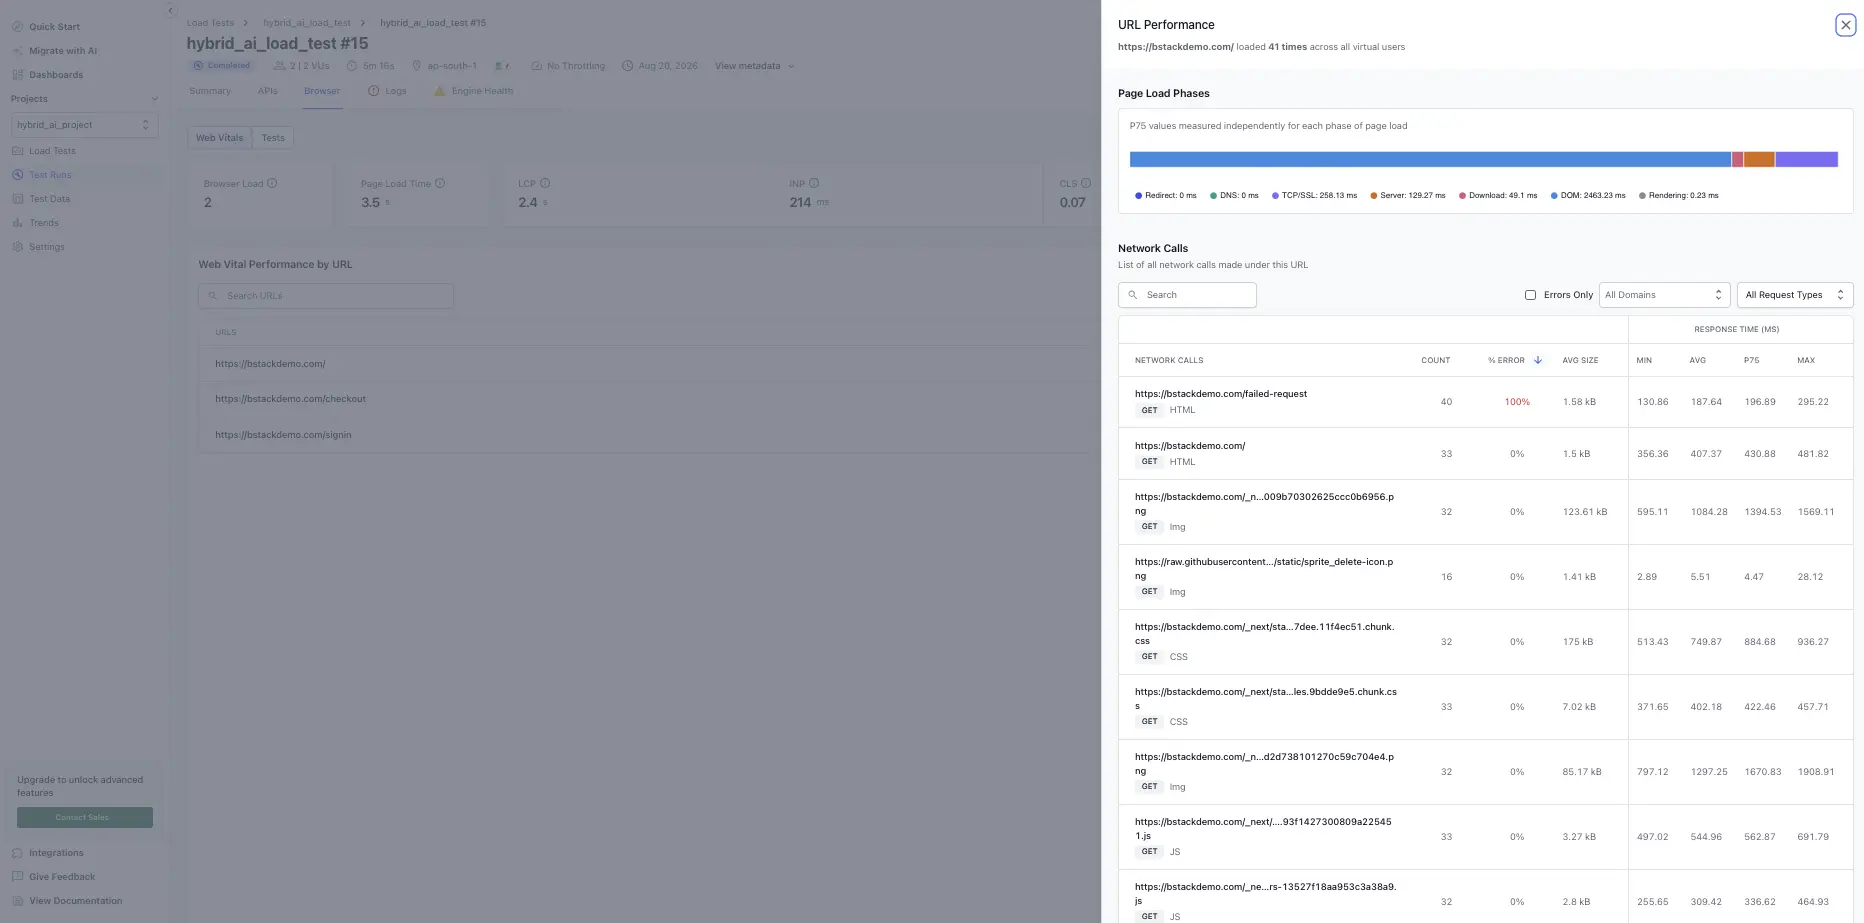
The Detailed URL table lists every tested URL with its Web Vitals values and a breakdown of page-load phases (for example, DNS, connect, request, response, render). Sort by any column or search by URL to narrow the list. A dash (-) in a cell means the metric was not captured for that URL.
We're sorry to hear that. Please share your feedback so we can do better
Contact our Support team for immediate help while we work on improving our docs.
We're continuously improving our docs. We'd love to know what you liked
We're sorry to hear that. Please share your feedback so we can do better
Contact our Support team for immediate help while we work on improving our docs.
We're continuously improving our docs. We'd love to know what you liked
Thank you for your valuable feedback!