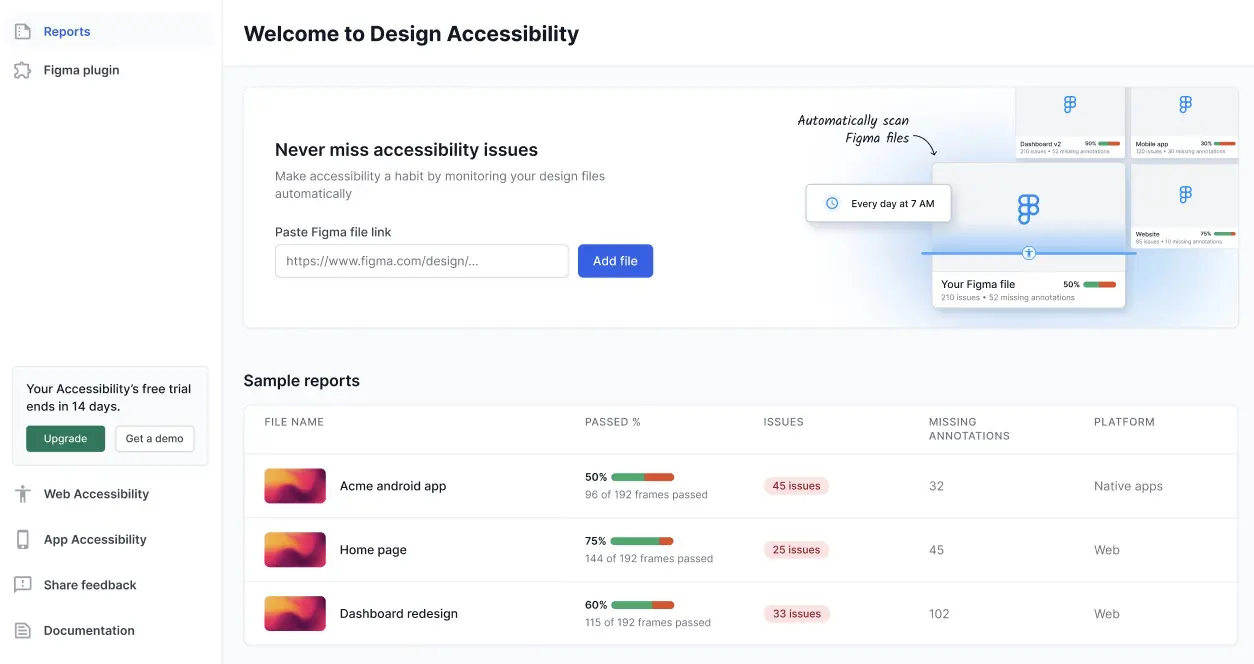
Design Scanner
Monitor Figma files and pages with Accessibility Design Toolkit to detect changes, rerun scans, and keep designs compliant.
You can monitor any edits in your Figma files or specific pages and automatically rerun relevant accessibility checks using Design Scanner.
Benefits
- Early detection: Automatically surface issues introduced by recent edits.
- Continuous compliance: Keep designs aligned with your accessibility standards.
- Reduced manual work: Avoid re-running scans after every change.
Enable monitoring
Follow these steps to turn on monitoring for a file or page:
- Open Design Scanner and click Add New File to get started.
- Enter the URL in the Figma File link field and click Add File.
- Click the edit icon to update the scan settings.
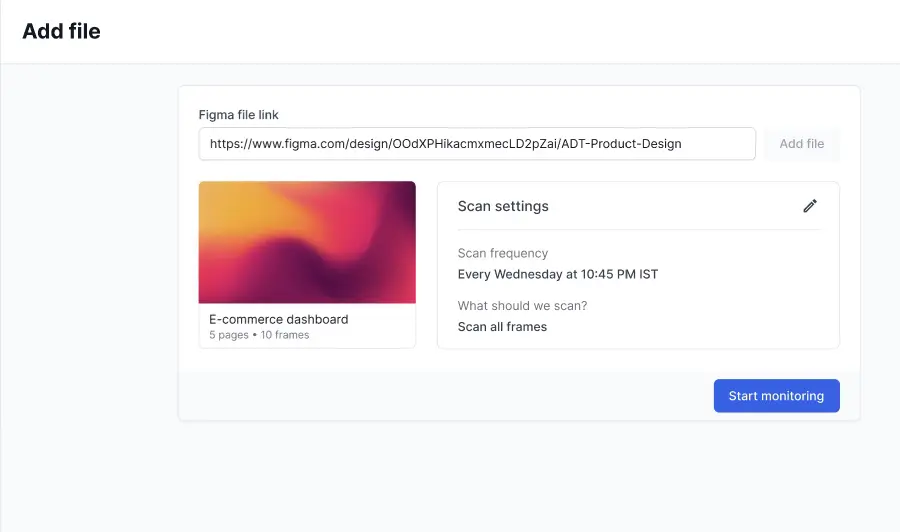
- Click Start Monitoring.
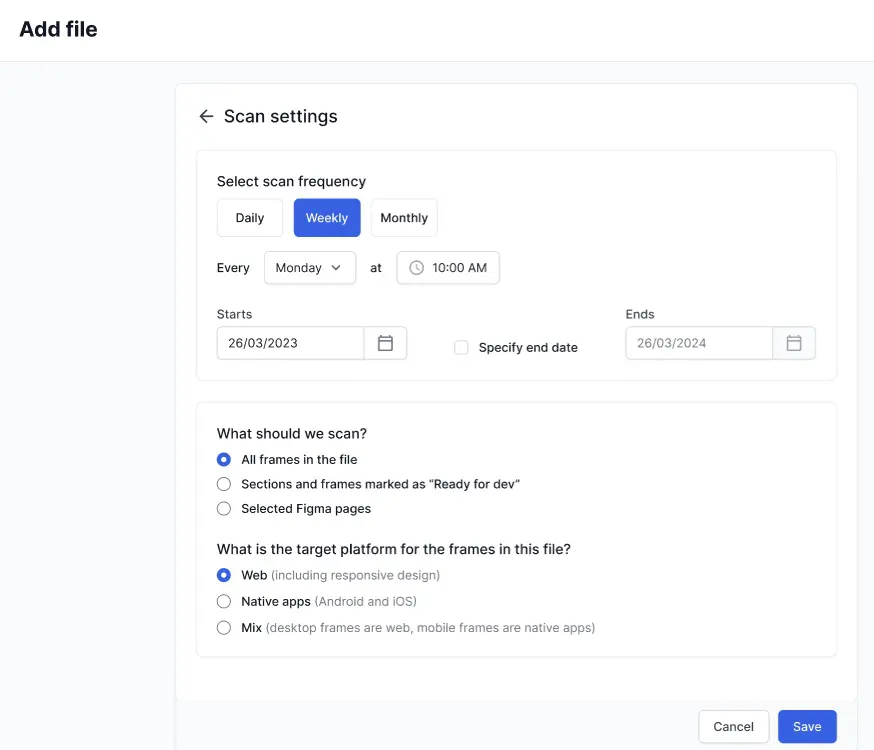
- Update the scan schedule and settings, then click Save. You can choose to scan the entire file or specific pages, sections, or frames. You can also select the target platform of the design.
Due to Figma’s rate limits, you need a Figma paid plan with a Dev or Full seat to create scans. You can use the free version to view reports.
Review monitoring results
To analyze what changed:
- Open Reports in the plugin’s dashboard. You can view all the available file monitoring reports here.
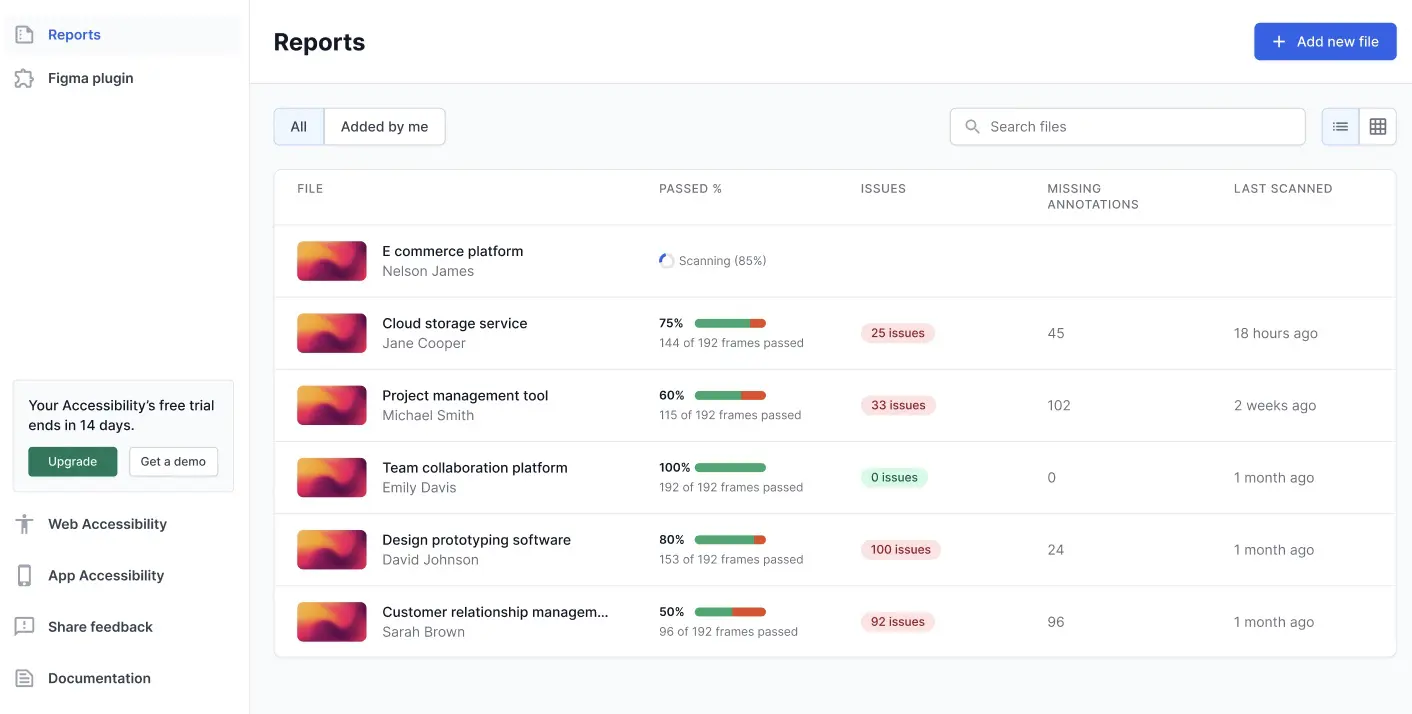
- Click a report to view details.
- Click through the Summary, Layout scan, and Component scan to view the report, check the information and trends described across the different widgets, and analyze changes.
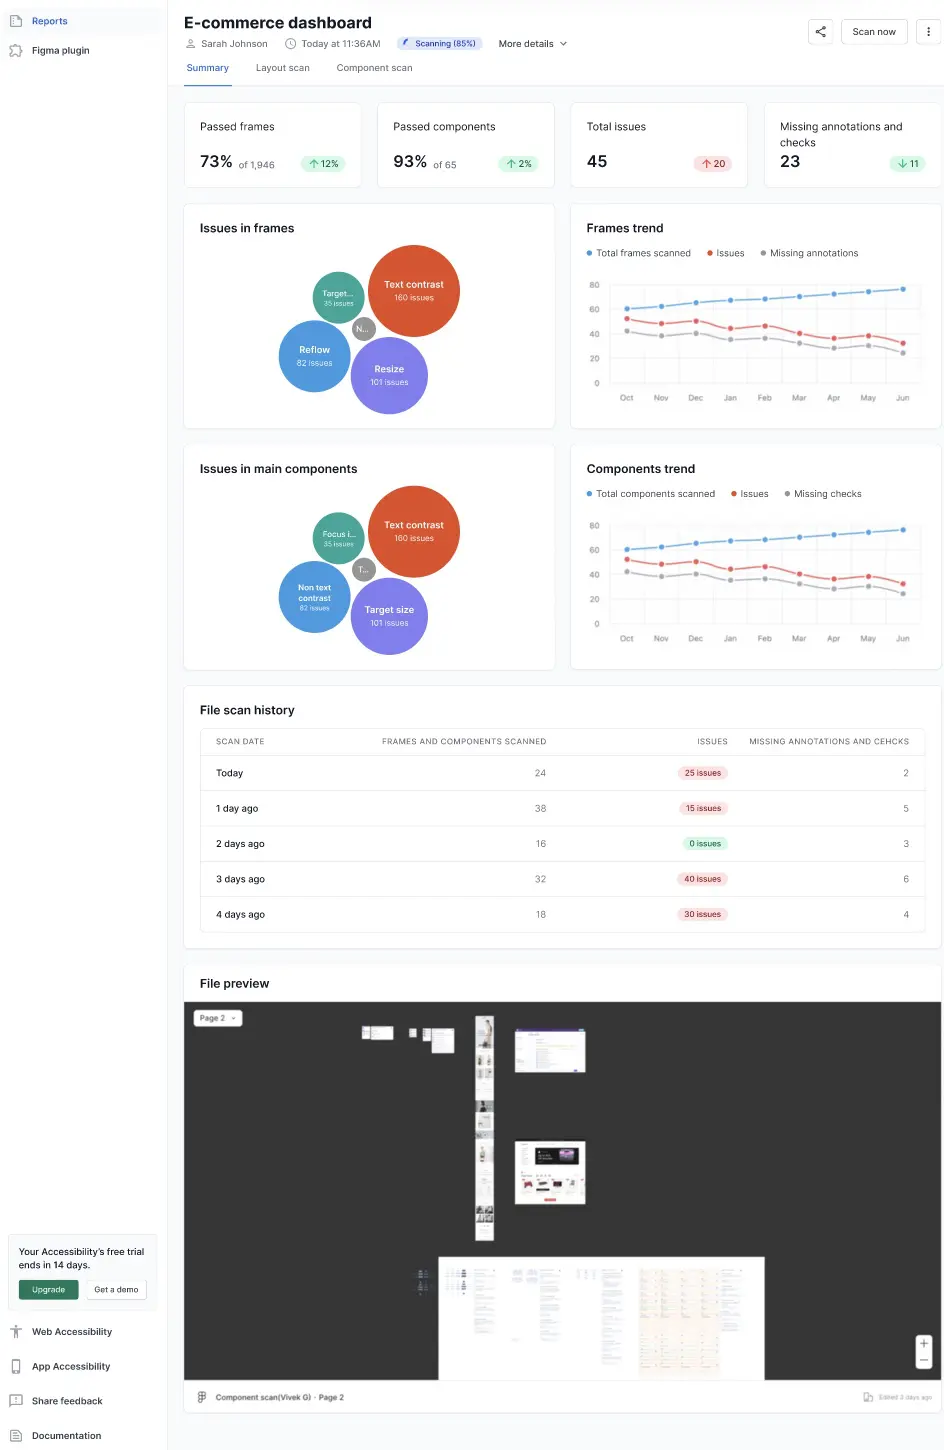
Summary tab in Reports
The summary tab outlines the overall metrics of the asset being scanned. The following widgets cover the most essential information:
- Passed frames: Shows the percentage of frames which have no accessibility issues, along with a rate of change from the previous scan.
- Passed components: Shows the percentage of components which have no accessibility issues, along with a rate of change from the previous scan.
- Total issues: Shows the total number of issues in the scanned file, along with the change from the previous scan.
- Missing annotations and checks: Shows the number of instances where the required annotations and checks are not present, along with the change from the previous scan.
- Issues in frames: Displays a bubble chart that represents the number of issues in frames, marked under the various issue types.
- Frames trend: Displays a line graph that depicts the trend of total frames scanned, issues, and missing annotations across a time period.
- Issues in main components: Displays a bubble chart that represents the number of issues in the main components, marked under the various issue types.
- Components trend: Displays a line graph that depicts the trend of total components scanned, issues, and missing checks across months.
- File scan history: Displays a list of the recent scans with the dates, count of frames and components scanned, issue count, and a count of missing annotations and checks.
- File preview: Displays a preview of the file being monitored.
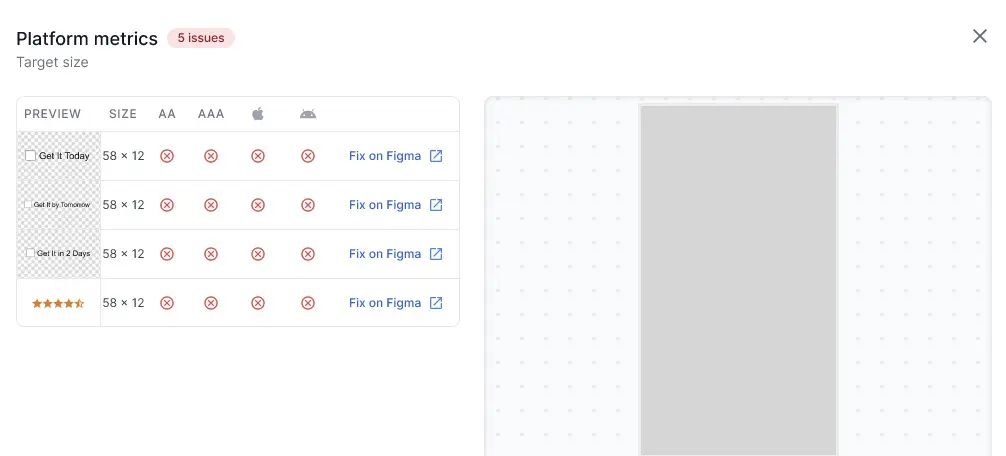
Layout scan tab in Reports
The Layout scan tab lists all the issues according to the issue types.
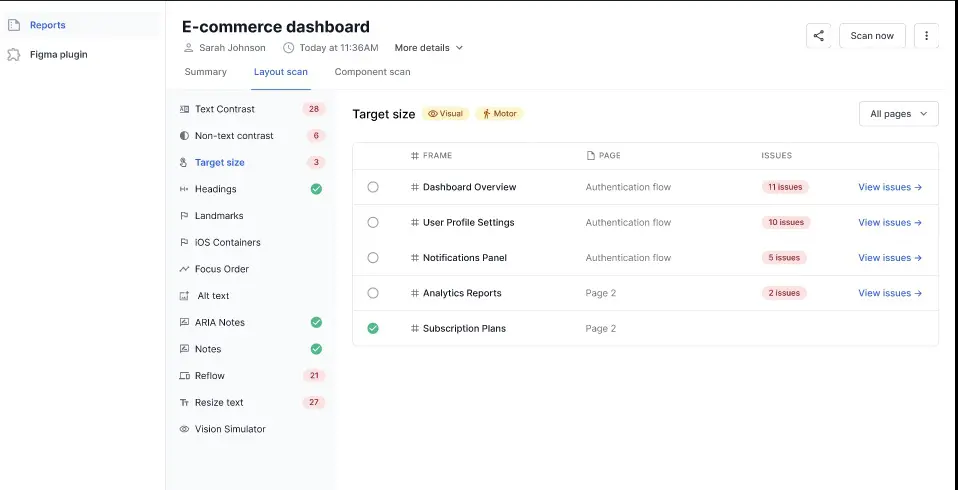
Click View issues for an issue type to see more details.
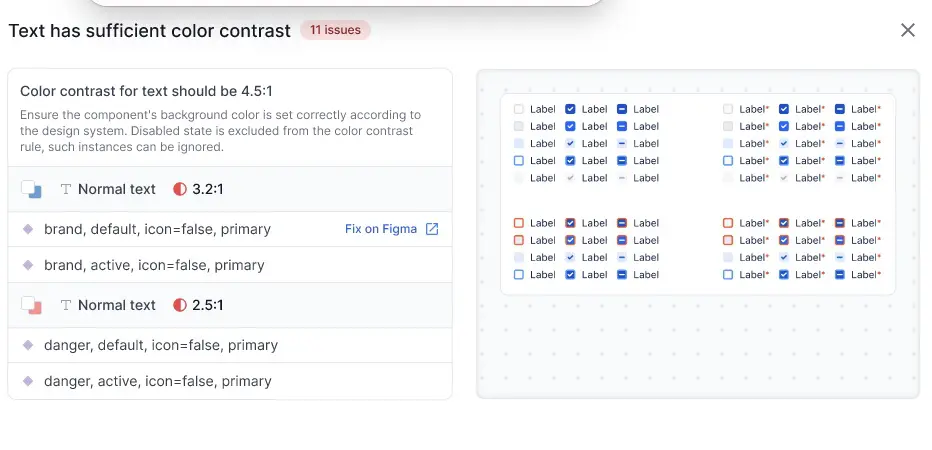
Click Fix on Figma to open the file on Figma and fix the issue.
Component scan tab in Reports
The component scan tab lists all the issues in the components.
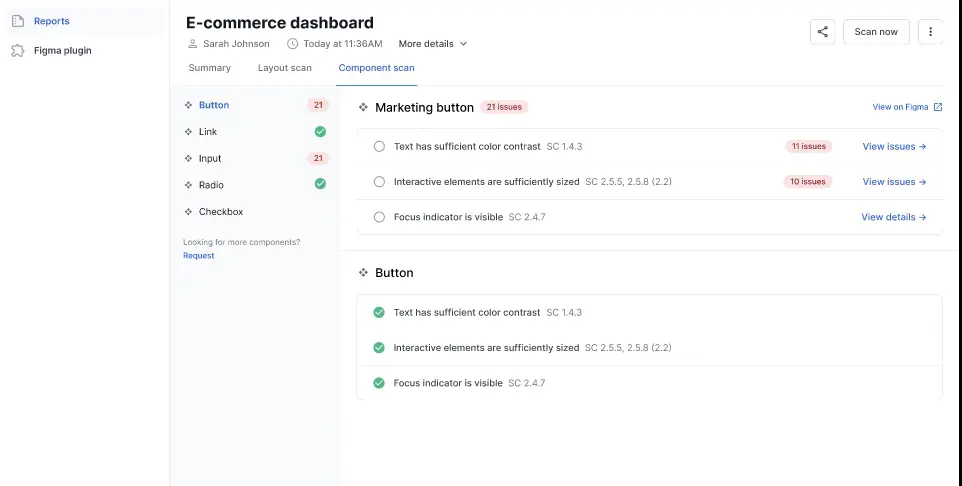
Click View issues against an issue to track more details.
Related links
We're sorry to hear that. Please share your feedback so we can do better
Contact our Support team for immediate help while we work on improving our docs.
We're continuously improving our docs. We'd love to know what you liked
We're sorry to hear that. Please share your feedback so we can do better
Contact our Support team for immediate help while we work on improving our docs.
We're continuously improving our docs. We'd love to know what you liked
Thank you for your valuable feedback!