
 Join our Discord
View your Automated tests page
Learn how to view the Automated tests page in BrowserStack Accessibility Testing.
The Automated tests page showcases all the reports generated by the automated tests in BrowserStack Accessibility Testing. This page groups the results of your automated accessibility reports into projects.
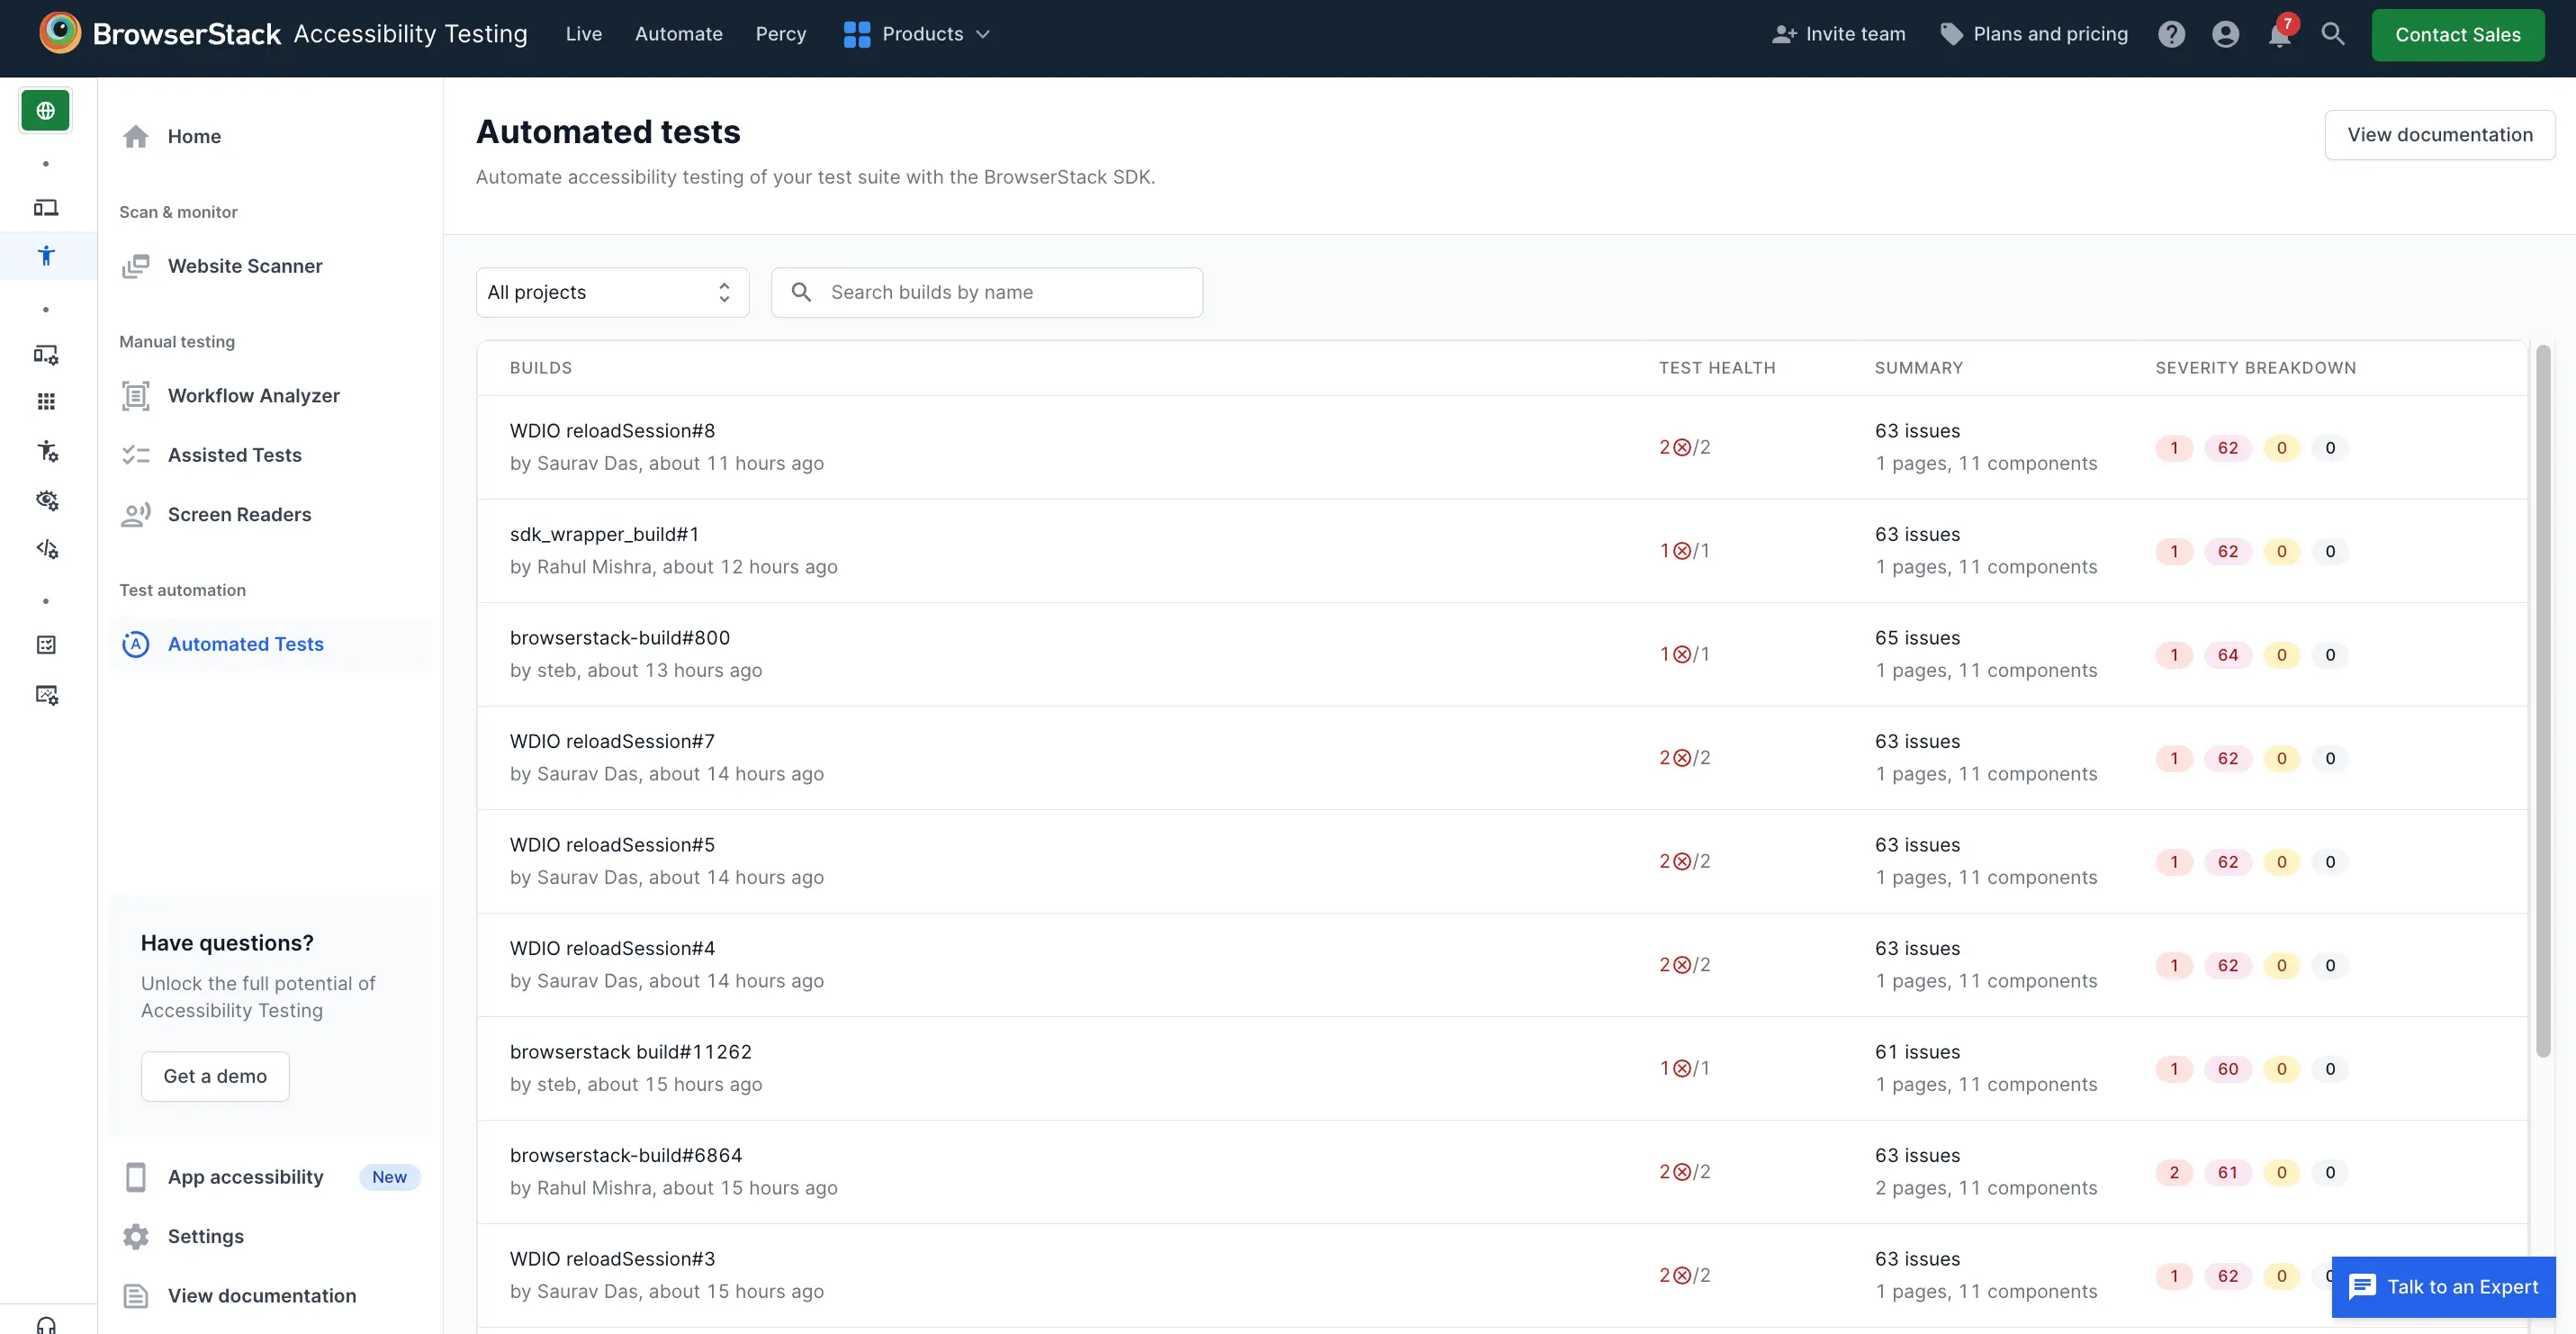
You can select a project and click a build to view automated test reports.
When you encounter an accessibility violation, click the issue to view more details. Click the specific component that has the accessibility issue to view additional information, which includes a snapshot of the webpage where the problematic component is clearly highlighted for easier identification.
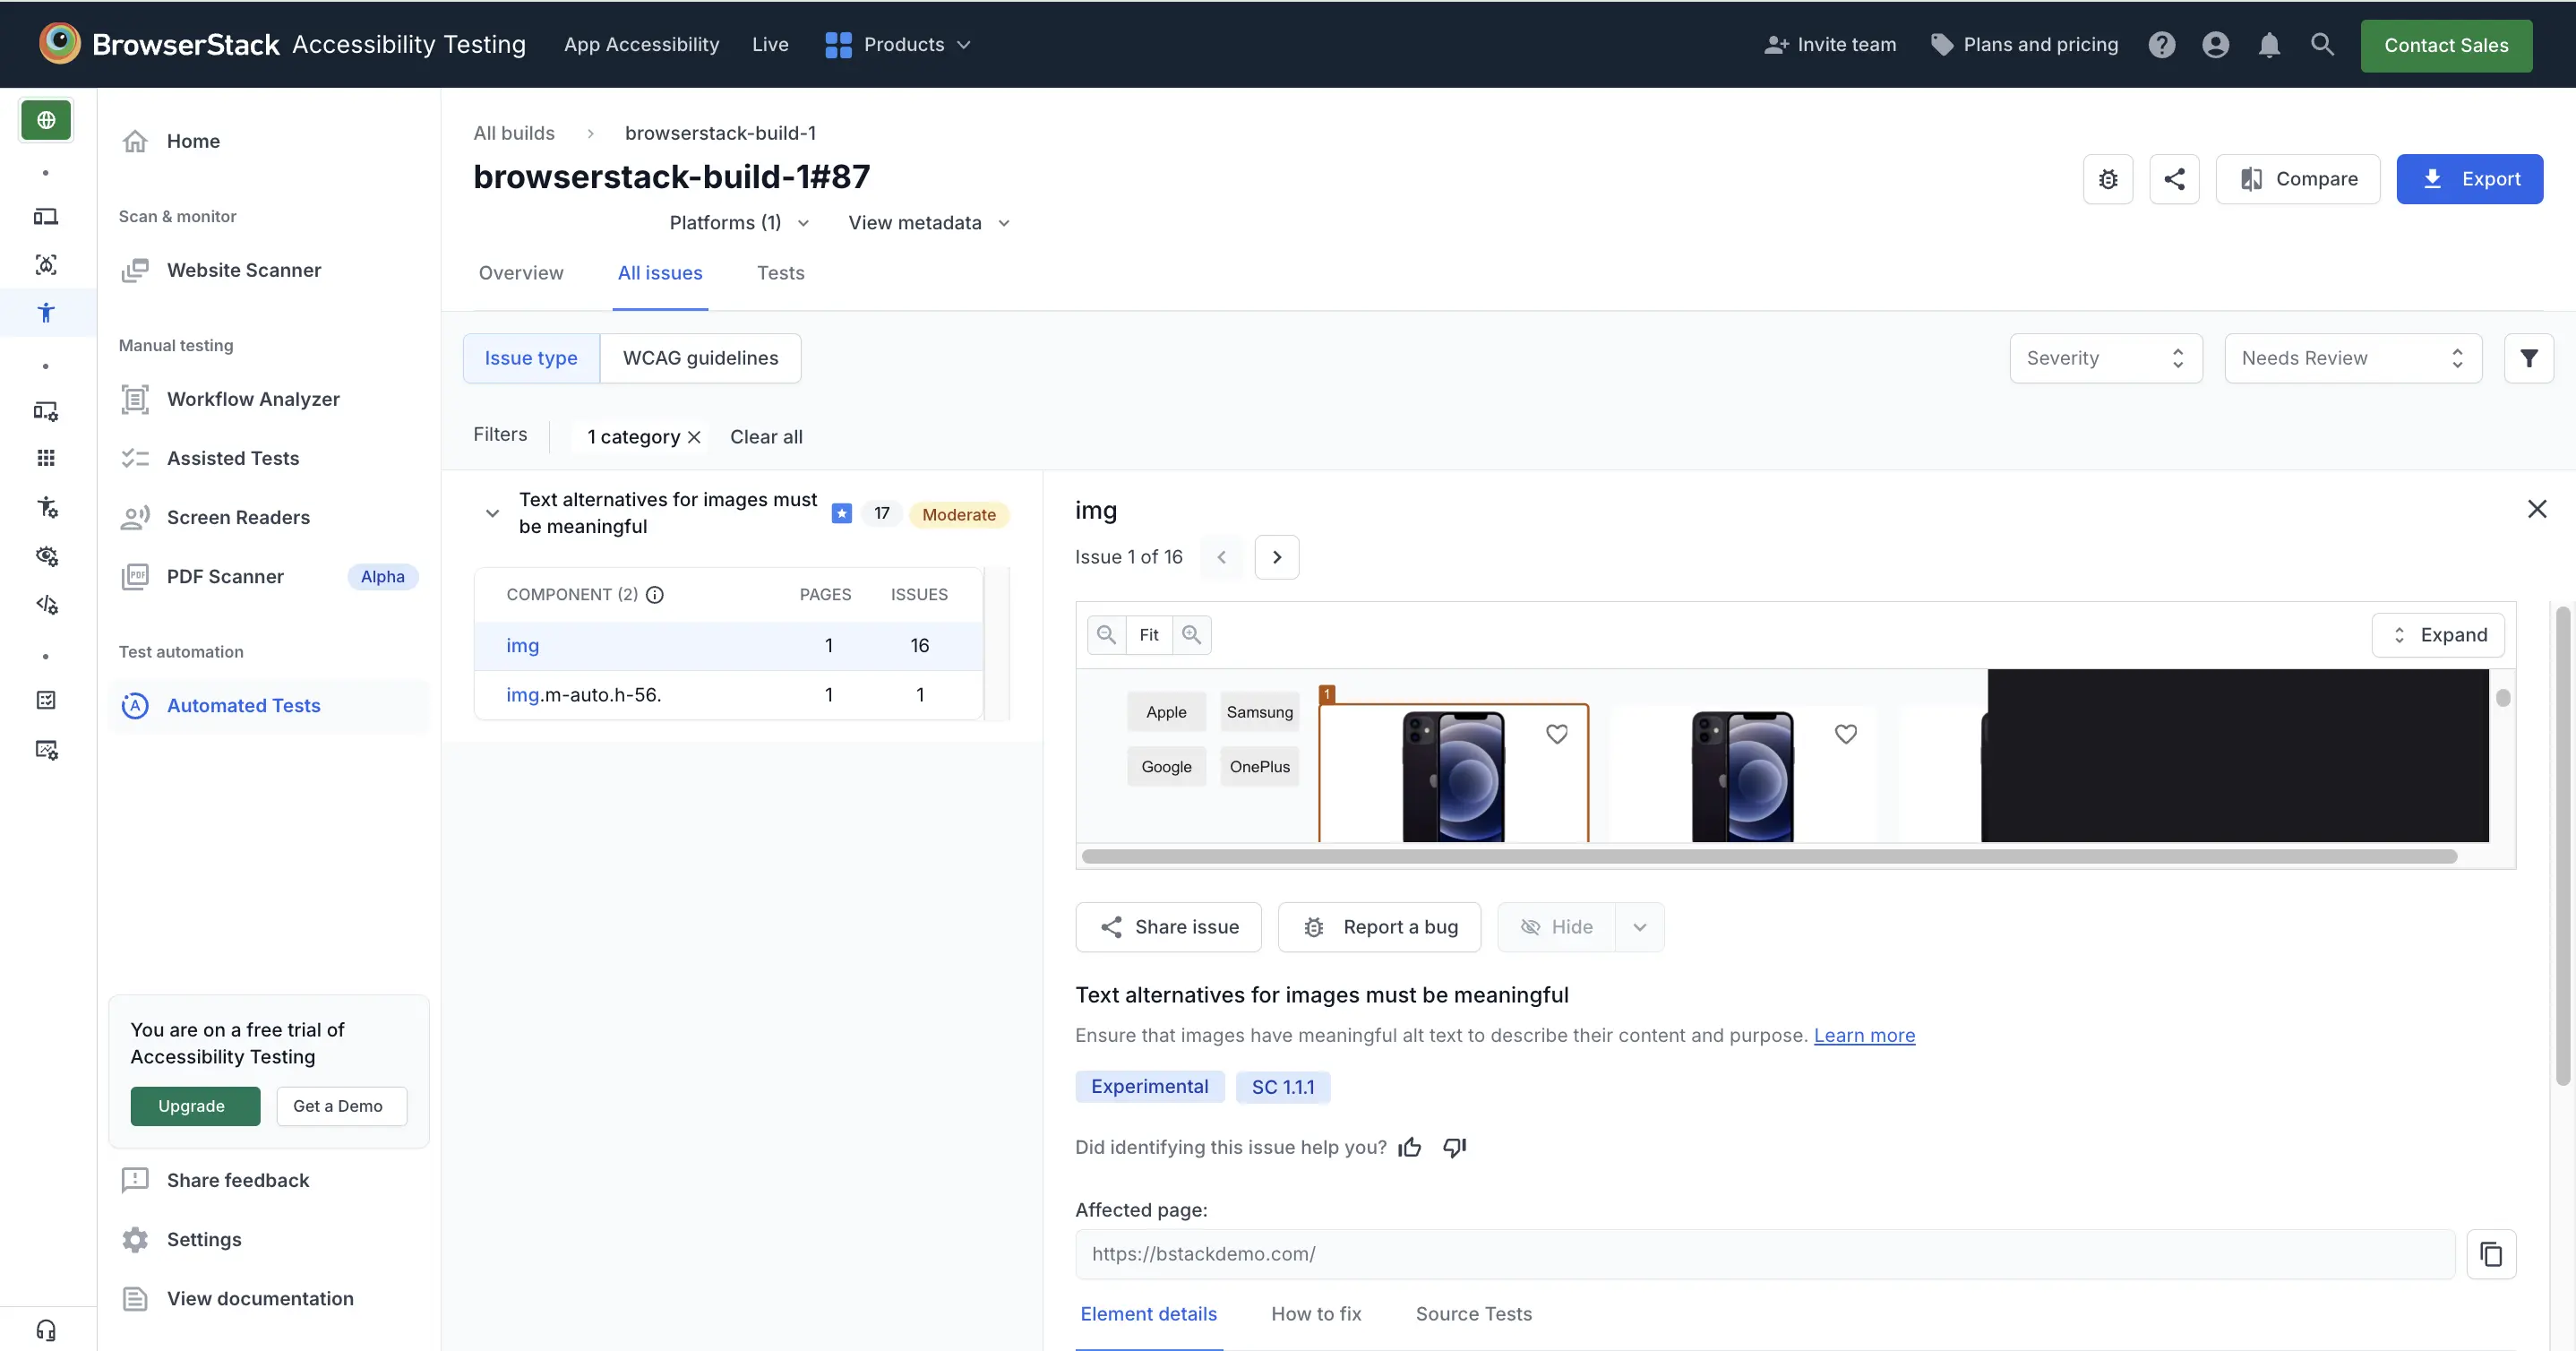
Issue screenshots are available only in paid plans and the free trial.
You must enable advanced scans to view screenshots of the component with the accessibility issue. They are available on Chrome and Edge.
Summary tab
The Summary tab is a collection of interactive graphs and widgets that detail the accessibility issues in your builds.
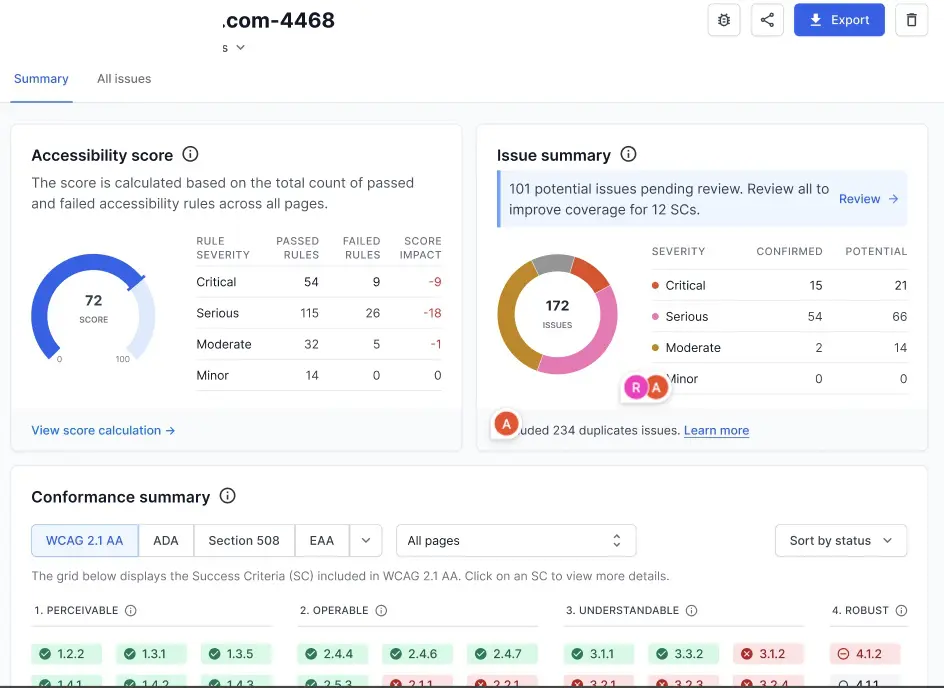
The following are the widgets in the Summary tab:
- Accessibility score: This metric provides an overall score representing the accessibility compliance level of your builds. The system calculates the score based on the number of issues found, their severity levels, and the total number of components scanned, giving you a quick way to track your accessibility progress over time.
- Issue summary: This donut chart classifies the accessibility issues in your builds according to their severity. You can view the number of issues that are Critical, Serious, Moderate, and Minor. This chart also includes a quick summary of the number of potential issues that need your review.
-
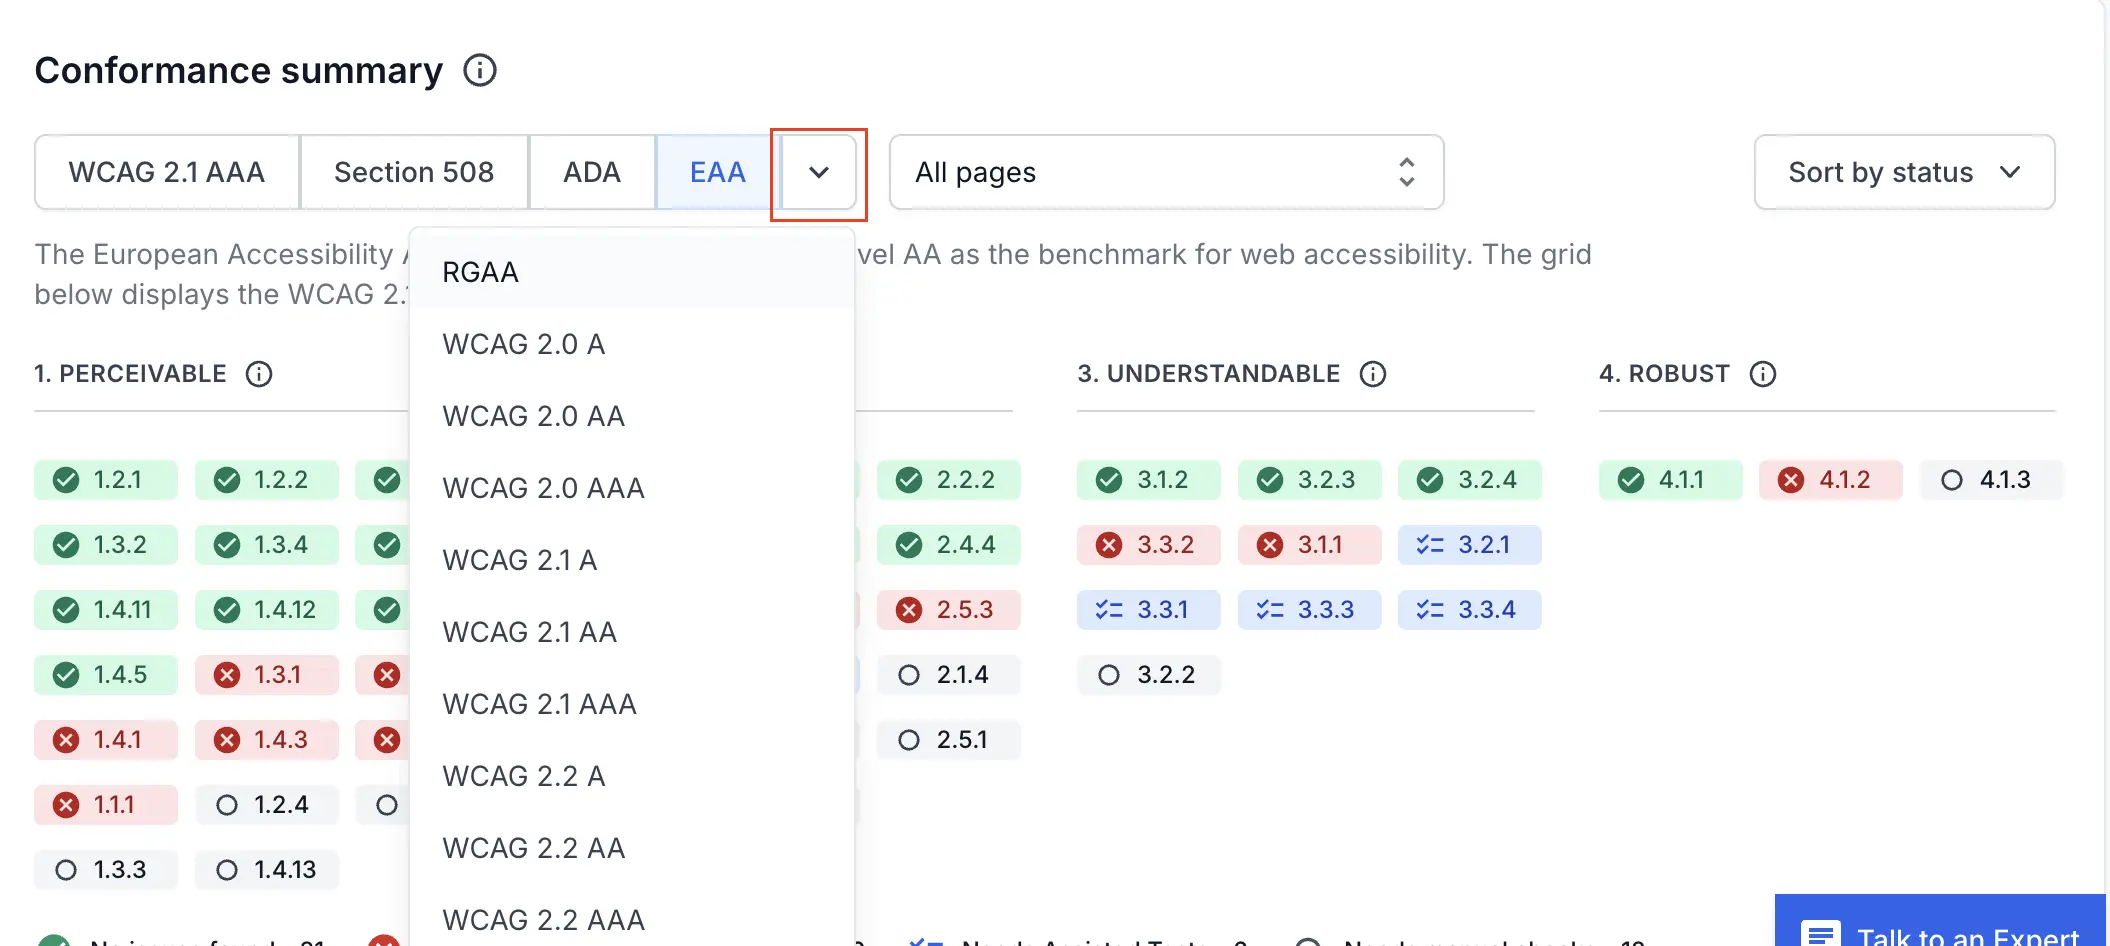
Conformance summary: This widget helps you understand the level of conformance of your website on a particular report against the following accessibility standards:
You can switch between the tabs to view conformance according to each guideline.
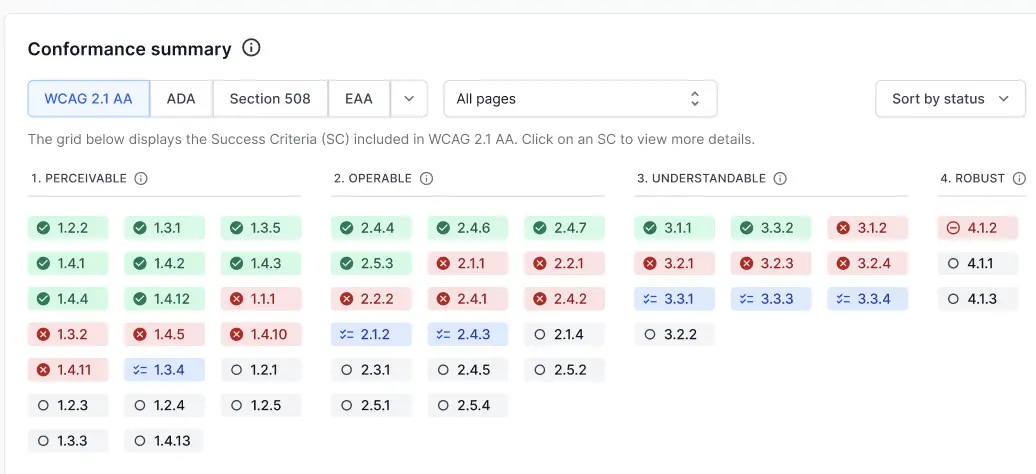
If you don’t find a guideline, you can click the drop-down menu to view all available conformance guidelines.
- Issue trend: This bar chart illustrates the timeline of accessibility issues in your build runs, providing a clear visualization of the trend in the number of issues over time. Use this chart to assess whether the accessibility issues in your builds are on the rise or decline.
- Accessibility health summary: This donut chart provides a quick summary of the outcomes of automated accessibility tests, summarizing the counts of tests that passed, failed, or were skipped.
- Health history: This bar chart visually represents a timeline detailing the count of tests categorized as passing, failing, or skipped across various build runs.
- Affected components: This widget lists all the affected components that show accessibility issues. You can use this list to prioritize the components that cause the most number of accessibility issues.
- Issues by category: This widget lists the most common types of accessibility issues in your builds. You can use this widget to identify which type of accessibility issues impact your builds.
- Affected pages: This widget lists the URLs in your builds with the most number of accessibility issues. You can use this list to prioritize the pages that need the most attention.
- Potential issues: This widget shows the number of accessibility-related issues in your builds that need review. When you decide whether a flagged issue is valid or not, you can also choose to save your decision for future reports.
All issues tab
The All issues tab lists the de-duplicated version of accessibility issues across all test cases in your build by Issue type and WCAG guidelines.
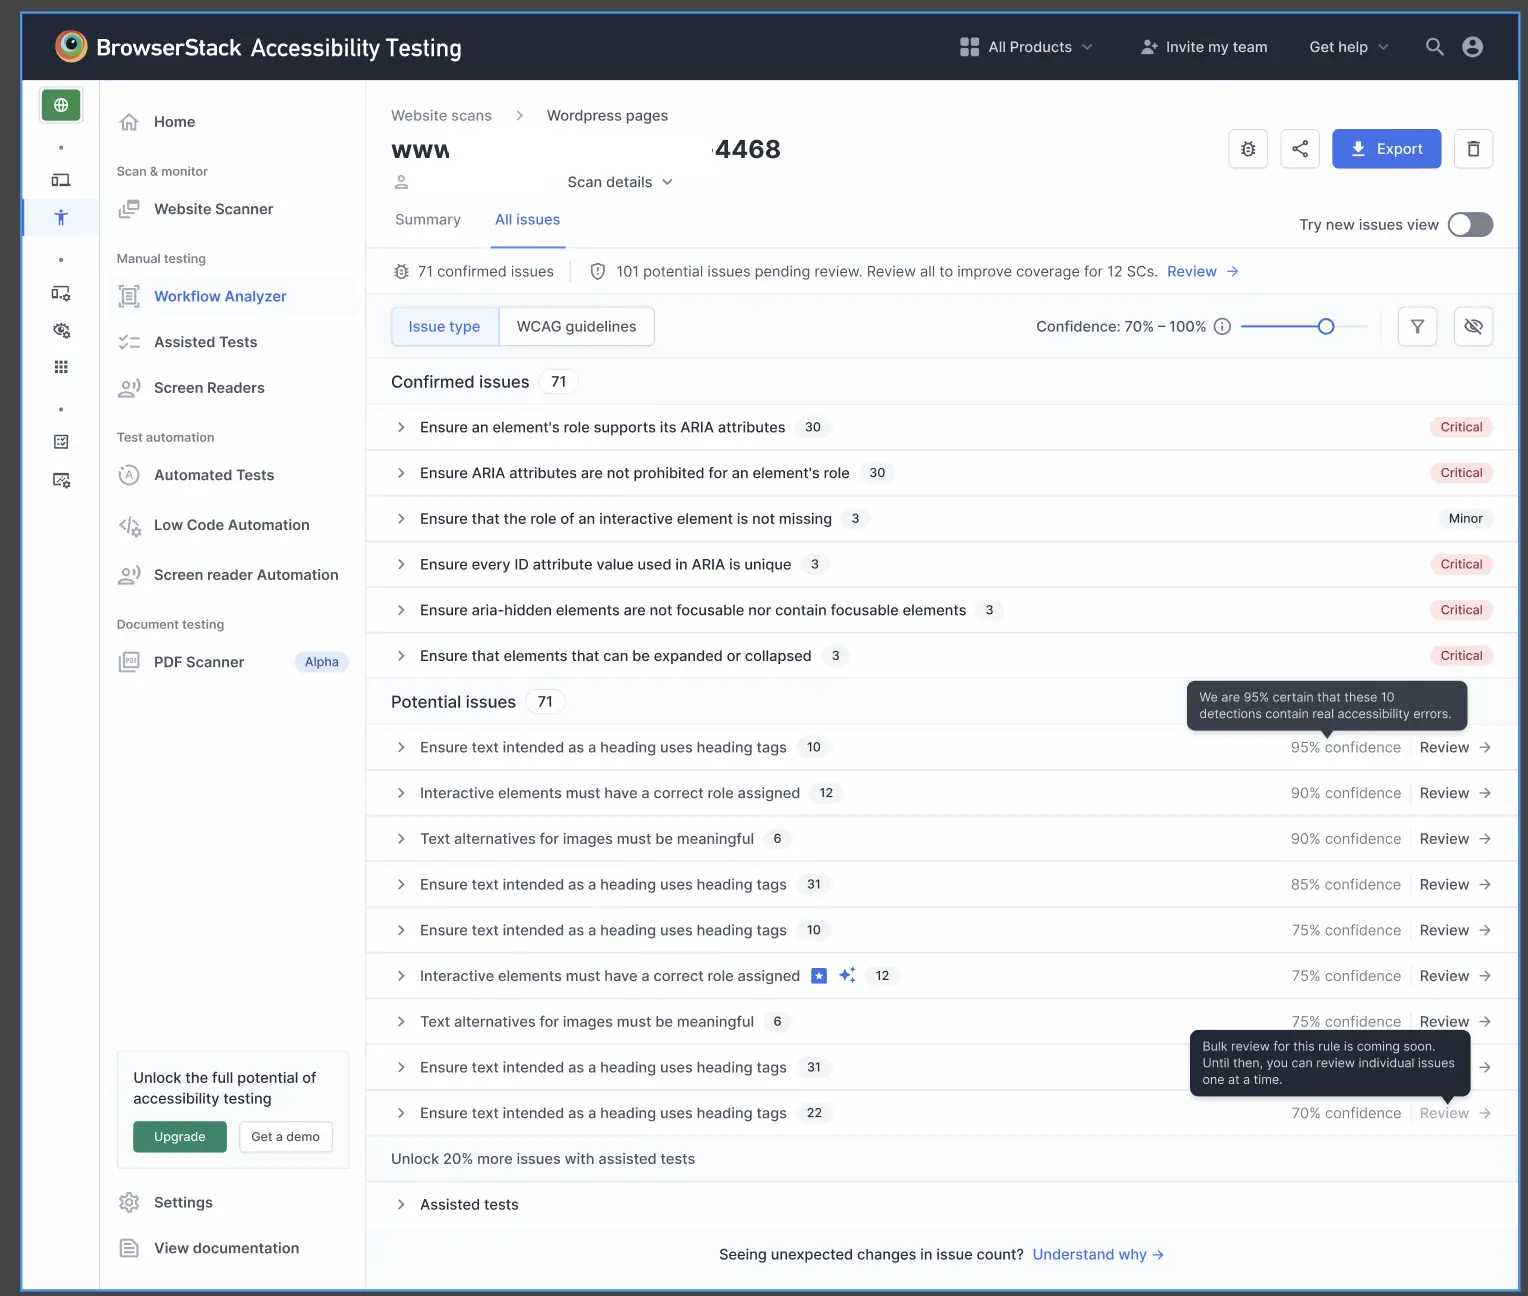
The All issues tab has two subtabs:
- Issue type
- WCAG guidelines
You can view issues by the type of issues or according to WCAG guidelines in the WCAG guidelines tab. Viewing issues by WCAG guidelines can be helpful in creating a VPAT (Voluntary Product Accessibility Template) report.
Table view and split view
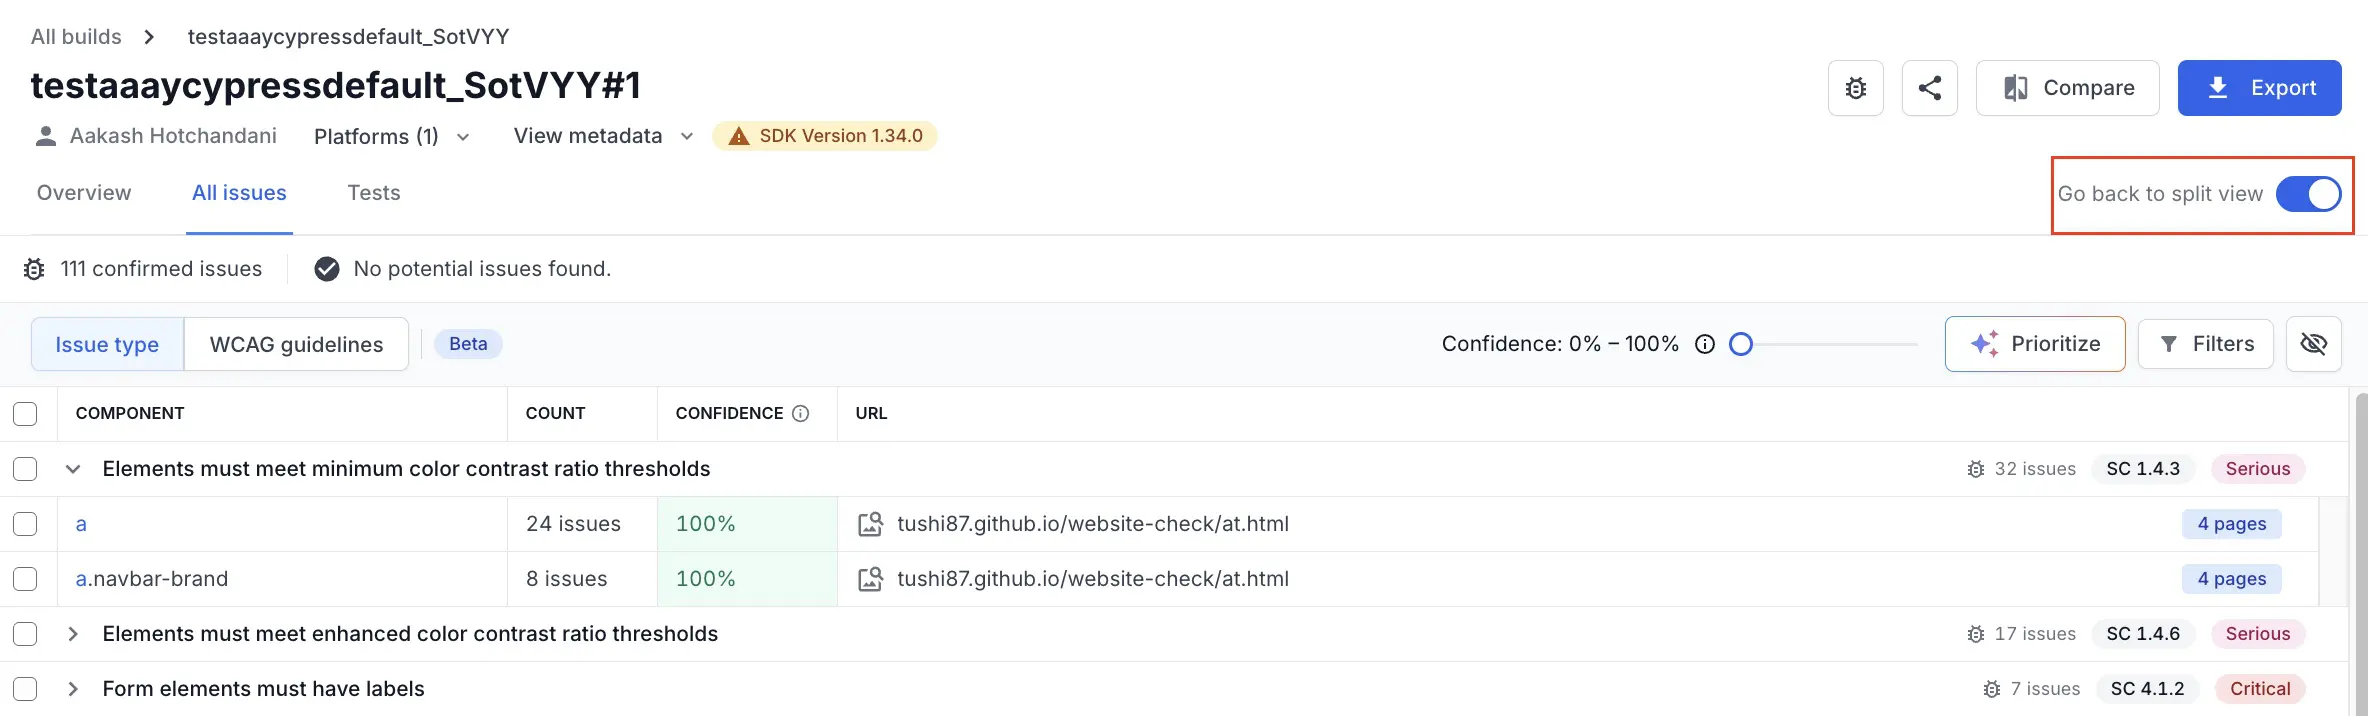
The All issues tab has two views. You can click the toggle Switch to table view or Go back to split view to alternate between the two views.
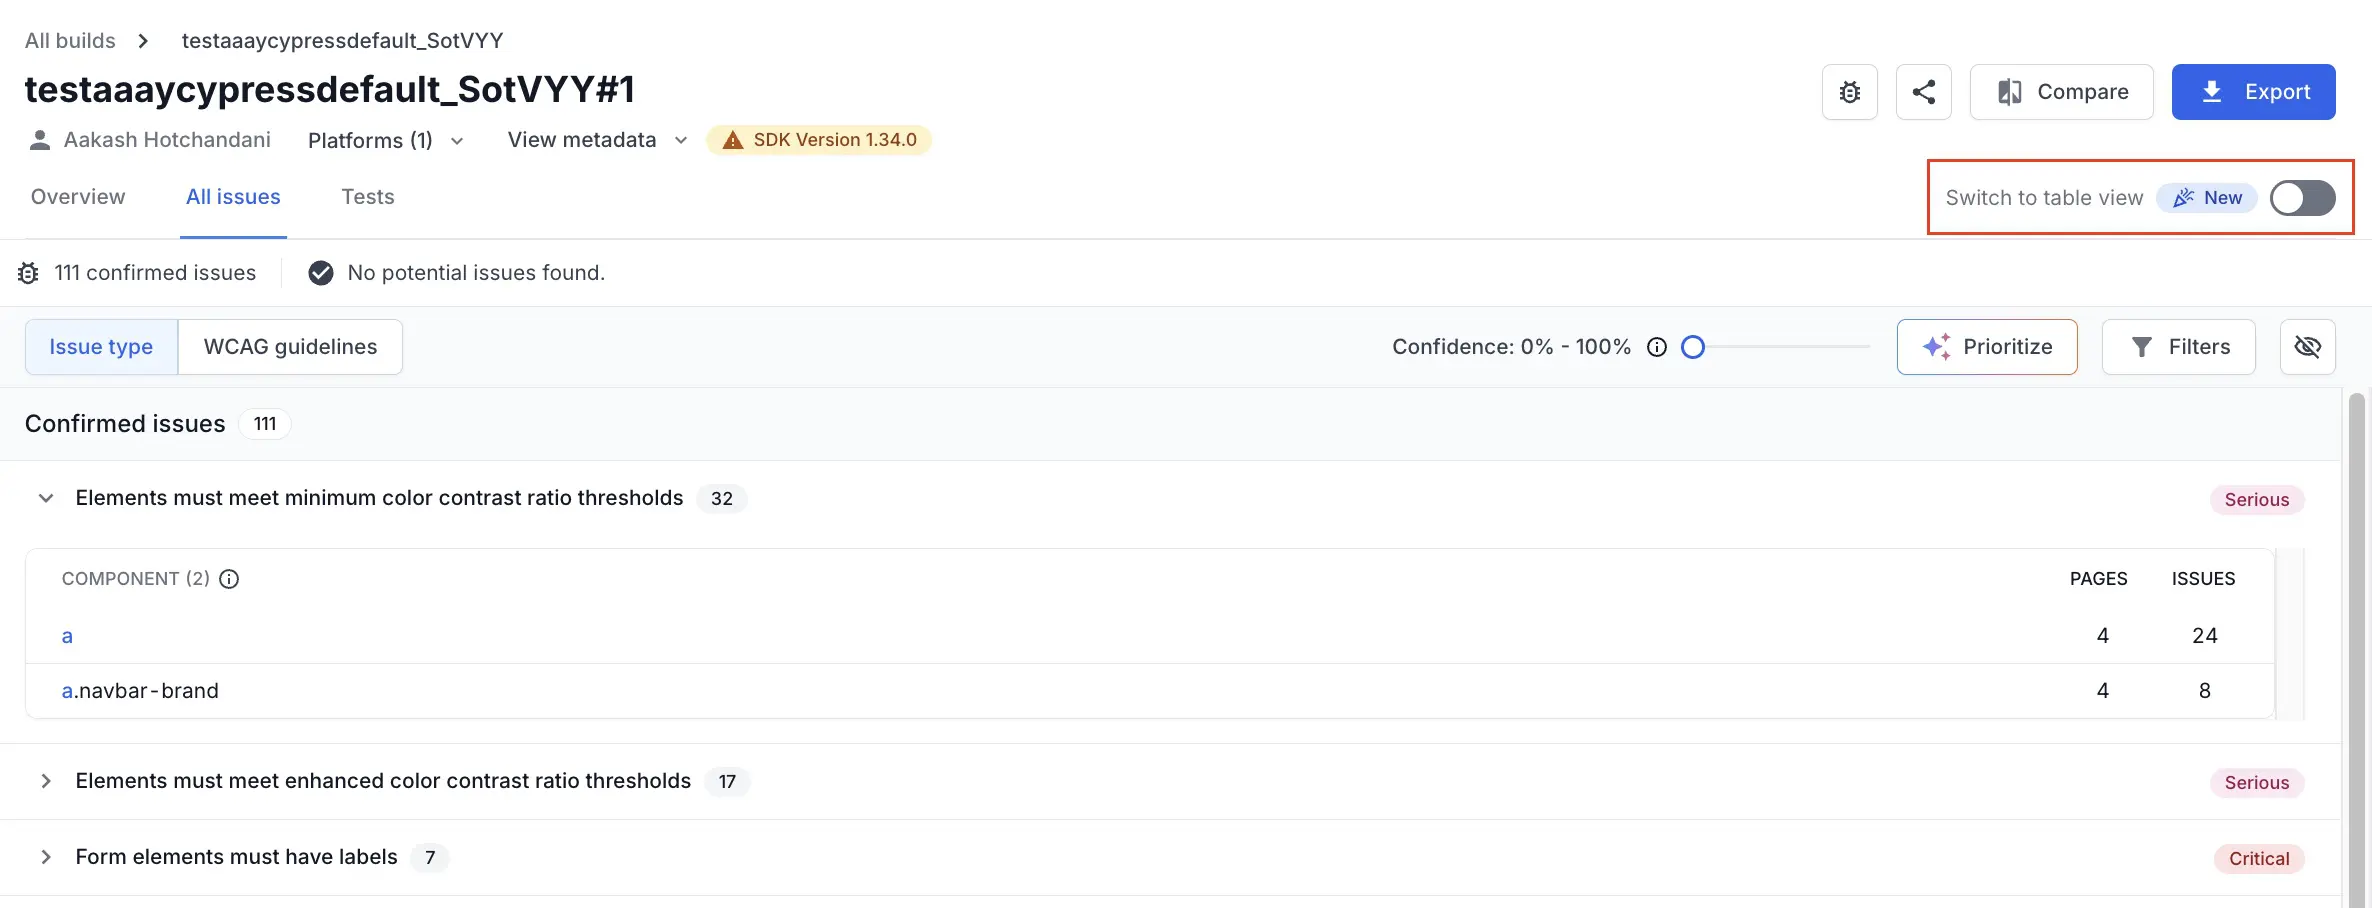
The split view lists all issues under Confirmed issues and Potential issues.
The table view lists all issues in a table with the following columns:
- Component: The component for which the accessibility issue was detected.
- Count: The number of accessibility issues identified for the component.
- Confidence: The confidence level of the issue detection.
- URL: A URL to the page with the issue.
Multiselect actions in table view
In the table view, you can select multiple issues and perform bulk actions.
To do this, select the checkboxes next to the issues you want to act on, and then click the action button.
The following multiselect functions are available:
- Export: Downloads a CSV report of the selected issues to your system.
- Hide: Hides the issues. Users can hide issues in their own reports. Admins and Owners can also hide issues in reports created by other users.
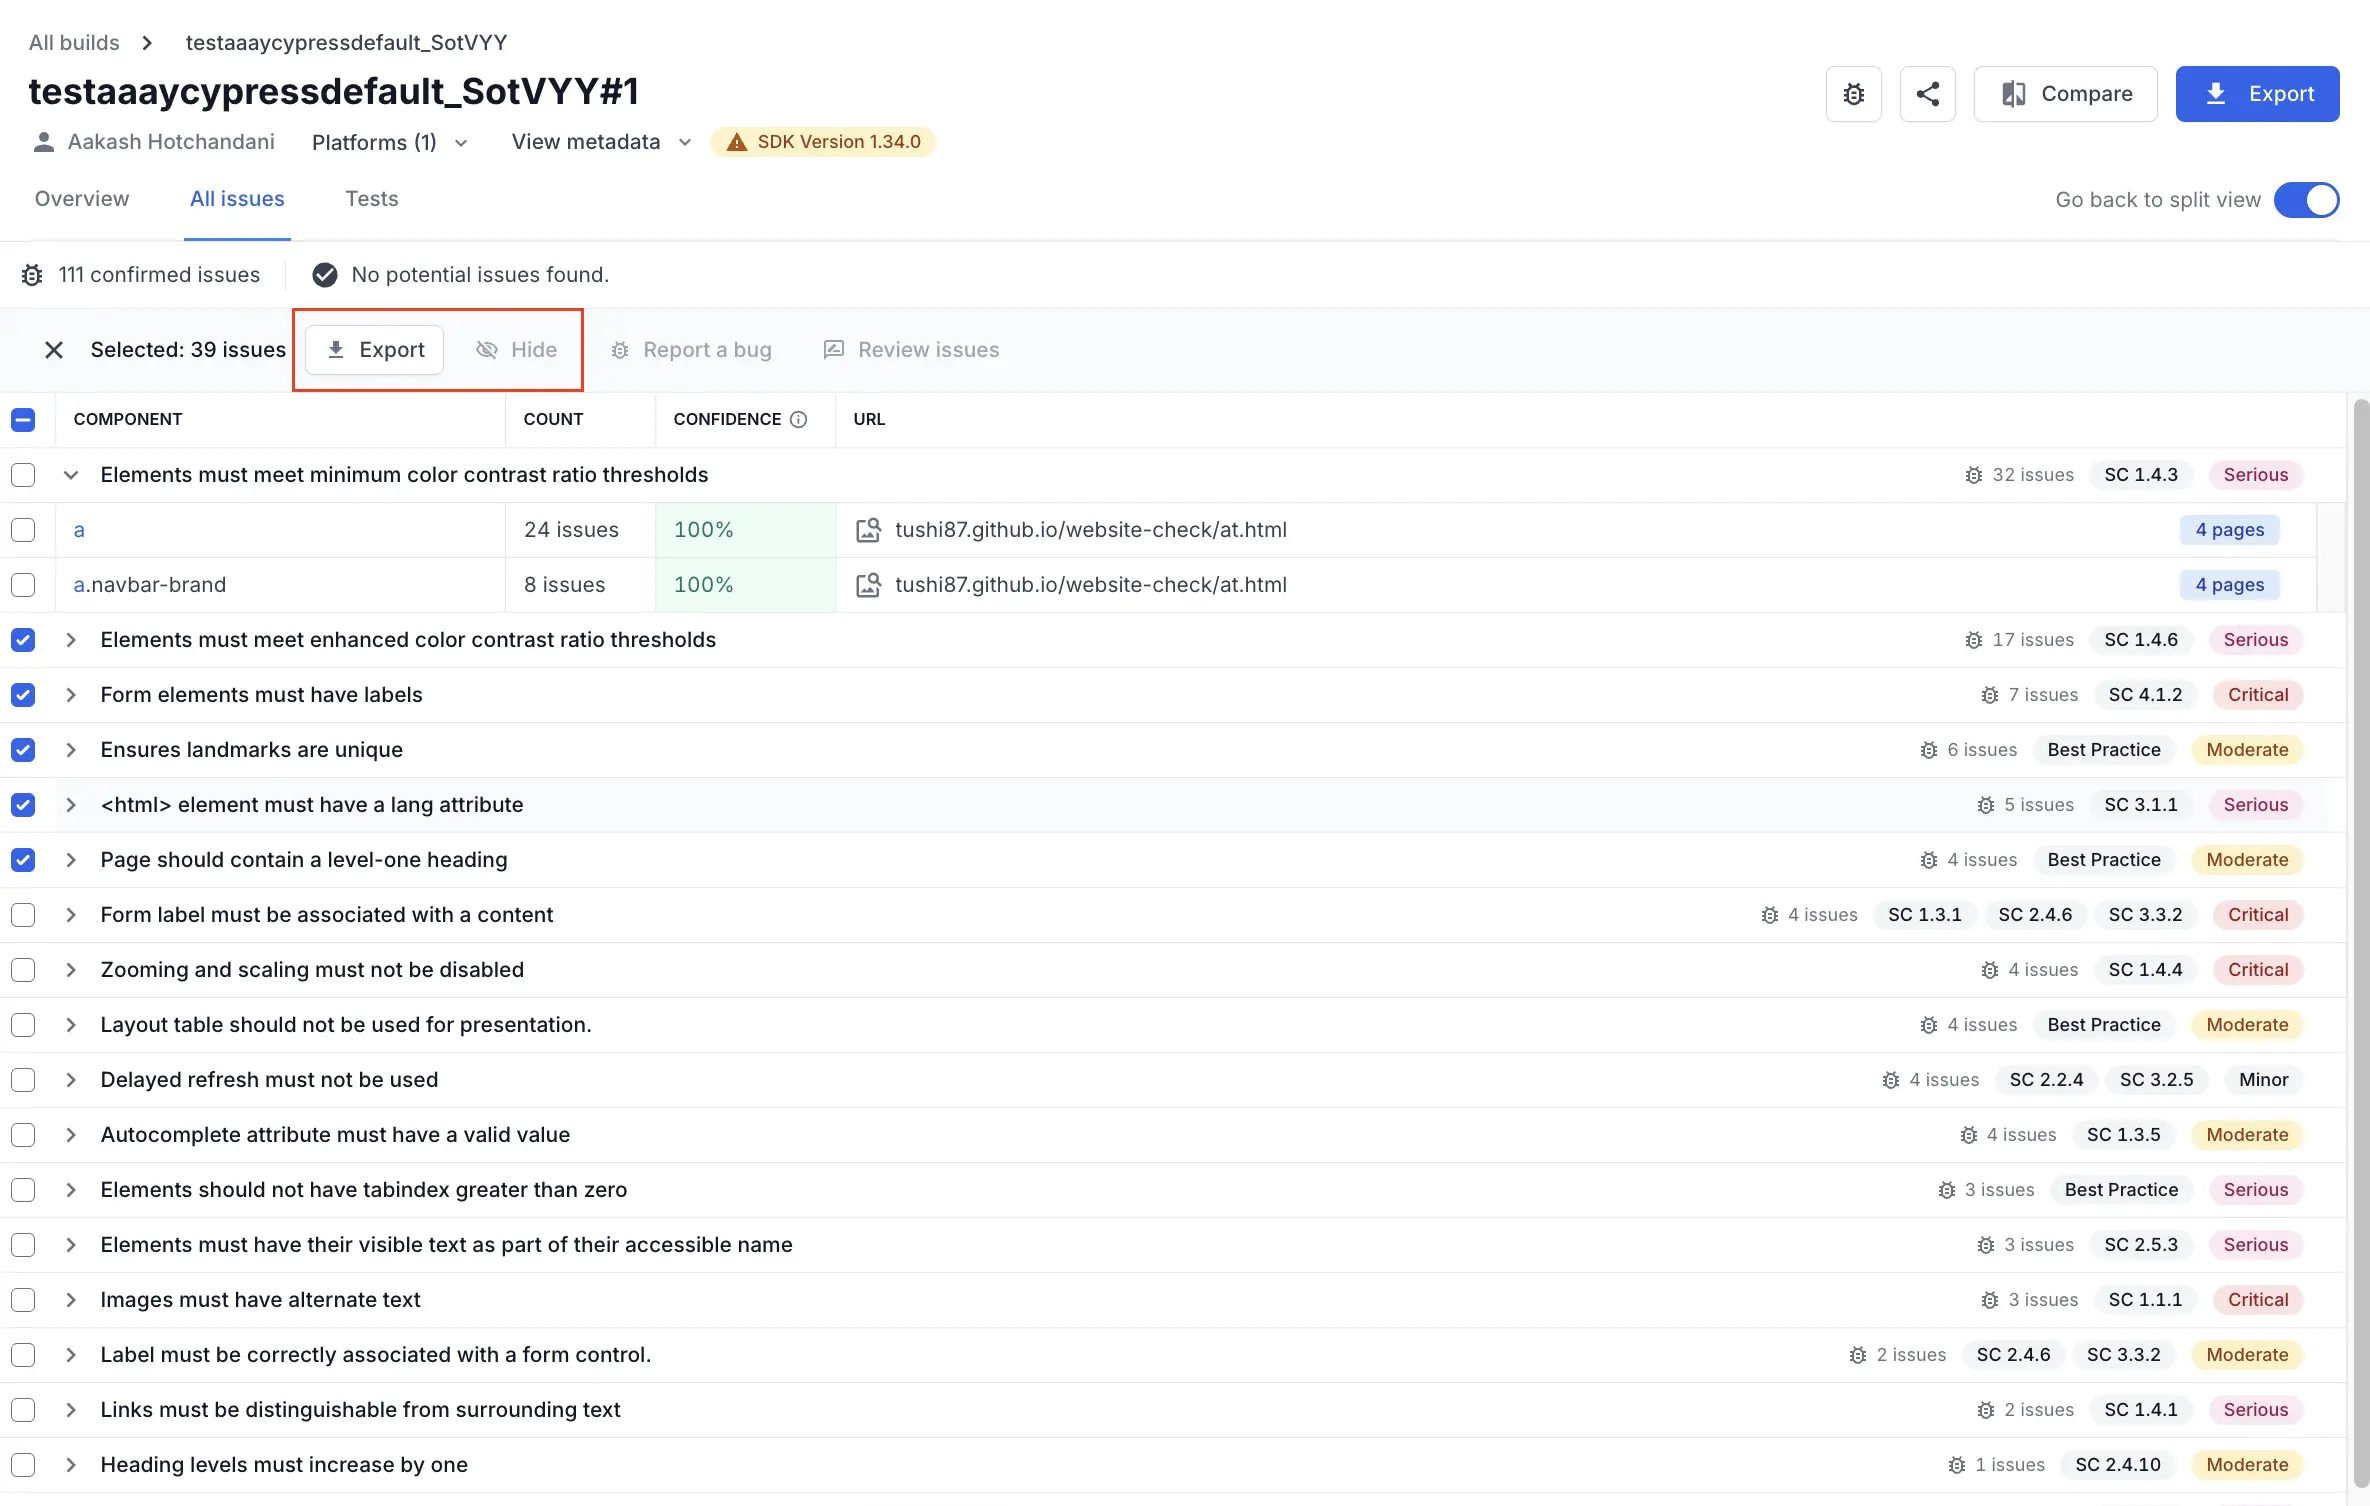
The Report a bug and Review issues features will be available in multiselect actions soon.
View issue details in table view
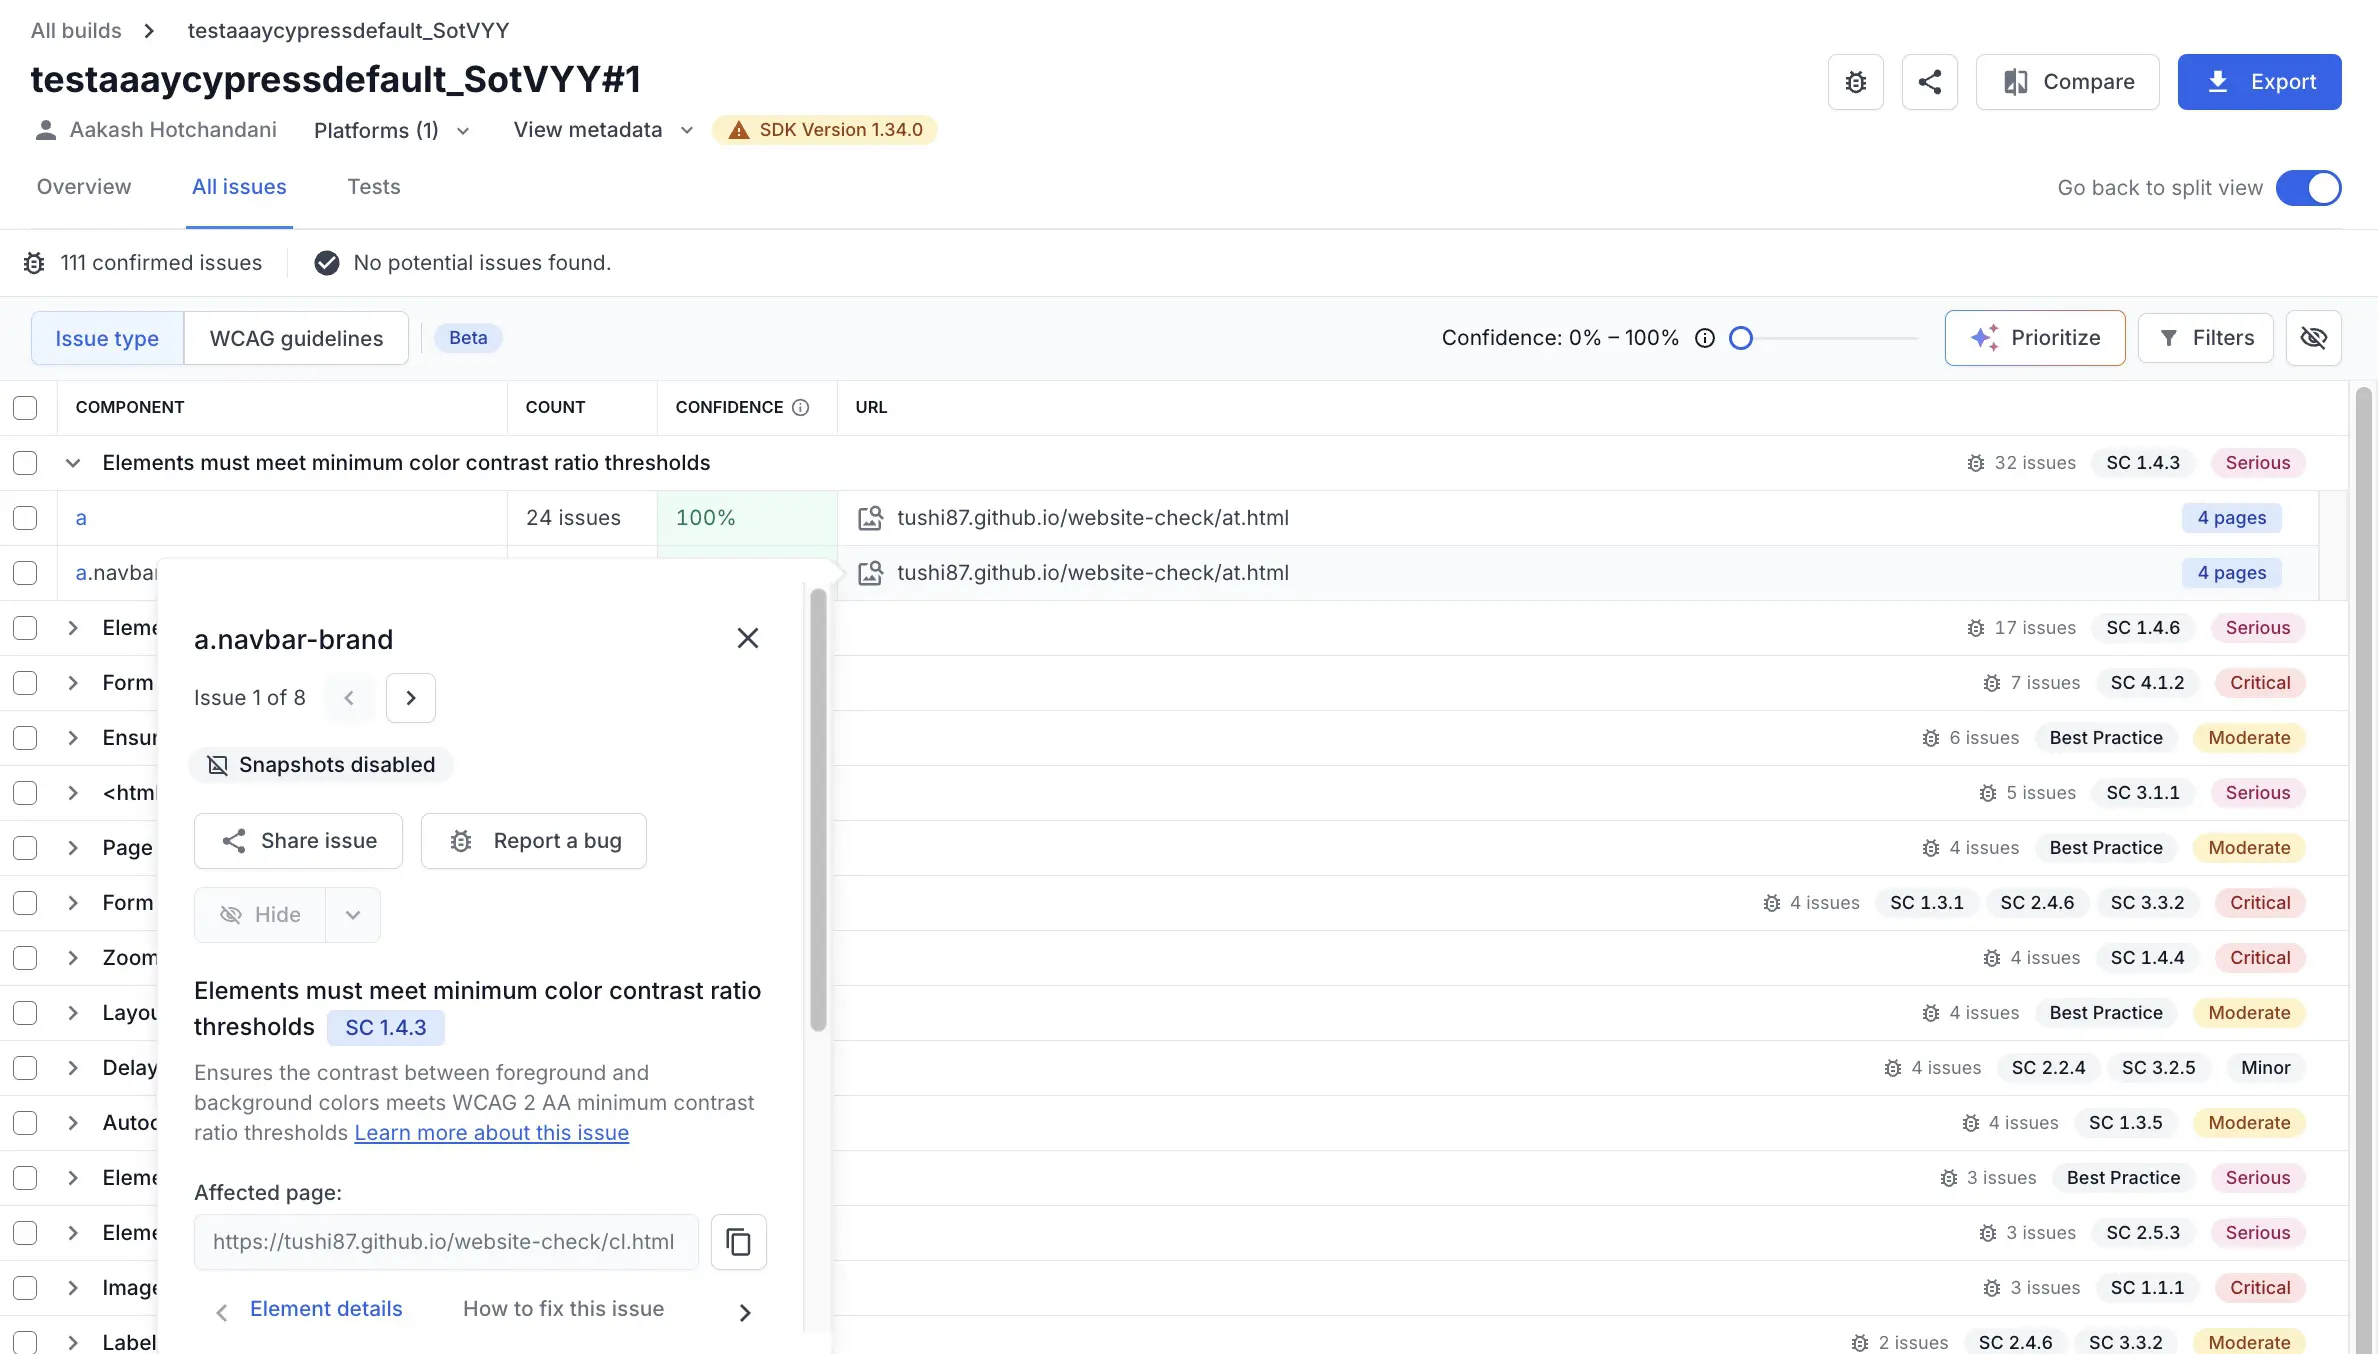
You can view more information about an issue by expanding it. These details include the component name, count of issues, the confidence level of the issue detection, and URLs of the page with the issue. Click the URL to view more details about the issue in the same table view.
Source tests for duplicate issues
In the All issues tab, the Source test column shows the source tests only for the primary issue in each group.
To view the source tests for a specific duplicate:
- Click View duplicates next to a primary issue.
- Expand the duplicate issue to see its associated source tests.
You can ungroup a duplicate issue from the primary group if needed. For more information, refer to the Issue groups.
Issue type tab
The Issue type tab groups accessibility issues under Confirmed issues and Potential issues.
- Confirmed issues: Accessibility issues that BrowserStack Accessibility Testing can detect with 100% confidence.
- Potential issues: More complicated cases in which case-specific nuances make it difficult for the tool to have 100% confidence in declaring it as an issue.
Accessibility Testing assigns a confidence level to every potential issue. Move the Confidence slider to show potential issues above a chosen confidence level.
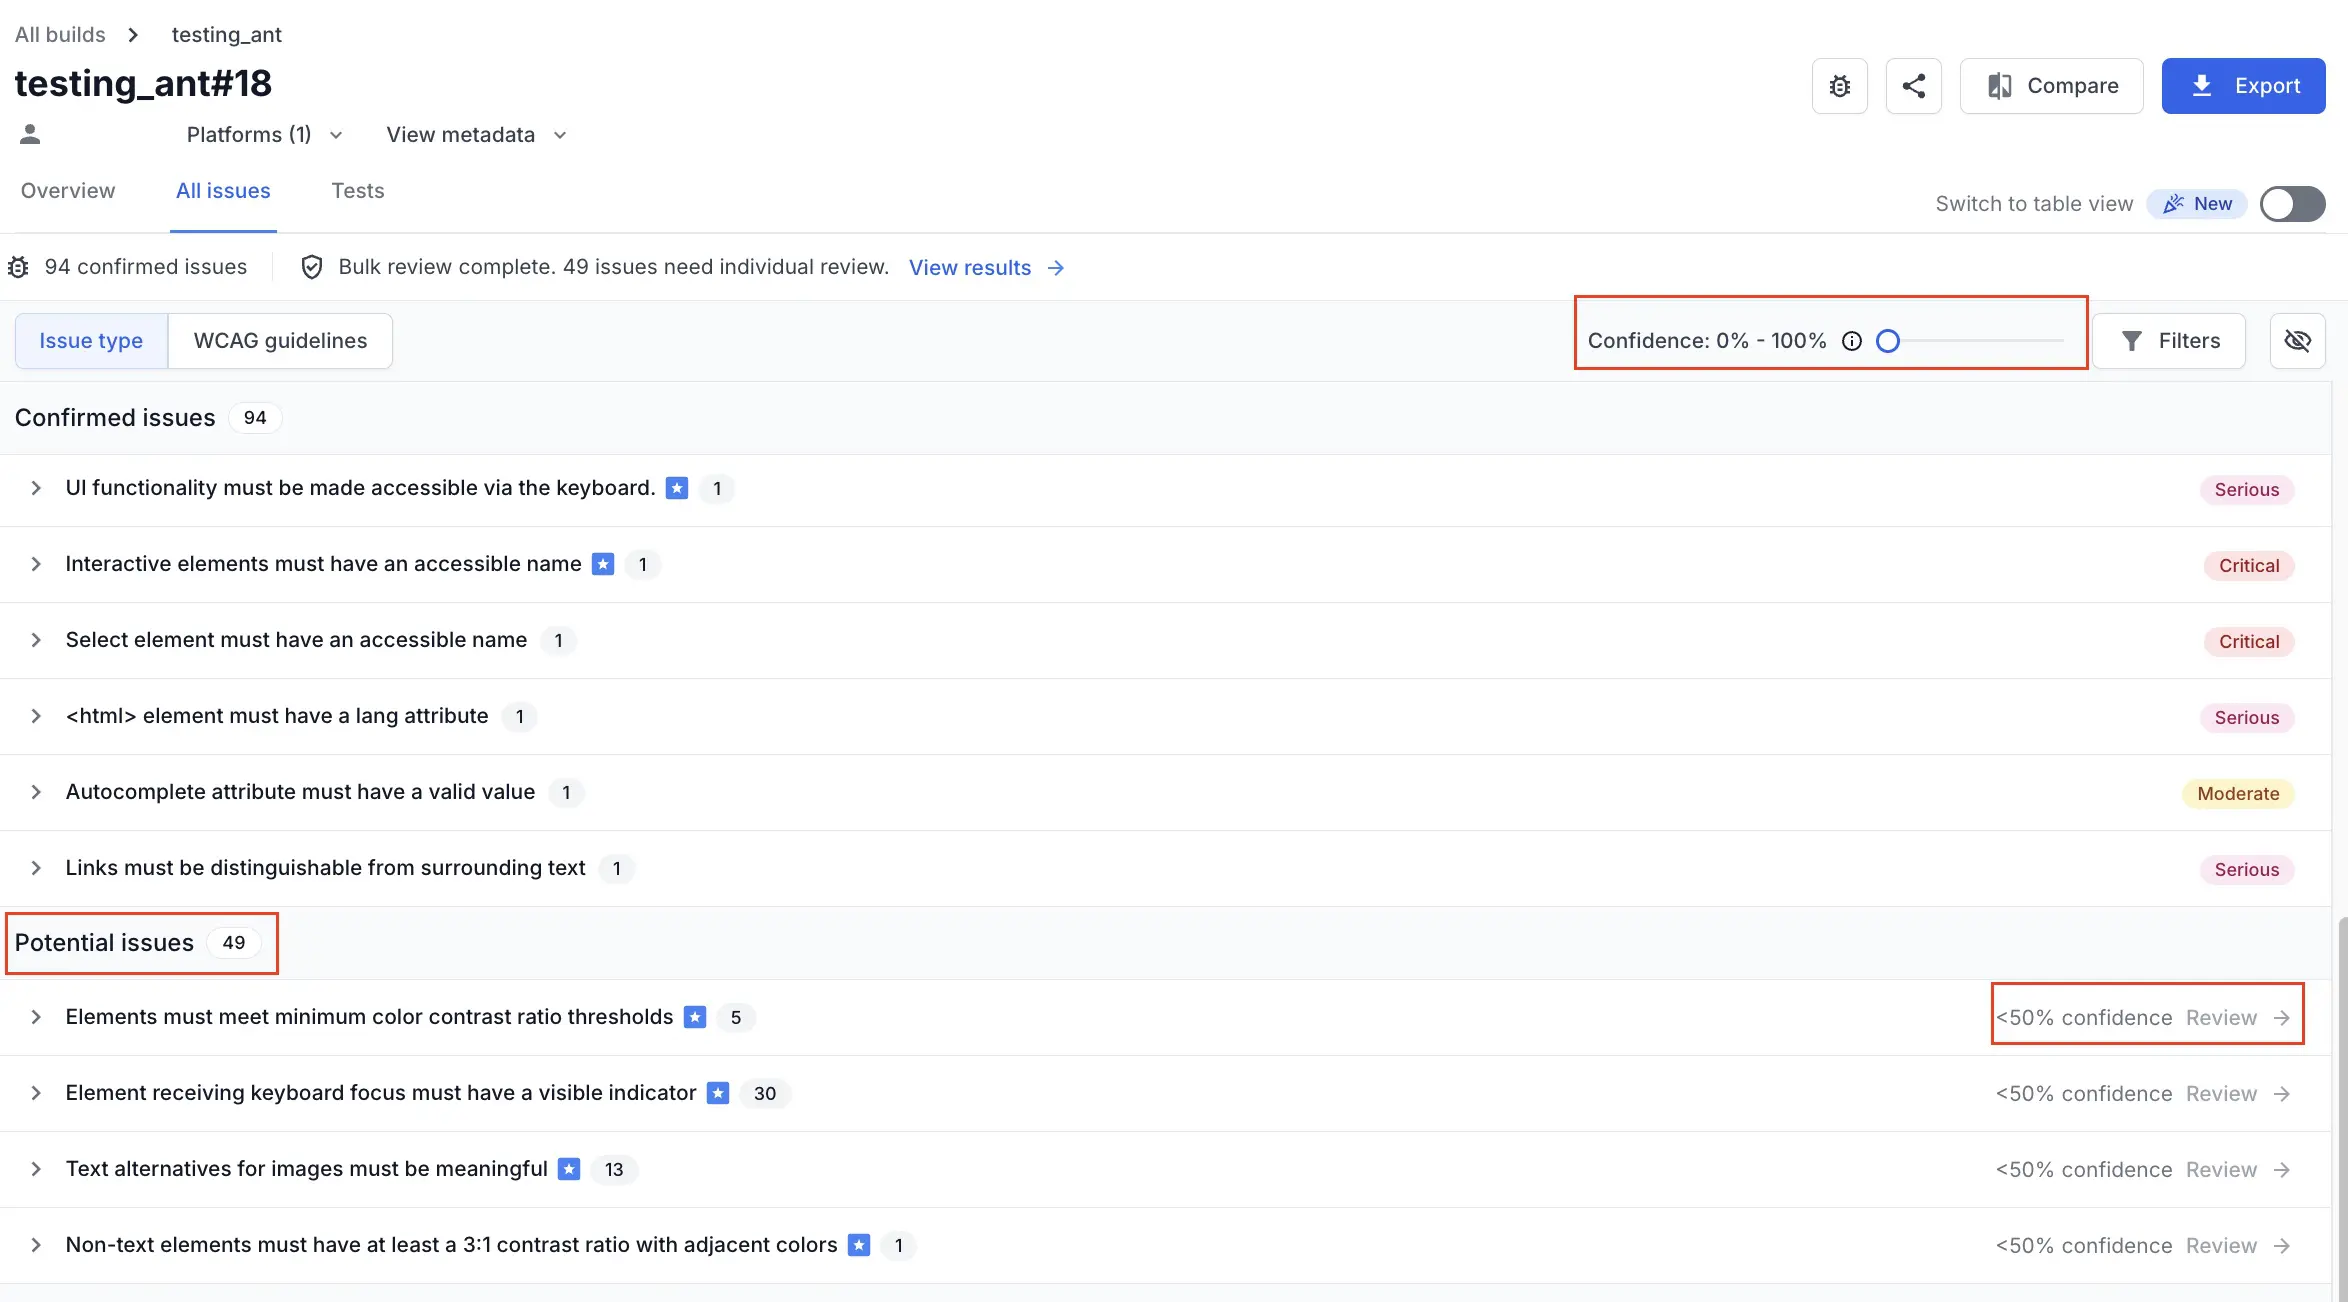
The issues classified under Confirmed issues also include a severity classification. You can expand a confirmed issue to further investigate and resolve the components with accessibility violations.
The issues tab also lists the number of confirmed issues and the number of potential issues right on top so you can track them.
To review potential issues in bulk and confirm or persist them, see Bulk review potential issues.
Share Automated tests reports
To share a report, click Share on the top-right of the report. A two-tab window appears.
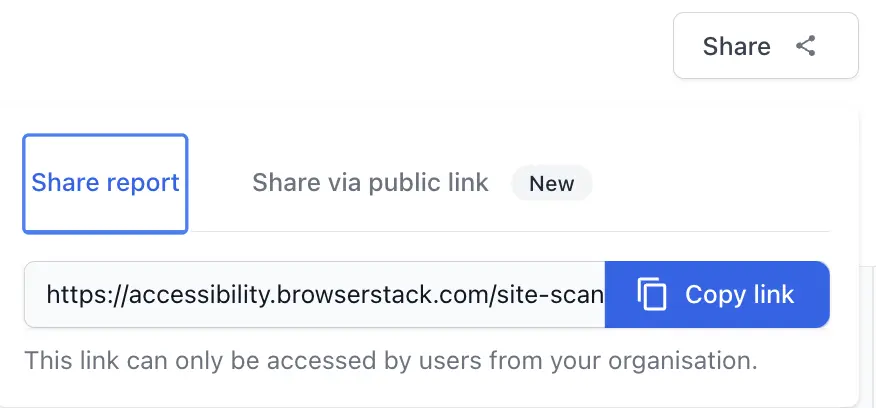
To share the report internally with users who have a BrowserStack account, click Copy link on the Share report tab, and share the link as appropriate.
To share the report externally with users who do not have a BrowserStack account, enable public link on the Share via public link tab.
Related topics
We're sorry to hear that. Please share your feedback so we can do better
Contact our Support team for immediate help while we work on improving our docs.
We're continuously improving our docs. We'd love to know what you liked
We're sorry to hear that. Please share your feedback so we can do better
Contact our Support team for immediate help while we work on improving our docs.
We're continuously improving our docs. We'd love to know what you liked
Thank you for your valuable feedback!