
 Join our Discord
Custom dashboards for Accessibility Testing
Learn what custom dashboards are, why to use them, and how to create, edit, clone, export, and share them.
Custom dashboards help you get an idea about the overall accessibility health of your digital assets without browsing through multiple dashboards. Using custom dashboards, you can also track the trend of how accessibility health has been improving or depleting on your assets.
Custom dashboards are available only on the Accessibility Ultimate and Accessibility Automate plans.
Why use custom dashboards?
You can consolidate accessibility results from Workflow Scanner, Website Scanner, Automated tests, Assisted tests, and Low Code Automation reports using custom dashboards.
Custom dashboards built for specific purposes improve decision-making by providing an easy-to-understand representation of accessibility on your webpages. The following are a few benefits of using custom dashboards in Accessibility Testing:
- Highlight emerging risk (spikes in critical violations) before release cutoffs.
- Track progress toward accessibility conformance (WCAG or RGAA) targets and internal SLAs.
- Identify pages that are most affected.
- Provide leadership and stakeholders with an at-a-glance health summary without digging into raw scan results.
Create a custom dashboard
You can create a custom dashboard in a few steps:
- Navigate to Accessibility Testing → Custom Dashboards → New dashboard.
- Enter a Dashboard name that clearly states the dashboard’s purpose (for example, “Accessibility issues in most visited pages”).
- Select a Time Frame.
- To select tests, you can use filters like Test type (Automated Tests, Website Scan, Workflow Scan, Assisted Test, and Low Code Automation Reports), User, Team, Accessibility Standard (WCAG or RGAA), Advanced Scan Setting, and Potential Review Setting.
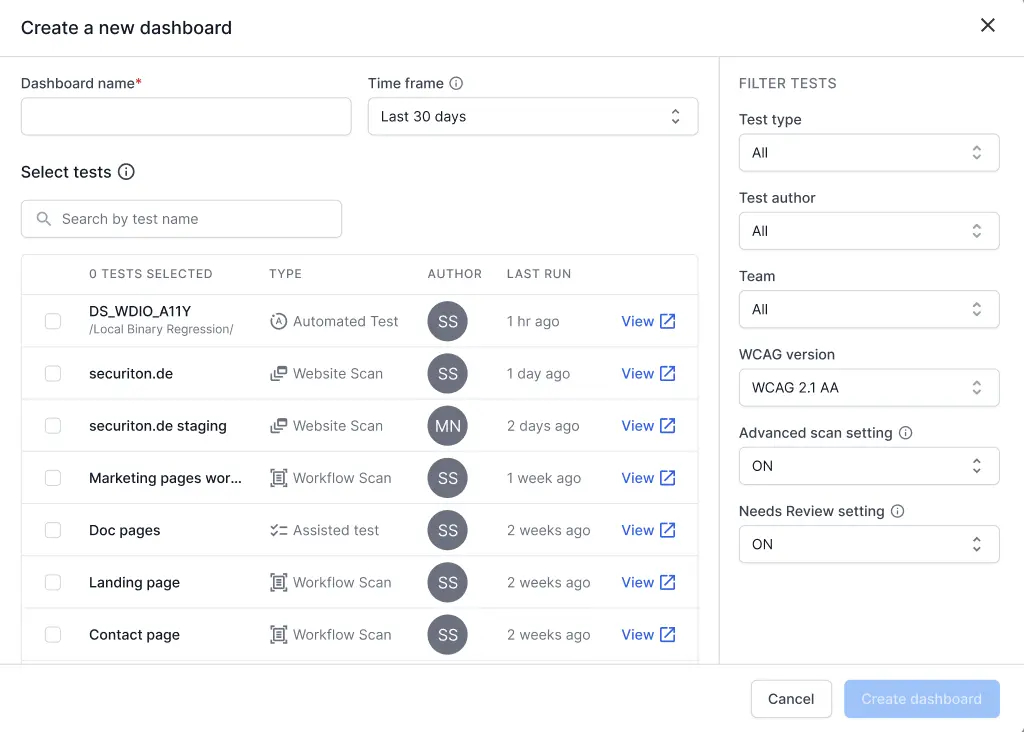
- The tests are populated in the window. For Website Scanner tests and Automated Tests that are recurring, only the latest run is listed. If needed, you can click View against any test to view it in detail.
- Select the tests that you want to include in your custom dashboard.
- Click Create Dashboard.
Your dashboard is available under the Dashboards list and starts populating with current scan data.
You can consolidate reports with different Advanced Scan and Potential Review settings in the same dashboard. However, the accessibility standard and time frame must be the same across all reports included in a dashboard.
Edit a custom dashboard
You can edit an existing custom dashboard to change its tests, name, or time frame.
- Navigate to Accessibility Testing → Custom Dashboards.
- On the dashboard you want to edit, click the Edit option from the actions menu.
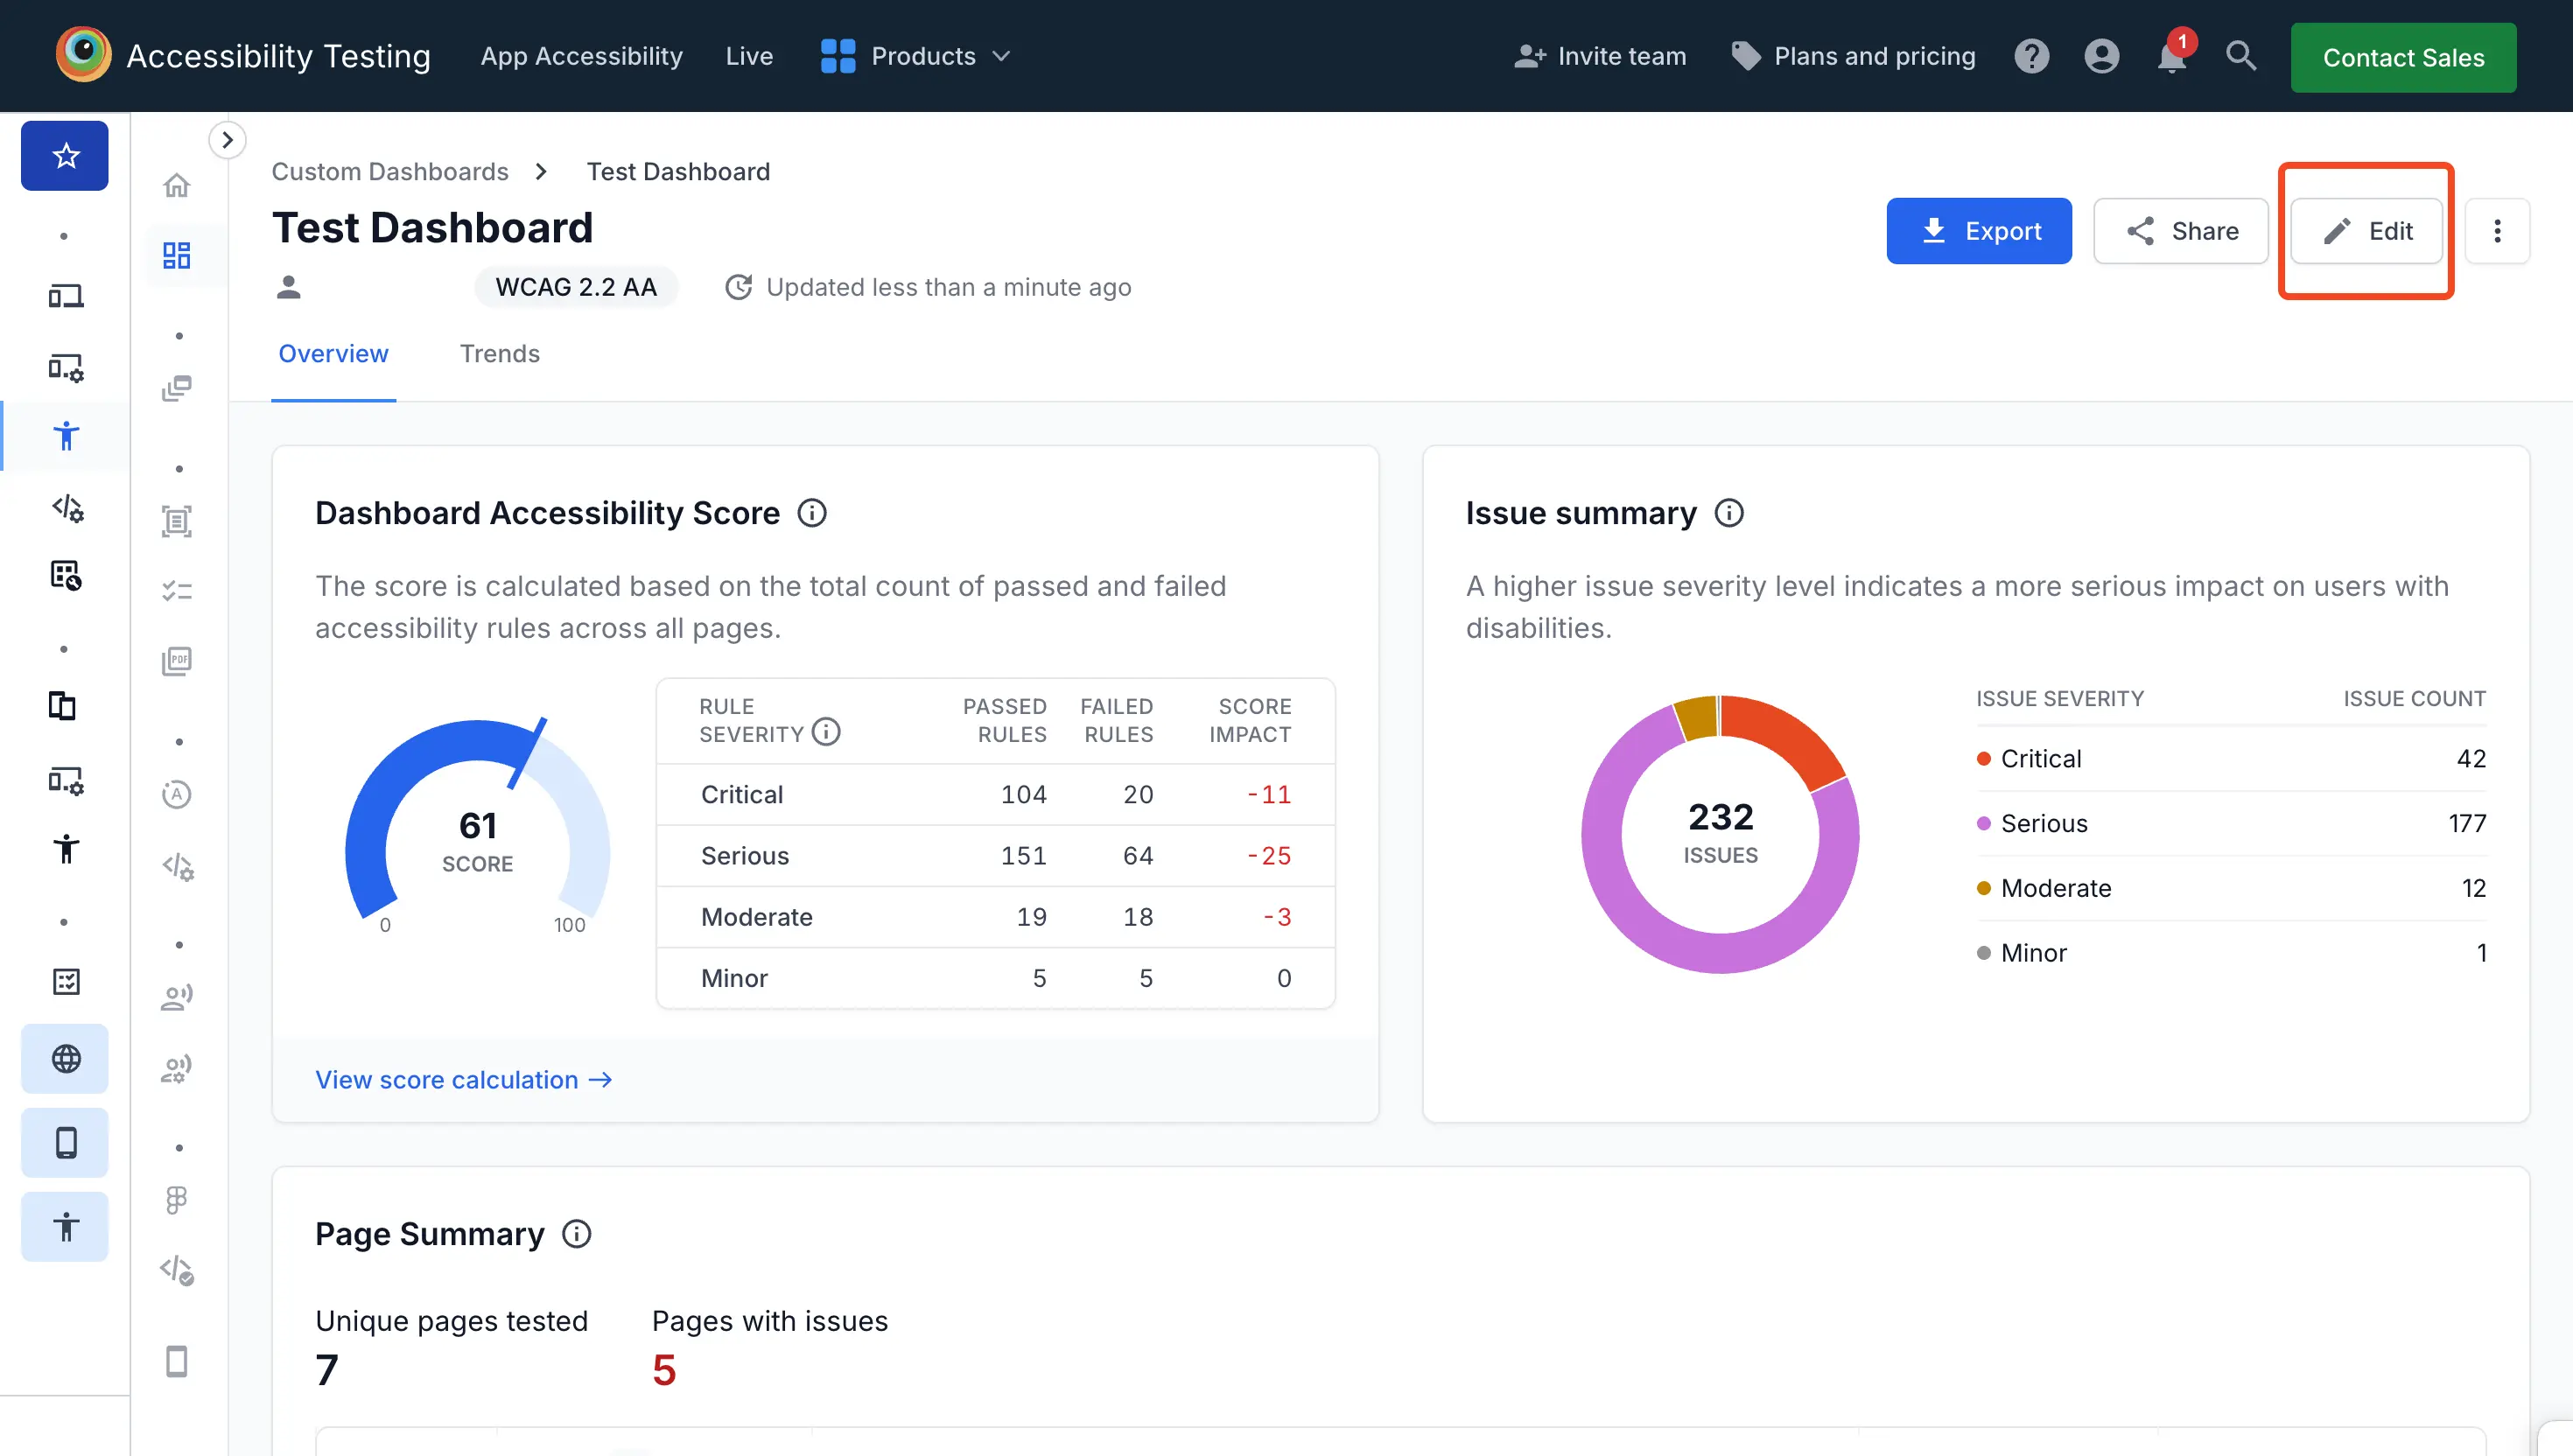
- Update the Dashboard name, Time Frame, or the tests included in the dashboard.
- Click Save Dashboard.
Your updated dashboard reflects the changes immediately.
Clone a custom dashboard
You can clone an existing custom dashboard to create a copy that you can customize independently.
- Navigate to Accessibility Testing → Custom Dashboards.
- On the dashboard you want to clone, click the Clone option from the actions menu.
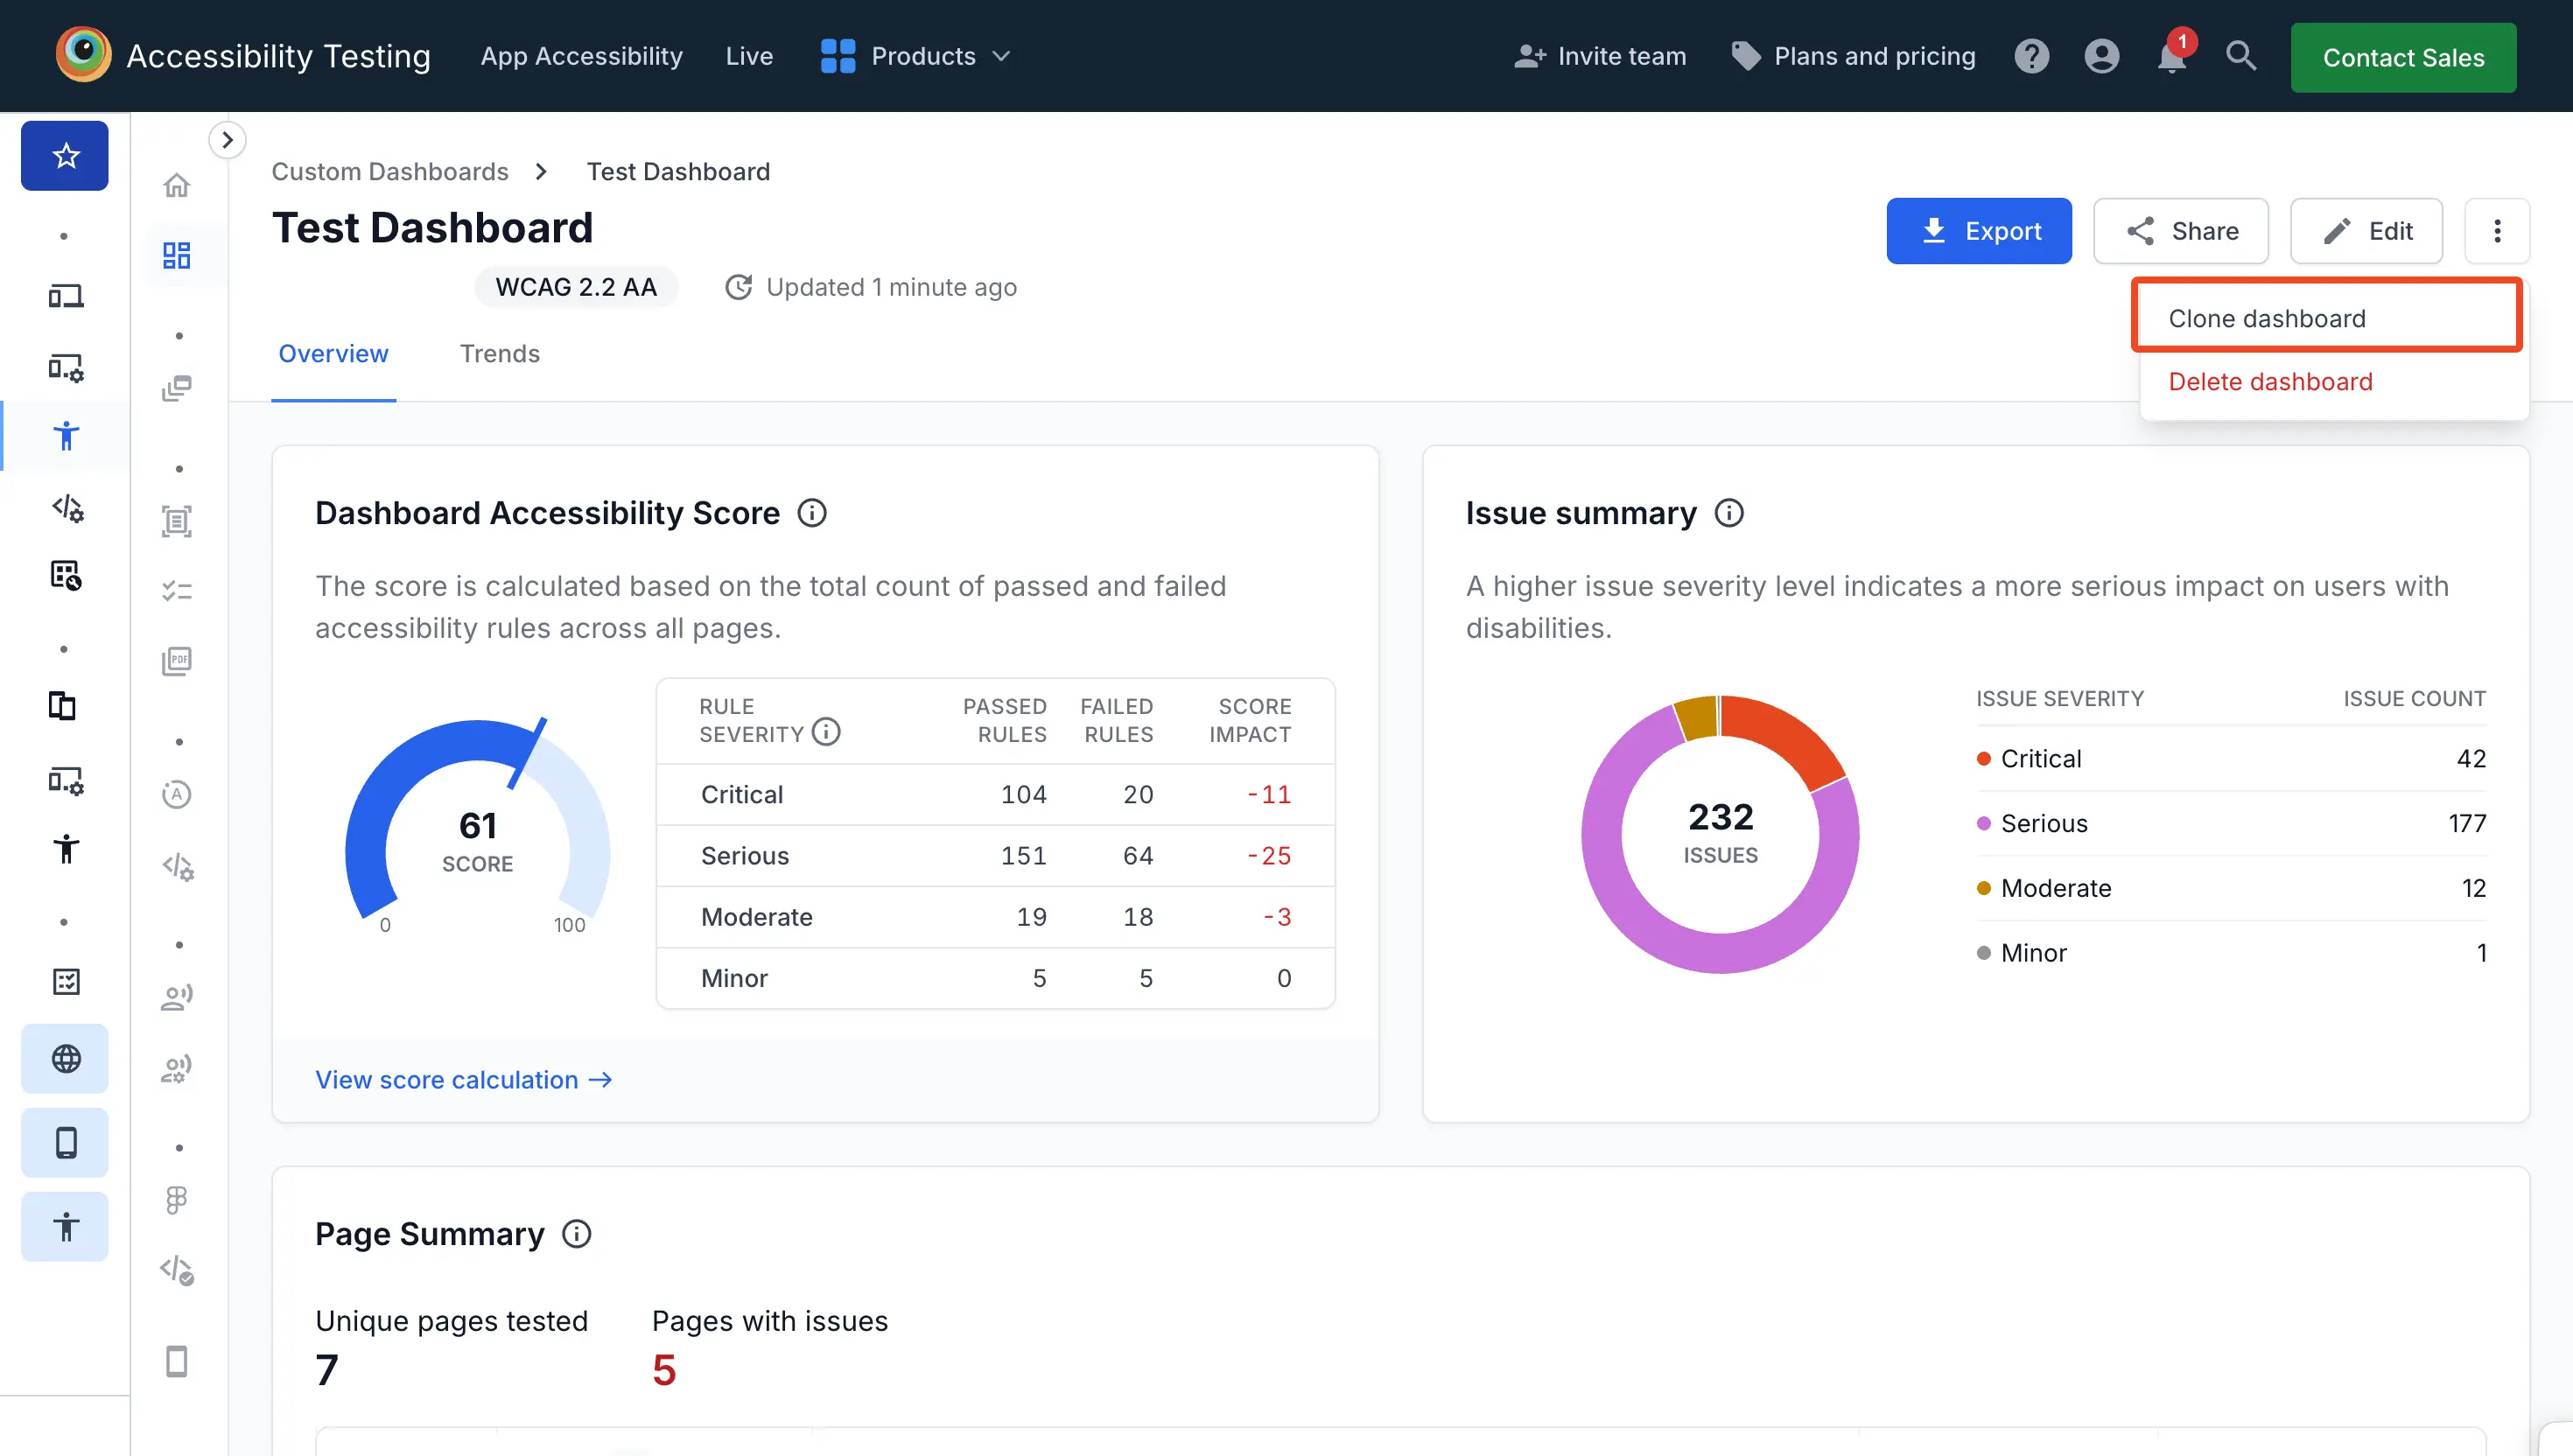
- Enter a name for the cloned dashboard.
- Click Create Dashboard.
A new dashboard is created with the same configuration as the original.
View custom dashboards
Custom dashboards visualize information under two distinct tabs:
- Overview
- Trends
Overview tab in a custom dashboard
The overview tab lists a collection of widgets that provide aggregated details about the tests that you have included in the dashboard.
The following widgets are present:
-
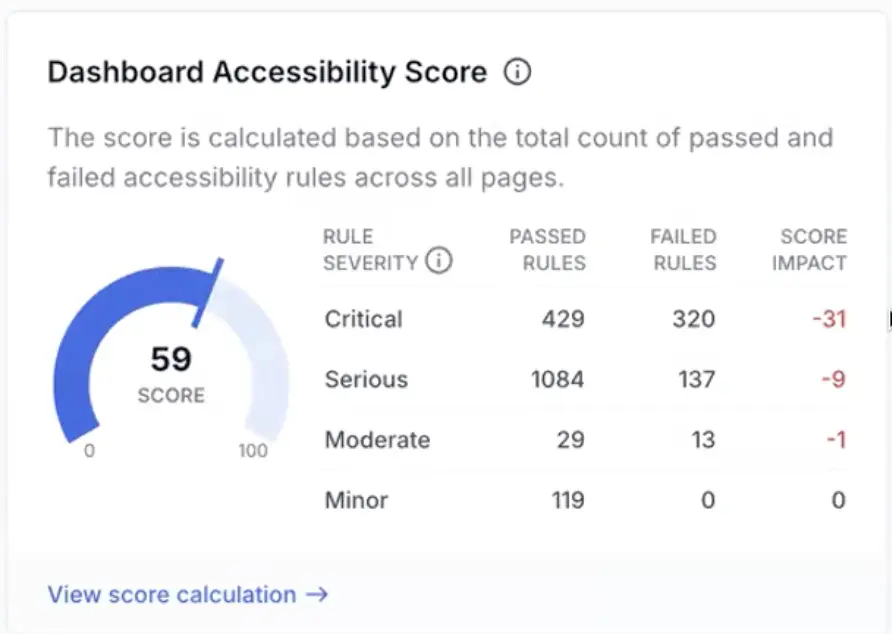
Dashboard Accessibility Score: Presents an overall accessibility score of the digital asset selected during dashboard creation. You can view a detailed list of passed and failed rule instances according to their severity. Note that if the same rule is violated at many instances, each violation is counted separately. You can click on a severity level to view the list of violations and dive deeper.
-
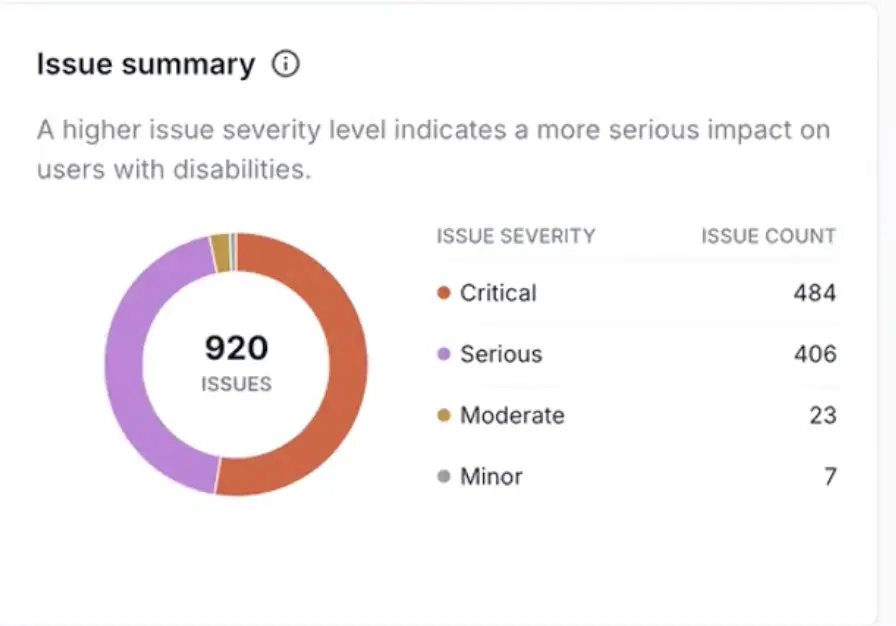
Issue Summary: Lists the number of de-duplicated issues detected according to their severity level. It helps you focus on more serious issues first. You can click on a severity level to view the list of violations and dive deeper.
-
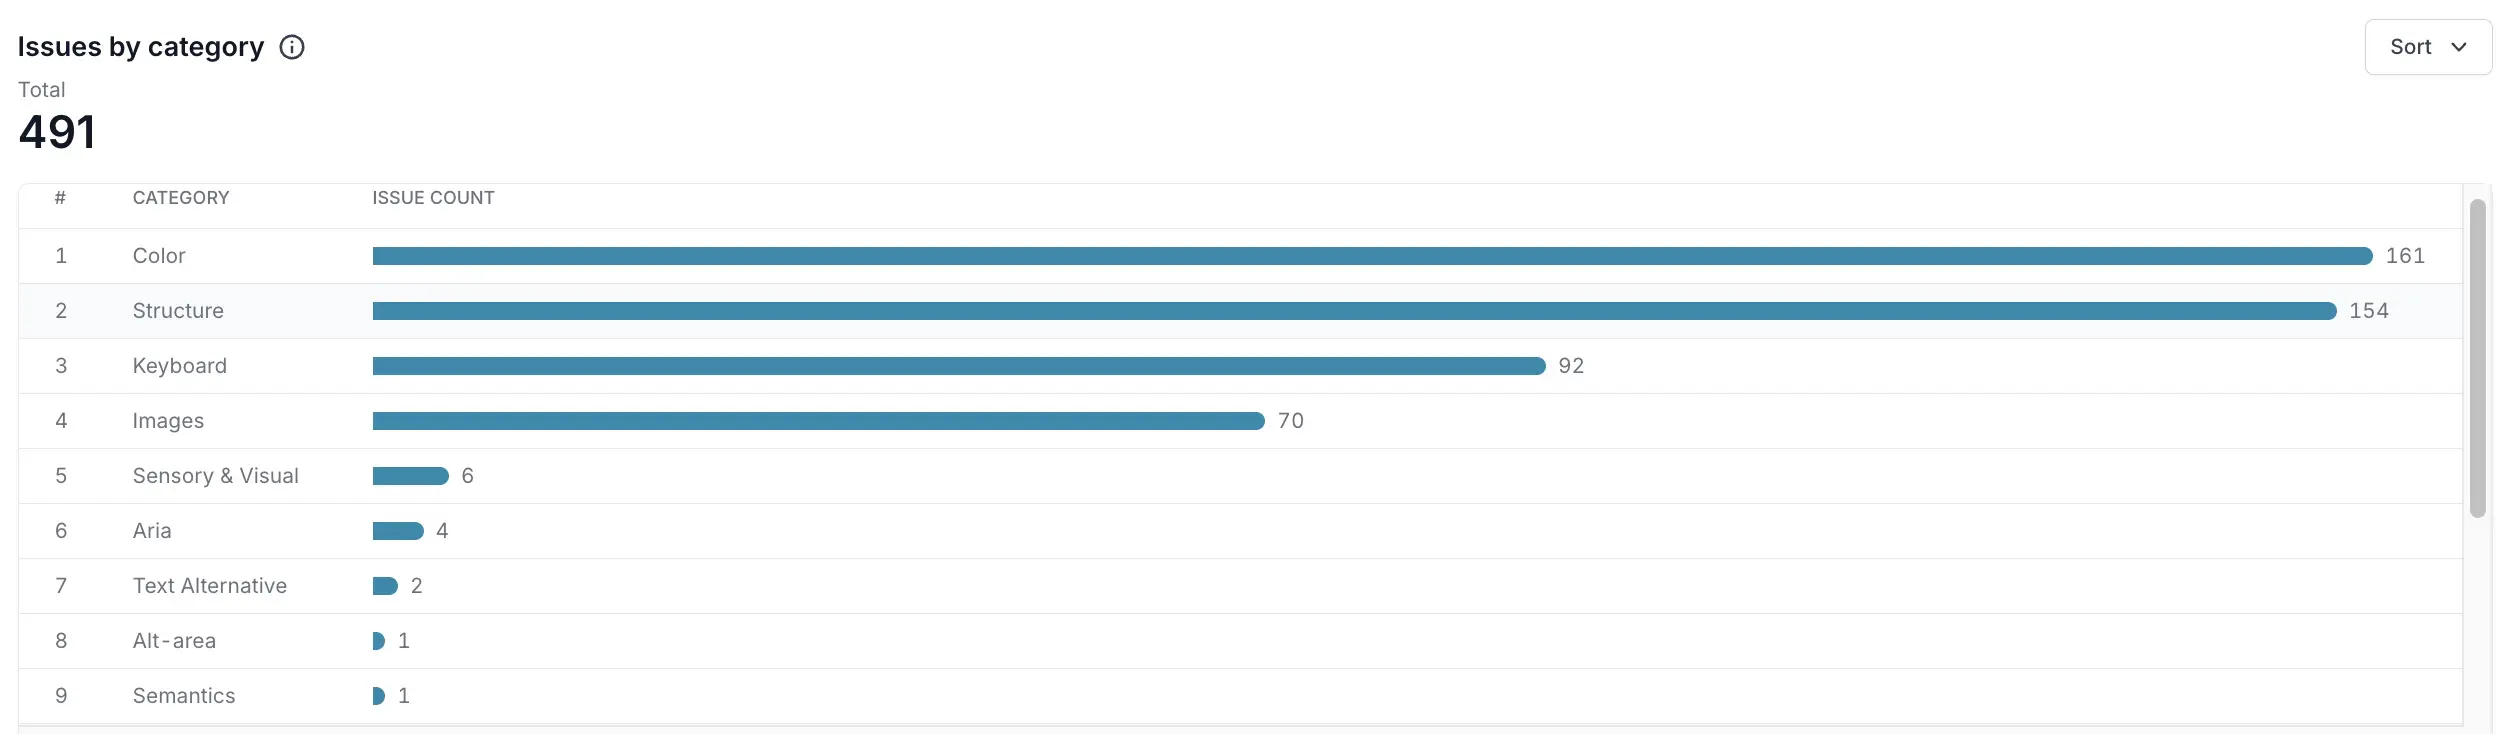
Issues by Category: Groups accessibility issues by category so you can see which categories are most common and prioritize fixes. Click a category to view its violations.
-
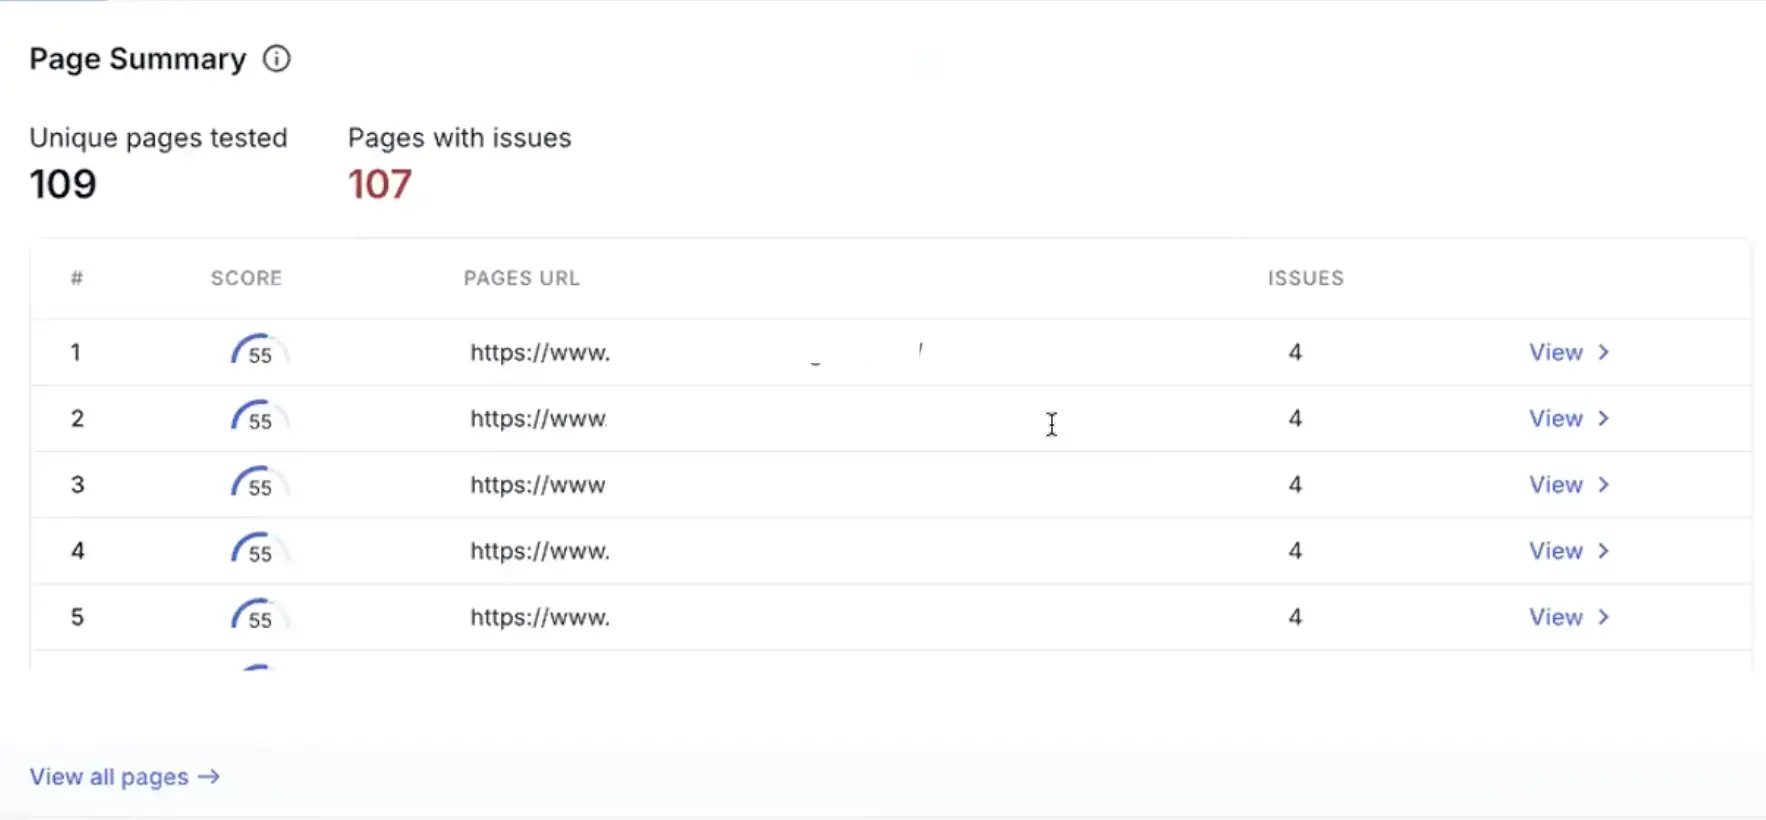
Page Summary: Provides a page-wise view of accessibility health for the digital assets selected during creation of dashboard. Using this widget, you can find the pages that are most affected, that is, have the most accessibility issues, and focus on fixing them first. You can click a page to view the list of violations and dive deeper.
-
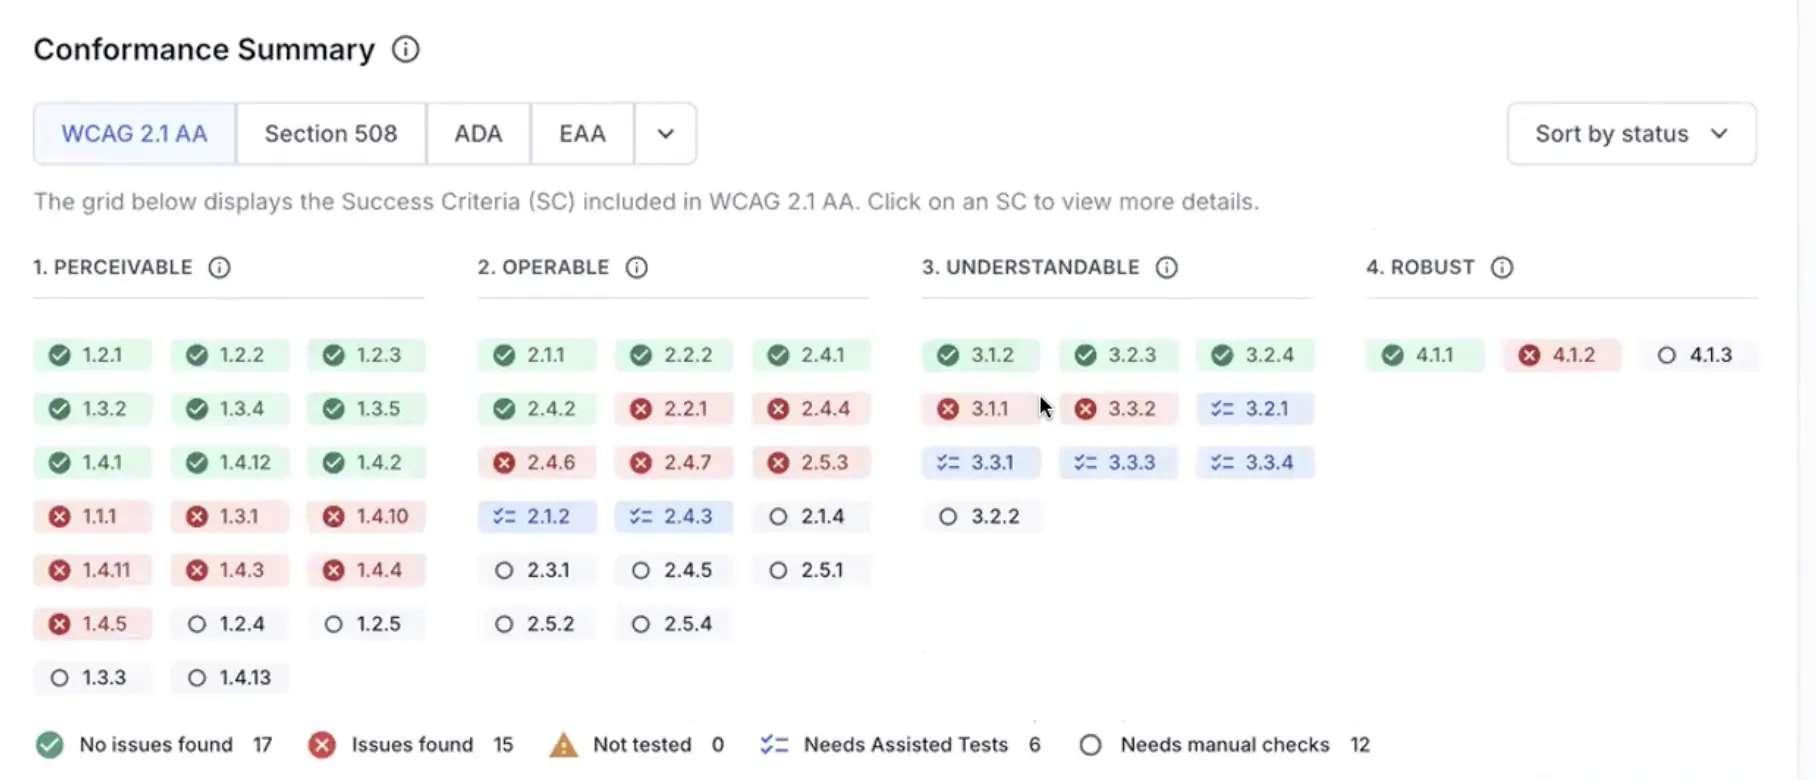
Conformance Summary: Gives an overview of the success criteria met and violated, according to various standards like WCAG 2.1 AA, RGAA, Section 508, ADA, EAA, and more. Use the Page filter to view the conformance summary for a specific page in your digital assets. This shows you the compliance state of that page, including which success criteria are passing or failing. You can click on a success criterion to deep dive into the list of issues found.
-
Testing Activity: Lists all the tests that were used to create the custom dashboard.

Trends tab in a custom dashboard
The trends tab helps you monitor the accessibility health of the digital assets selected over time. You can track the weekly or monthly trend of the accessibility scores and issue summary.
If the trend of accessibility score is an upward graph, it means that the accessibility health of your digital assets is improving. If the trend shows a downward graph, you can focus on fixing high-severity issues so that the trend improves over time.
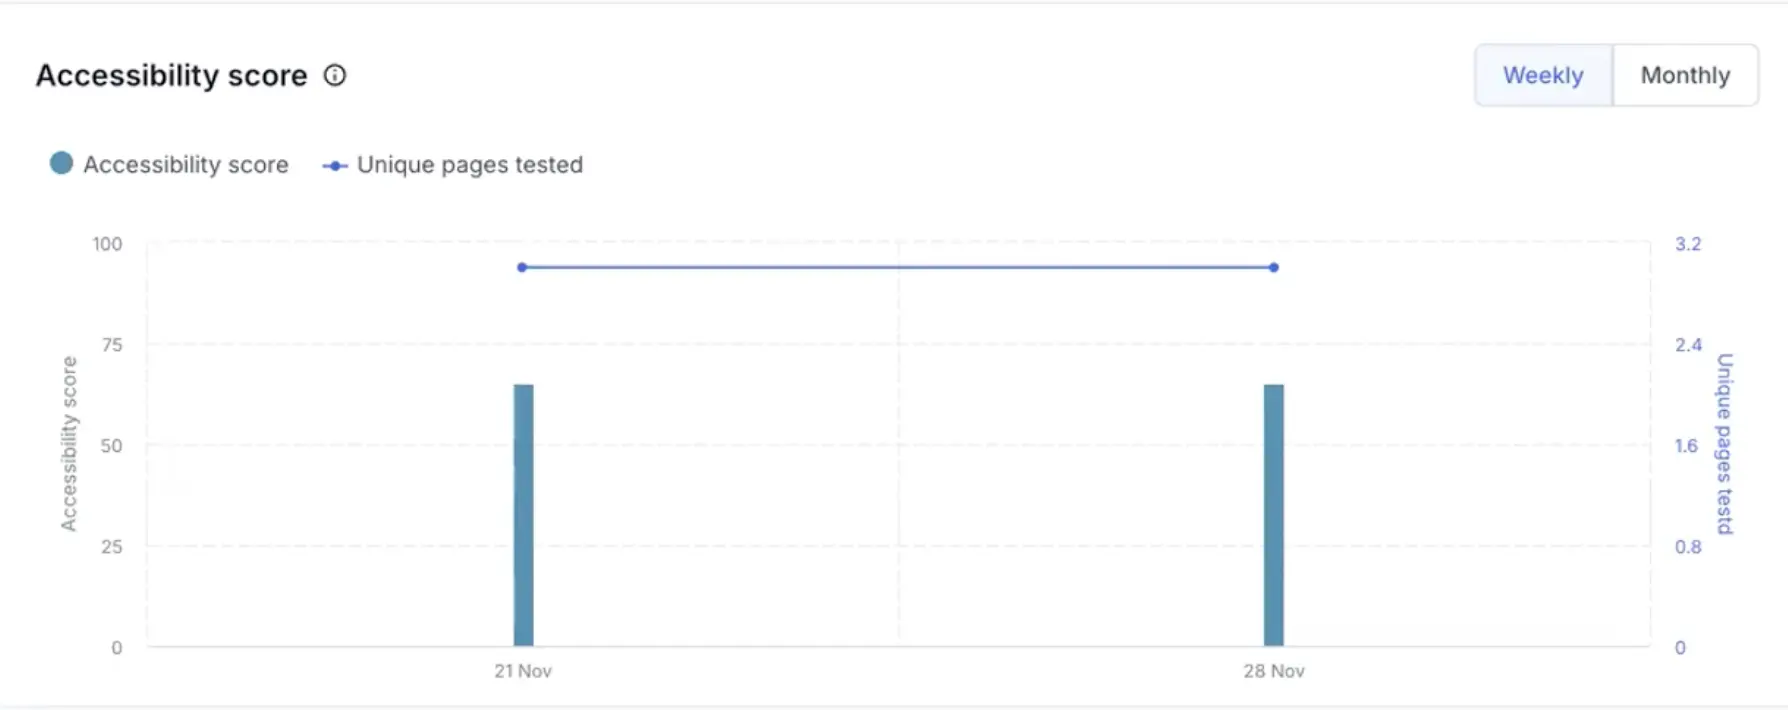
Similarly, the issue summary trend visualizes the trend of the number of accessibility issues detected in your tests, split across multiple severity levels. If the trend shows the number of issues reducing, it means that accessibility health of your digital assets is improving. If the trend shows a downward graph, you can focus on fixing high-severity issues so that the trend improves over time.
Export custom dashboard data
You can export all issues from a custom dashboard as a CSV file for offline analysis or reporting.
- Navigate to Accessibility Testing → Custom Dashboards.
- Open the dashboard you want to export.
- Click the Export button on the top-right of the dashboard.
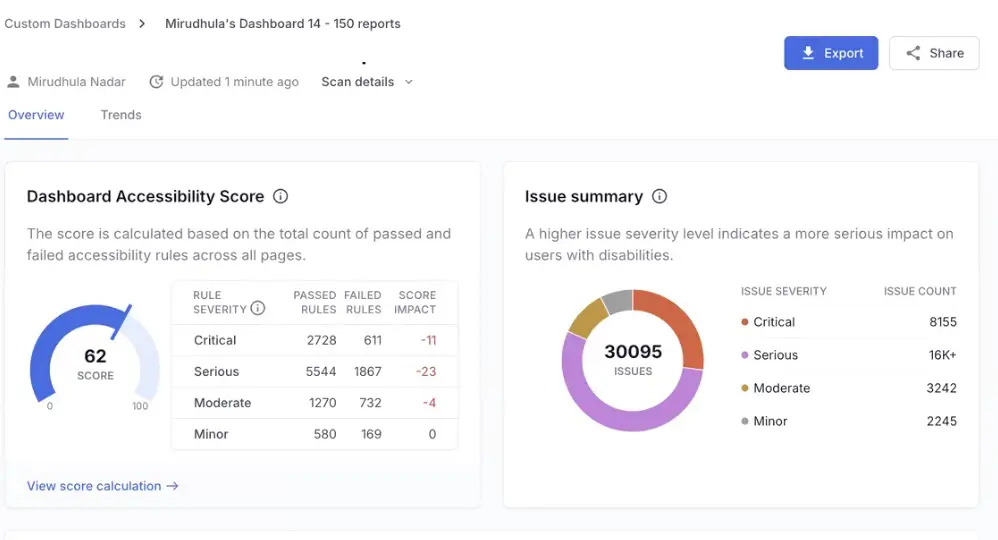
A CSV file containing all the issues from the dashboard is downloaded to your device.
Generate a VPAT report
You can generate a Voluntary Product Accessibility Template (VPAT) draft from the scan reports in a custom dashboard. For the steps and the details you need to provide, see Generate VPAT reports on custom dashboards.
Share a custom dashboard
To share a custom dashboard, click Share on the top-right of the dashboard.
Delete a custom dashboard
To delete a custom dashboard, click Delete on the top-right of the dashboard. Deleting a custom dashboard is a permanent action.
Troubleshooting
| Symptom | Cause | Action |
|---|---|---|
| Widget shows no data | Filters too narrow or time range empty | Broaden filters or extend time window |
| Severe issues chart flatlines | Scan ingestion delayed | Verify that the latest scans have completed. |
| Pass rate unexpectedly drops | New component release added critical issues | Drill into Top affected components widget. Create remediation task |
| WCAG coverage stagnant | Missing test coverage for new pages | Expand scan scope. |
We're sorry to hear that. Please share your feedback so we can do better
Contact our Support team for immediate help while we work on improving our docs.
We're continuously improving our docs. We'd love to know what you liked
We're sorry to hear that. Please share your feedback so we can do better
Contact our Support team for immediate help while we work on improving our docs.
We're continuously improving our docs. We'd love to know what you liked
Thank you for your valuable feedback!