View app performance for Appium tests
Access app performance metrics using app performance logs for your Appium test executions on BrowserStack App Automate. Test your apps on a real device cloud.
Mobile app test optimization starts with app performance. Your app’s performance directly impacts user experience and adoption, so identify and fix issues before release. Use the App Profiling feature to find performance problems early in the development cycle.
-
Access App Performance V2 on our new dashboard. This feature is exclusive to Device Cloud Pro, Device Cloud Pro + Visual Cloud, and Enterprise Pro plans. For more details, see our pricing page.
-
Supported OS versions for App Performance V2 are Android 10-16 Beta and iOS 14–18 and 26 Beta.
-
The system automatically displays V2 if your test case meets the requirements. Otherwise, it will default to the V1 experience. You must be on the new dashboard to view any performance metrics.
App performance V2
For a comprehensive app performance report, you must set the appProfiling capability in your Appium test scripts. This capability gives you a deep insight into how your app performs against performance metrics such as Frames Per Second (FPS), Application Not Responding (ANR) rate, app & page loading times, device resource usage, and more.
You can also download logs and a shareable report that you can use to collaborate and troubleshoot issues with your team.
Supported OS versions
The appProfiling capability is supported on the following OS versions:
- Android: versions 10.0 to 16 Beta
- iOS: versions 14.0 to 18.0 and 26 Beta
Set the capability
Based on your integration method, set the appProfiling capability to true to capture detailed app performance metrics.
If you use the BrowserStack SDK, set the appProfiling capability to true in your browserstack.yml file:
| Capability | Description | Values |
|---|---|---|
appProfiling |
Enable detailed app performance profiling. | true, false Default: false |
In your Appium test scripts, set the appProfiling capability to true to capture detailed app performance metrics.
| Capability | Description | Values |
|---|---|---|
appProfiling |
Enable detailed app performance profiling. | true, false Default: false |
The following example shows how to set the capability in your test script:
DesiredCapabilities capabilities = new DesiredCapabilities();
HashMap<String, Object> browserstackOptions = new HashMap<String, Object>();
browserstackOptions.put("appProfiling", "true");
var capabilities = {
    'bstack:options' : {
        "appProfiling" : "true",
    },
}
desired_cap = {
	'bstack:options' : {
		"appProfiling" : "true",
	},
}
capabilities = {
    'bstack:options' => {
        "appProfiling" => "true",
    },
}
AppiumOptions capabilities = new AppiumOptions();
Dictionary<string, object> browserstackOptions = new Dictionary<string, object>();
browserstackOptions.Add("appProfiling", "true");
Access detailed performance report
You can view the detailed performance metrics for your build using the following:
App Automate dashboard
To view the performance metrics on the App Automate dashboard, follow these steps:
- Open the App Automate dashboard.
- Locate the build for your app.
You can find the build in the builds list or you can search for the build. - Click the build and then click the session that has the App Performance Testing capability set.
- Go to the App Performance tab.
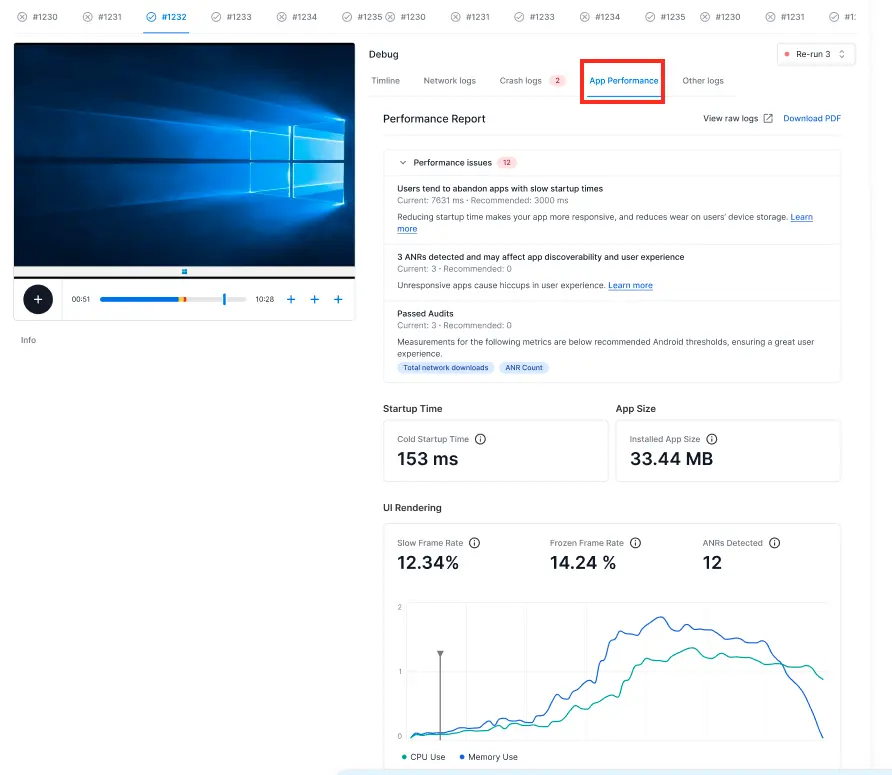
In the App Performance section, you can view the following:
-
PDF Report and raw logs: The performance report in PDF format that you can download to share with your team. Or, you can view the raw logs in JSON format by clicking the three-dot menu beside the PDF Report button.
-
Performance issues: This section highlights the performance metrics that are above the threshold, their user impact, and guidance on how to fix them. It also shows the passed audits for the performance metrics that are below the threshold.
-
Performance metrics list: After the Performance issues sections, you have the list of performance metrics such as app size, UI rendering performance, memory usage, battery and power usage, and more.
-
PDF Report and raw logs: The performance report in PDF format that you can download to share with your team. Or, you can view the raw logs in JSON format by clicking the three-dot menu beside the PDF Report button.
App performance V1
The default app performance helps you track where your app is making inefficient use of resources, such as the CPU, memory, battery, and network.
The App performance V1 is only available for Android tests and is enabled by default. Switch to our new dashboard experience to access the App performance V2.
To access App Profiling, follow these steps:
- Open the App Automate dashboard.
- Locate the build for your app.
You can find the build in the builds list or you can search for the build. - Click the build and then click the desired session.
- Go to the App Profiling tab.
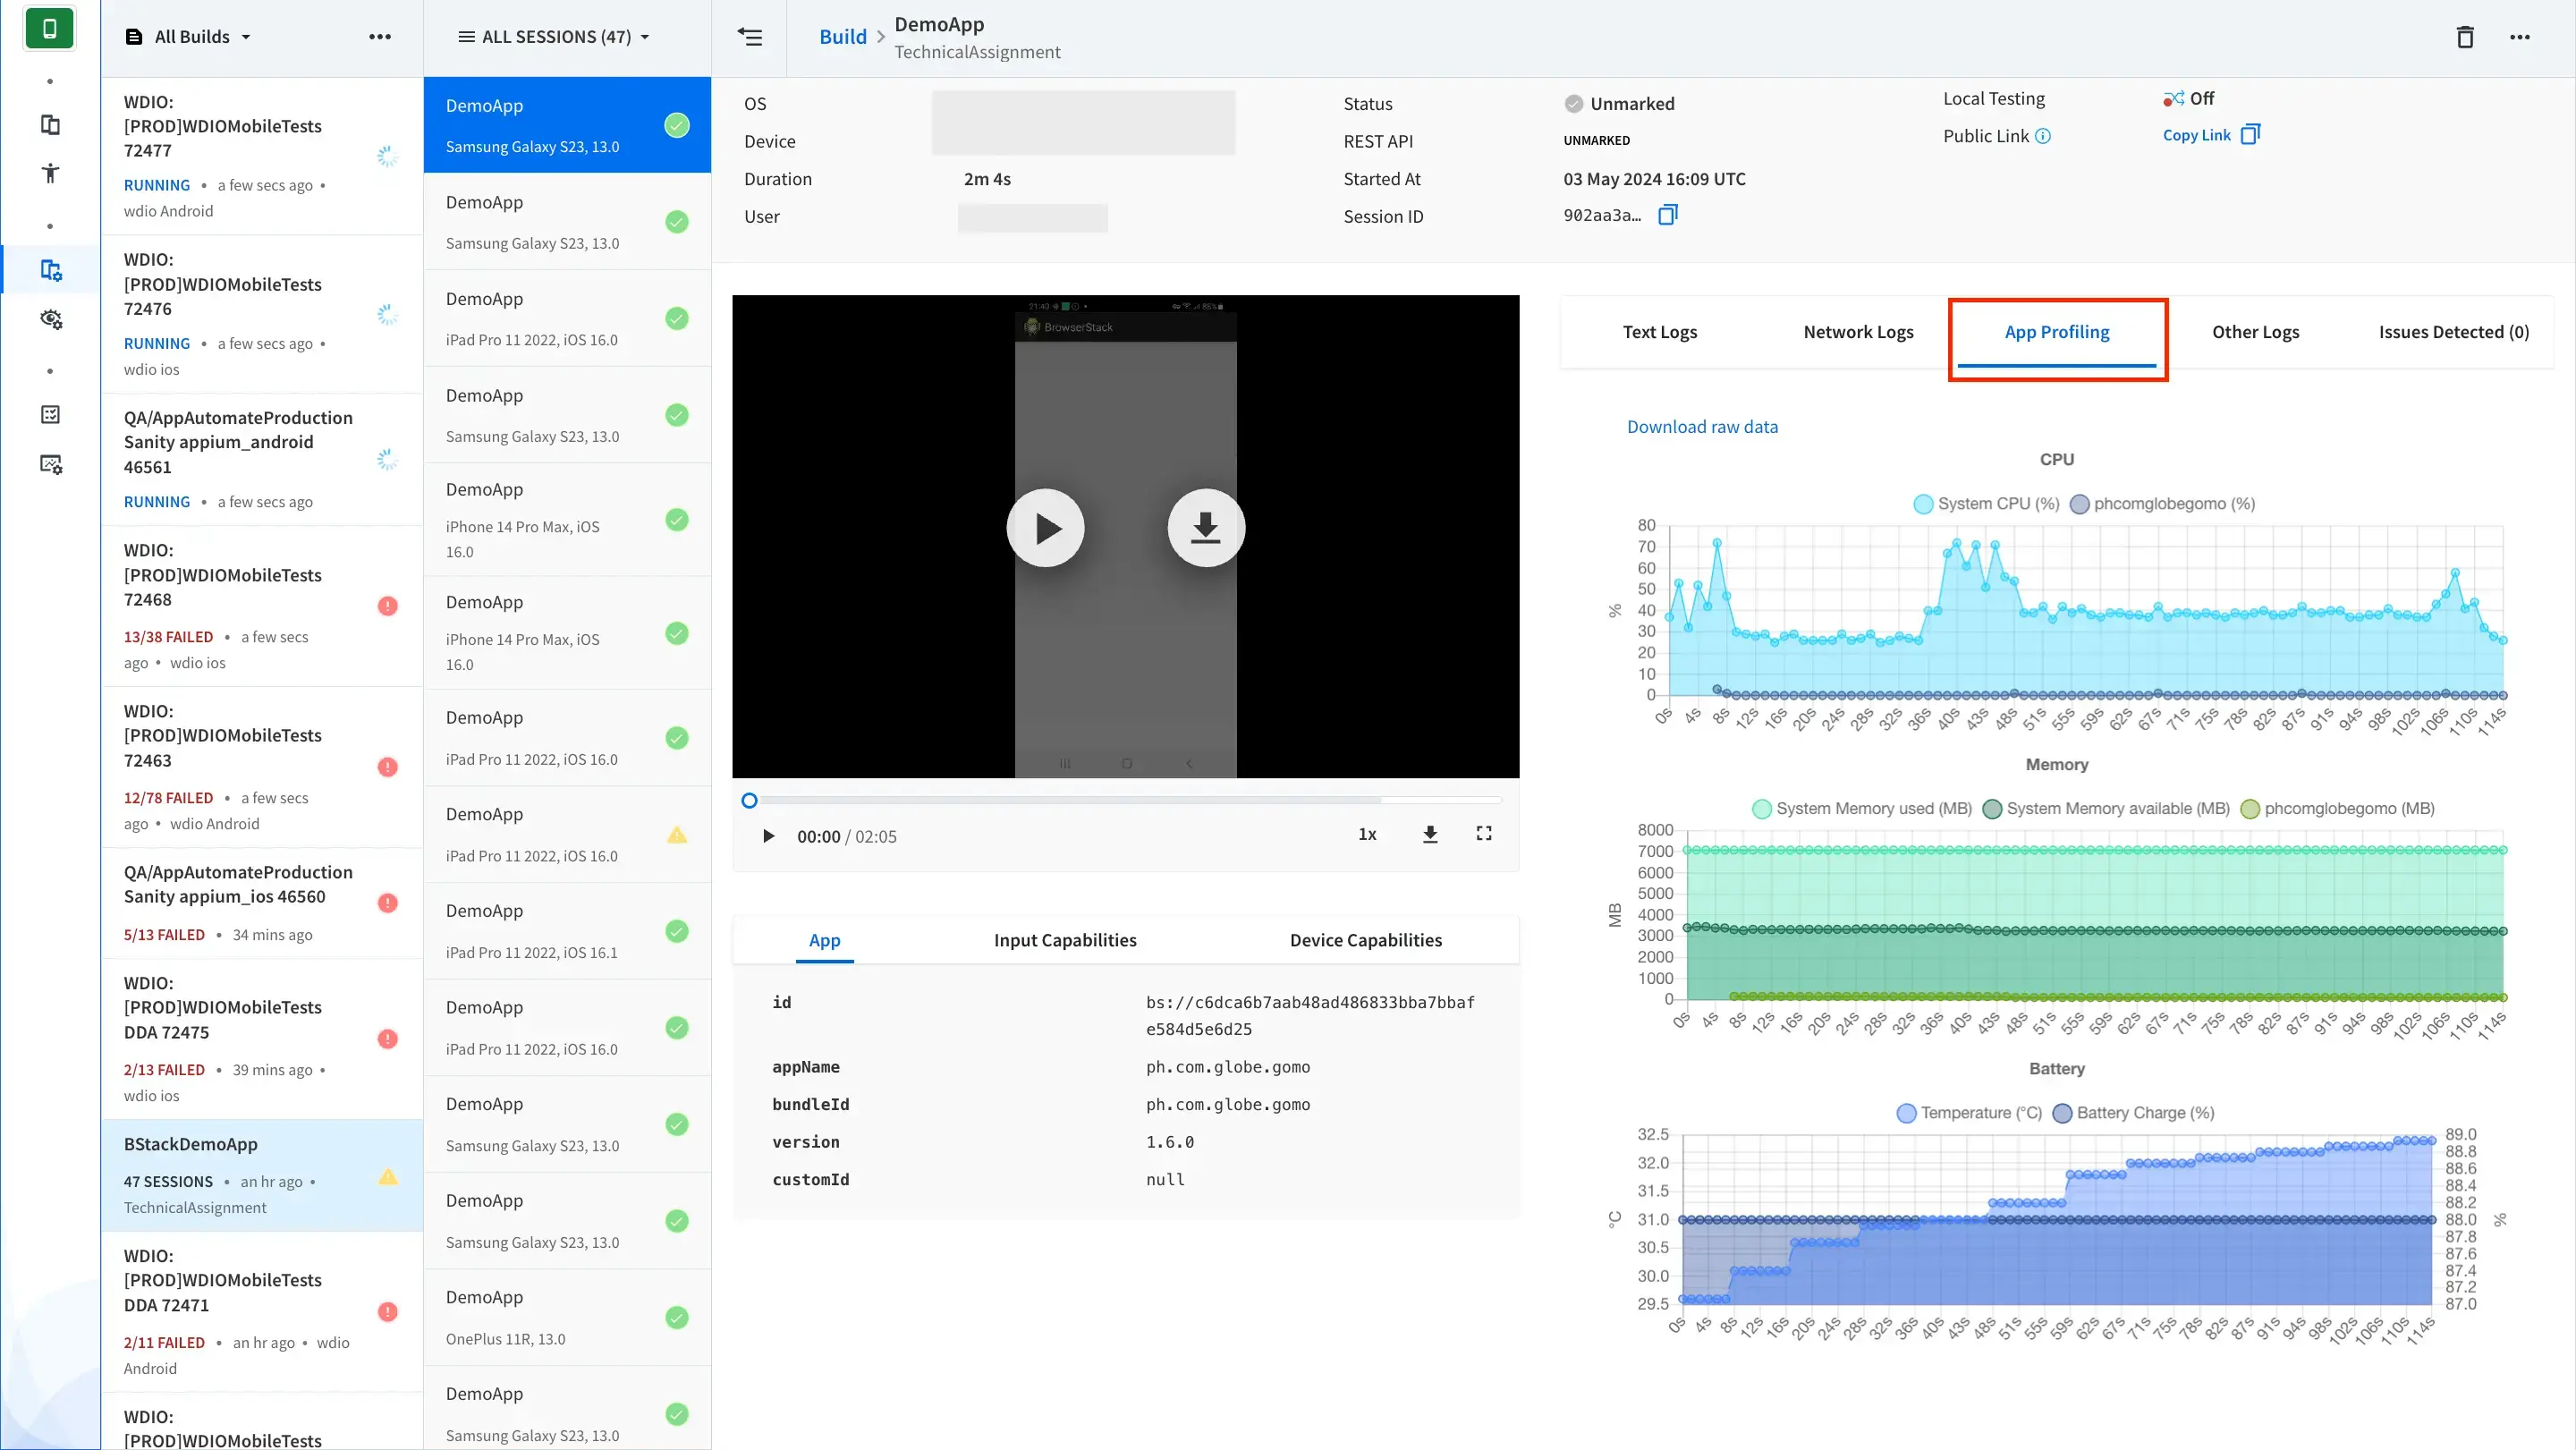
By default, App Profiling shows the following graphical charts for the device resources consumption by the app:
-
CPU usage: Optimizing your app’s CPU usage has many advantages, such as providing a faster and smoother user experience and preserving device battery life. Track the CPU usage(%) by your app on the real devices.
- Memory consumption: Identify memory leaks or memory churn that can lead to app freezes, and even app crashes. Track the memory usage(MB) by your app on the real device.
- Battery usage: Track the effect on battery temperature(°C) and battery charge(%) of the real device by your app.
- Network usage: View the network activity on a timeline, showing data sent/received. This lets you examine how and when your app transfers data, and optimize the underlying code appropriately. Track the network usage(kbps) by your app on the real device.
We're sorry to hear that. Please share your feedback so we can do better
Contact our Support team for immediate help while we work on improving our docs.
We're continuously improving our docs. We'd love to know what you liked
We're sorry to hear that. Please share your feedback so we can do better
Contact our Support team for immediate help while we work on improving our docs.
We're continuously improving our docs. We'd love to know what you liked
Thank you for your valuable feedback!