View test results in App Low Code Automation
View, filter, and debug build runs and test results in BrowserStack App Low Code Automation.
The Build runs section in App Low Code Automation displays a list of all test builds executed for your selected project. You can quickly see the status, duration, and results for each build run, helping you track test coverage and identify issues.
View build runs
To view build runs in App Low Code Automation:
- Go to the Build runs section in the left navigation panel.
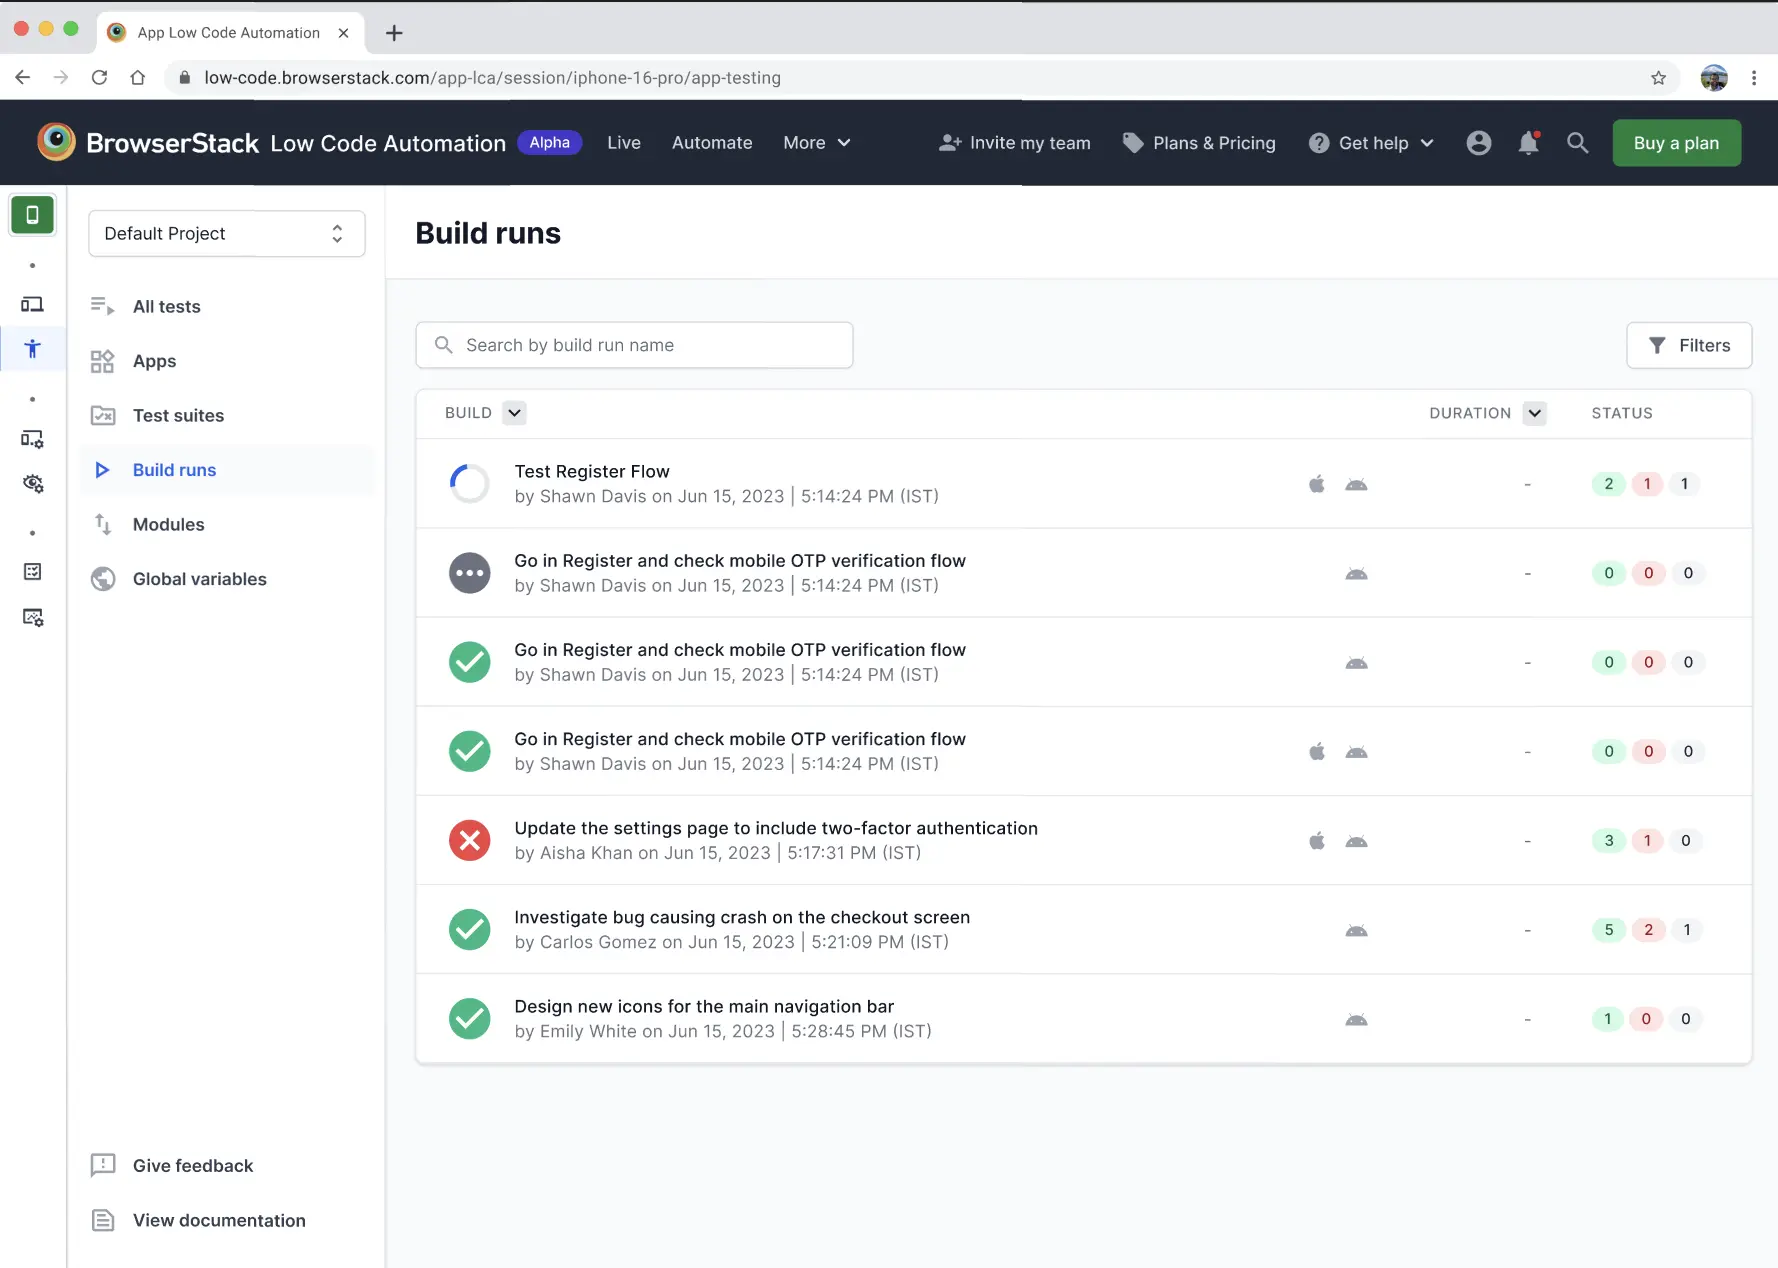
- Select a build from the list or use the search bar to find a build run by name.
- Each build run shows:
- Build name
- Owner and execution timestamp
- Device types used for testing
- Status indicators (passed, failed, skipped)
- Duration
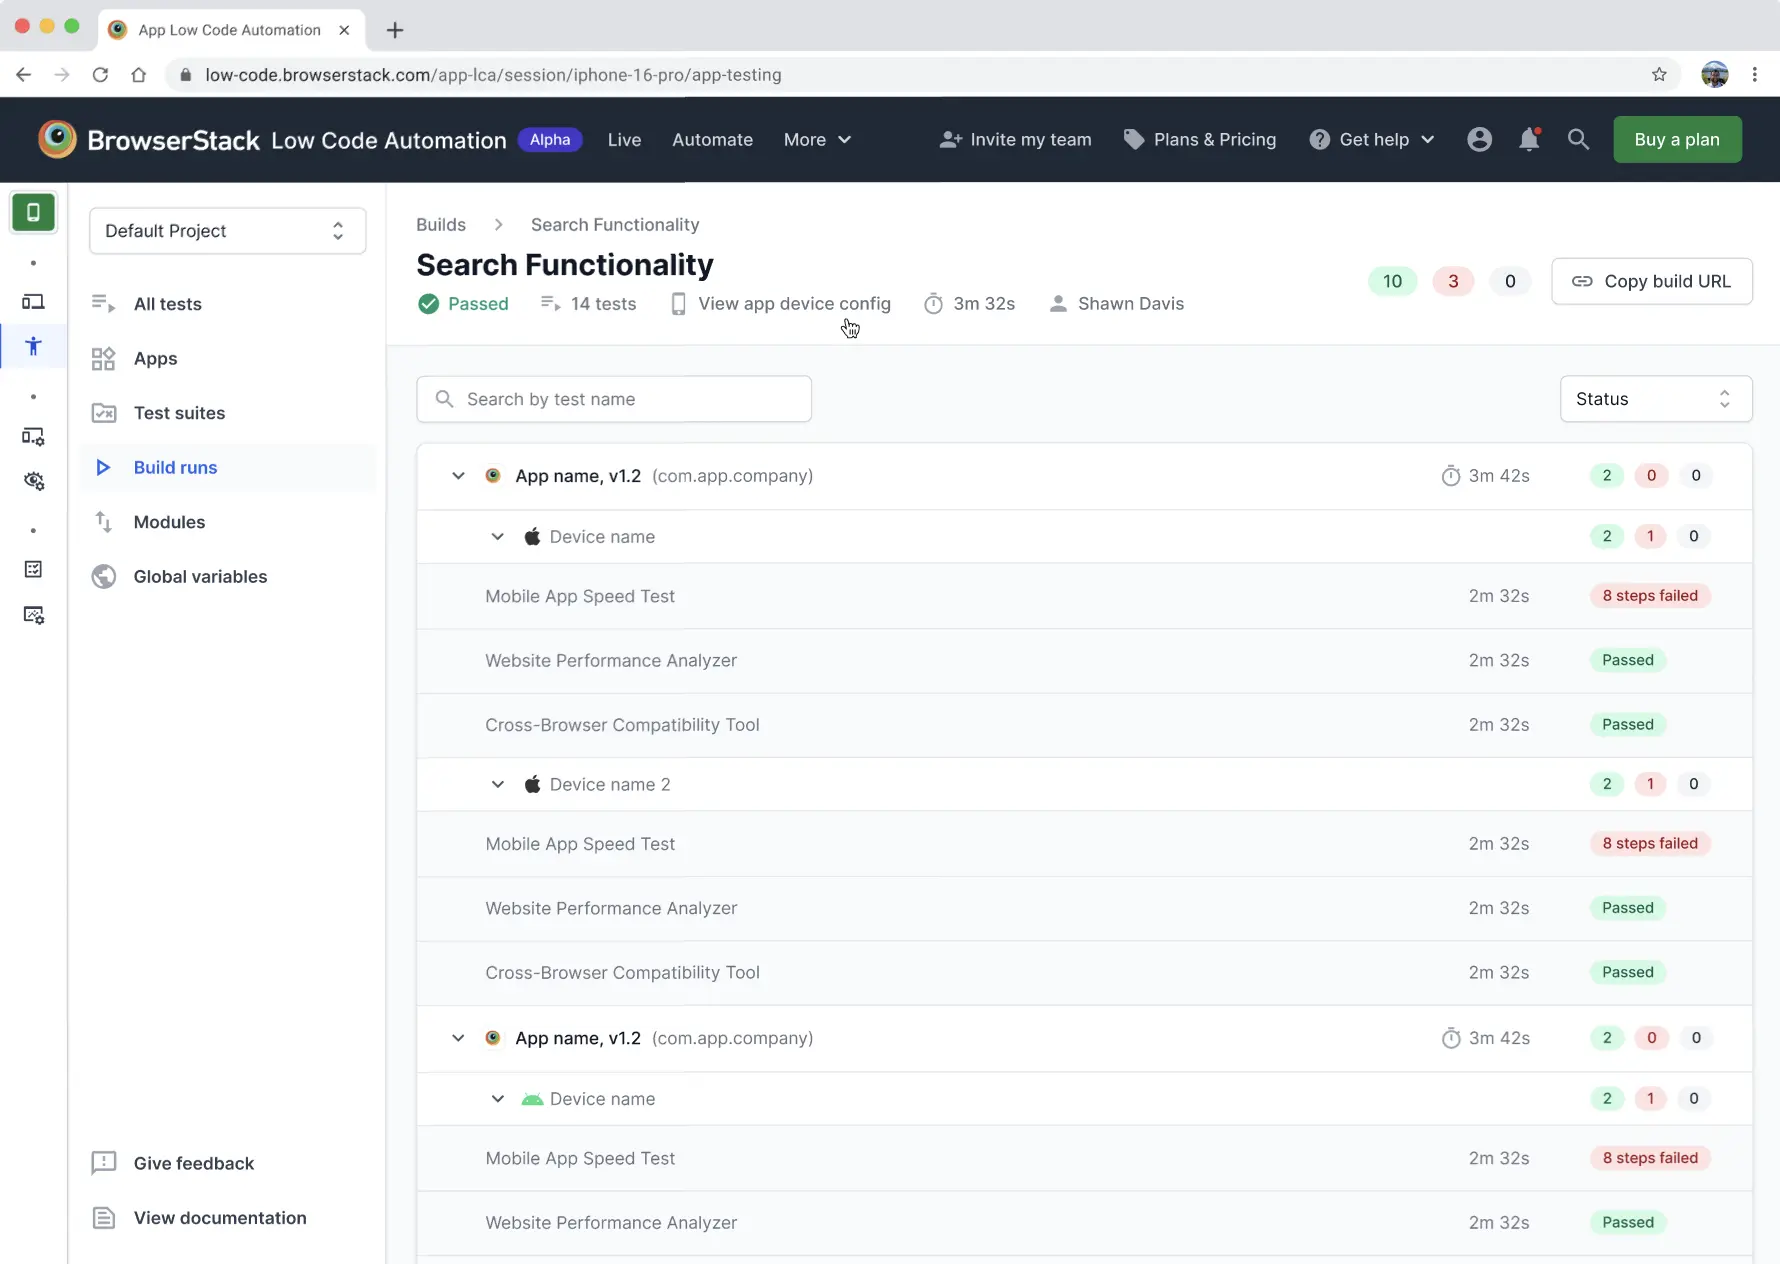
You can click Copy build URL to share the build with other users.
To filter builds, use Filters to narrow results by status, device, or other criteria.
Build run status
- Green check: All tests passed
- Red cross: One or more tests failed
- Gray dots: Tests are running or pending
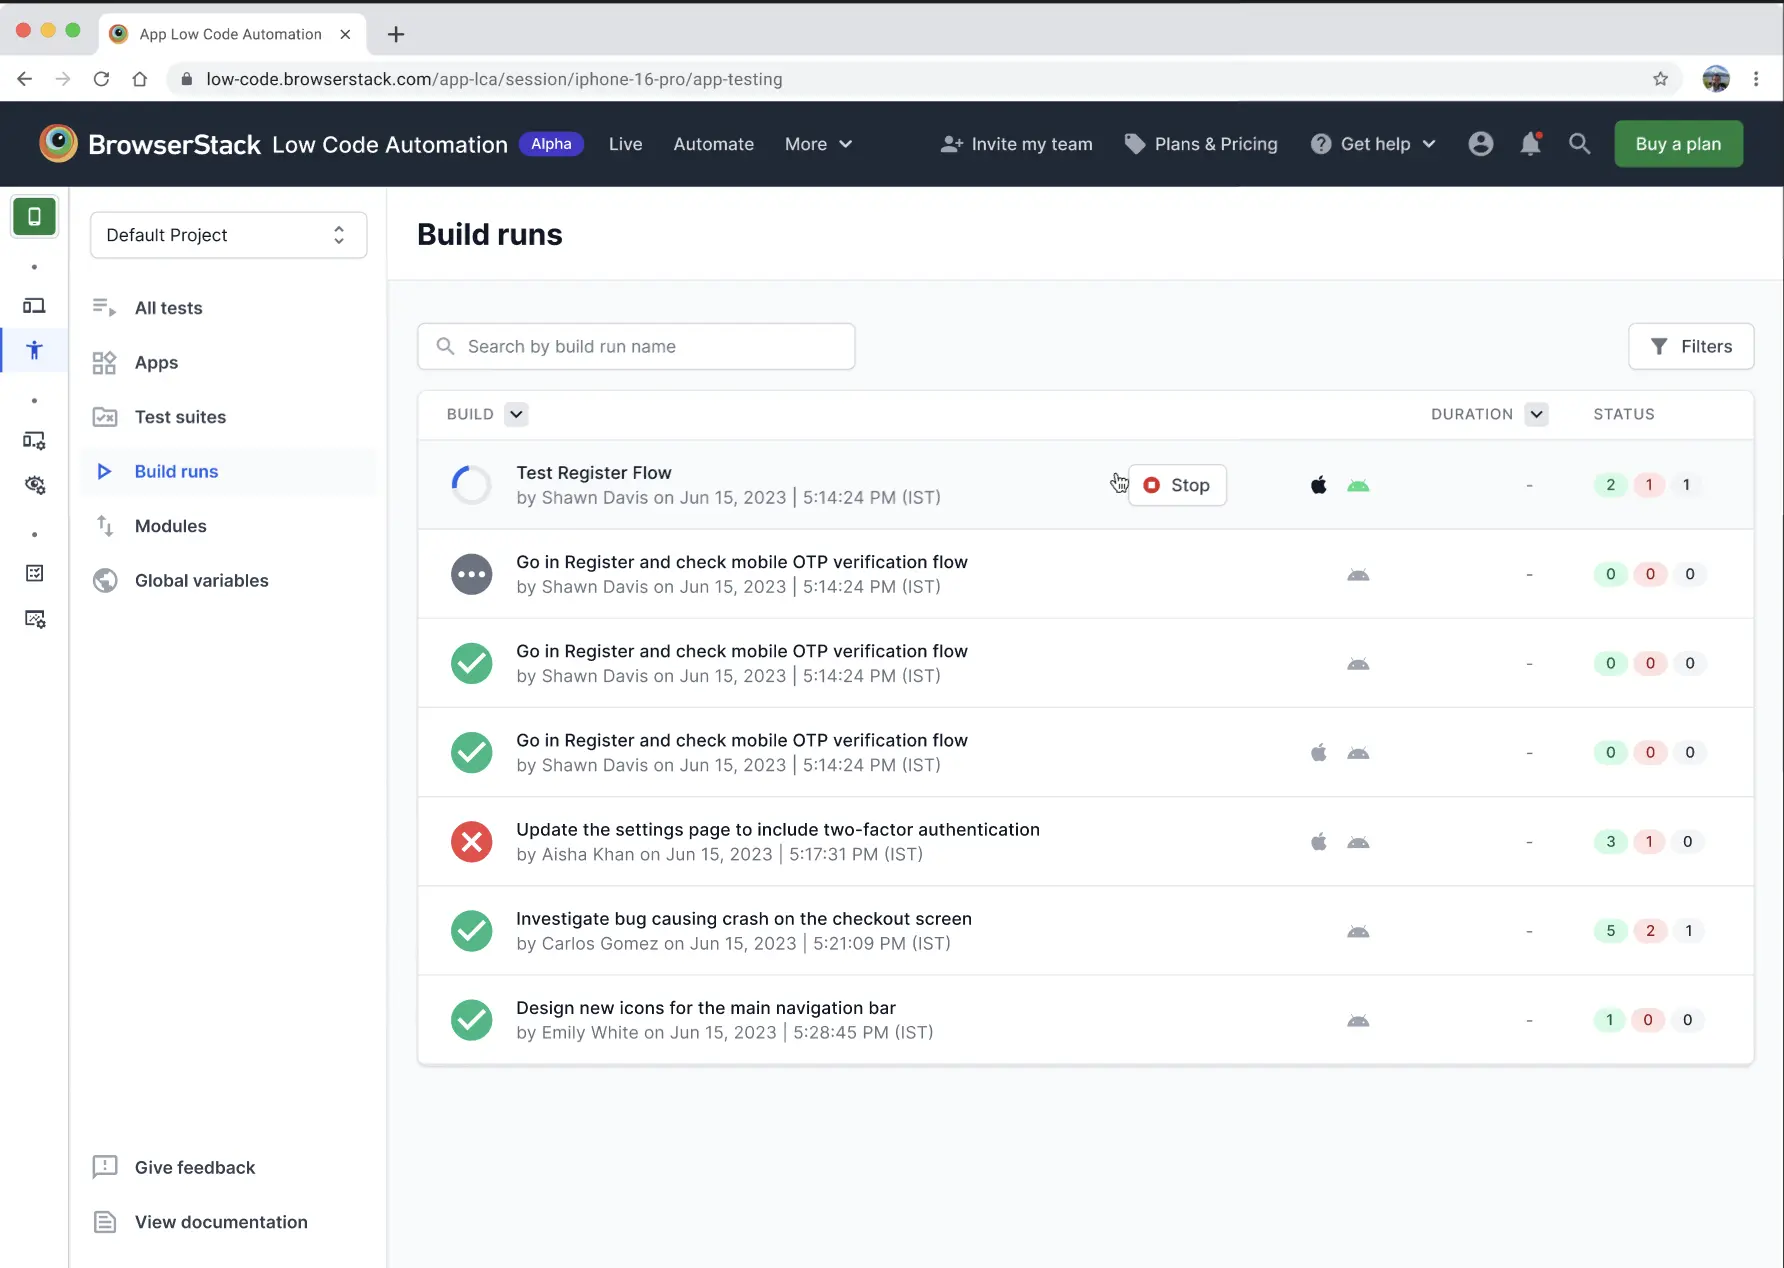
You can stop a running build by clicking the Stop button next to the build name.
Debugging build runs and failed tests
Click on a build run to view detailed results for each test suite and device. You can:
- Expand each device to see individual test results
- View step-by-step status (passed, failed, skipped)
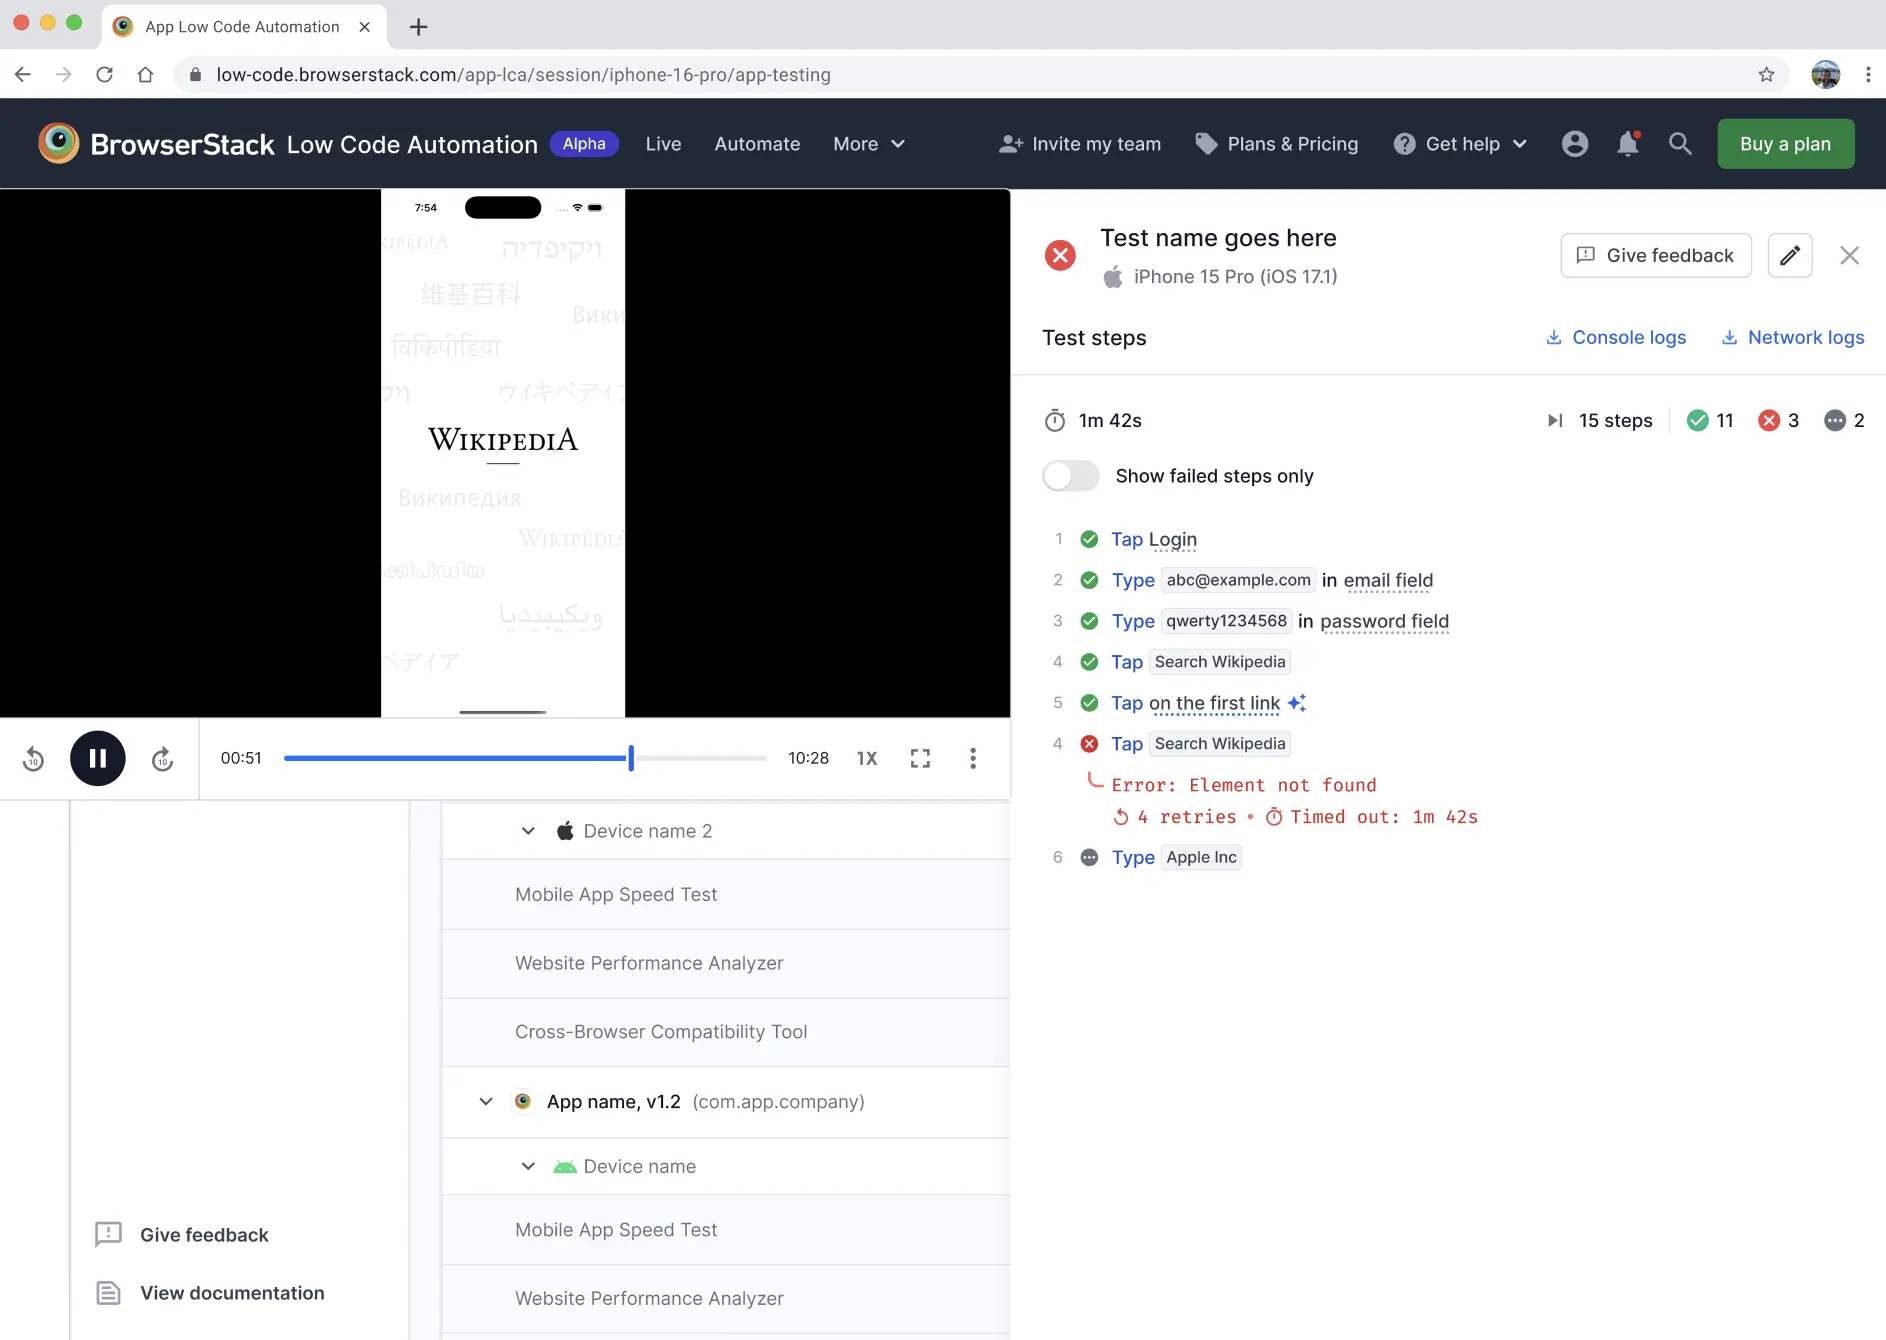
- See error messages and retry counts for failed steps
For failed tests, you can:
- View error details and retry attempts
- Watch video recordings of the test execution
- See which step failed and why
We're sorry to hear that. Please share your feedback so we can do better
Contact our Support team for immediate help while we work on improving our docs.
We're continuously improving our docs. We'd love to know what you liked
We're sorry to hear that. Please share your feedback so we can do better
Contact our Support team for immediate help while we work on improving our docs.
We're continuously improving our docs. We'd love to know what you liked
Thank you for your valuable feedback!