
 Join our Discord
Set the engine count for a load test
Distribute your load test across multiple engine pods (1 to 10) to run more than 1,000 concurrent virtual users
Engine count controls how many parallel pods run your load test. By increasing engine count, you can run tests with more VUs than a single pod can handle.
Each engine pod supports up to 1,000 VUs. If you need to run 3,000 VUs, set engine count to 3 and BrowserStack splits your test across three pods.
When to set engine count
Engine count is required when:
- Running more than 1,000 concurrent virtual users
- Distributing load across multiple geographic regions
- Simulating real-world traffic patterns from different locations
Configure engine count
Open a load test in Create or Edit mode and go to Step 3, Load Configuration.
Go to the Advanced Settings tab and scroll to Engine Count.
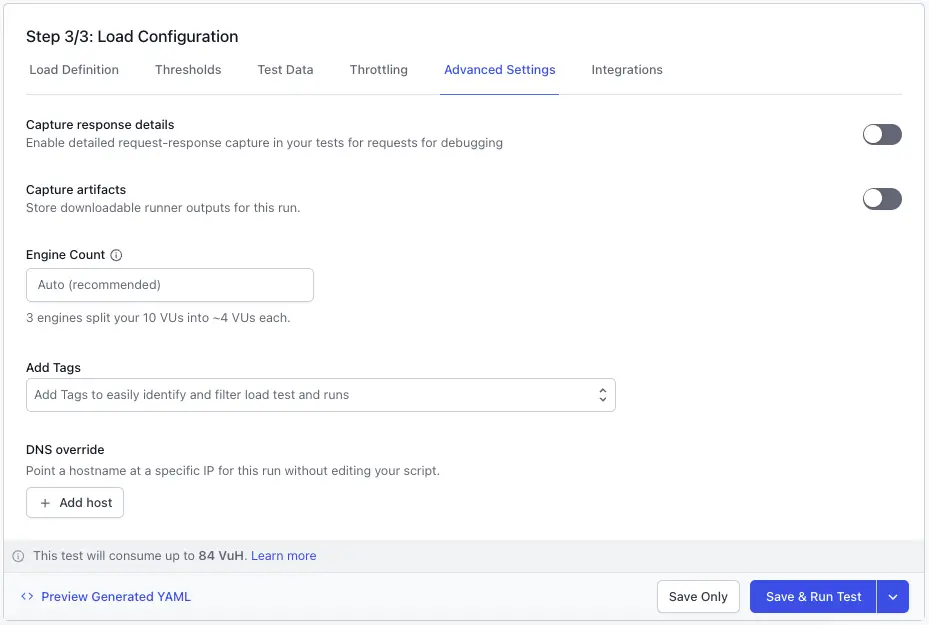
Set Engine count to the number of pods you want to use.
Configure your total virtual users (VUs) under Load Definition.
The system automatically divides your total VUs equally across all engine pods.
Example: If you set 5,000 total VUs with engine count 5, each pod runs 1,000 VUs.
Engine count works only with API load tests.
UI Builder: All frameworks supported
CLI: JMeter only
How billing works
Engine count affects your provisioned capacity cost. You are billed for the total capacity reserved, not just what you use.
The billing formula is: max VUs per engine (1,000) × engine count = provisioned VUs
Examples:
-
engineCount: 1with 500 total VUs = billed for 1,000 VUs -
engineCount: 3with 500 total VUs = billed for 3,000 VUs -
engineCount: 3with 3,000 total VUs = billed for 3,000 VUs
Divide your total VUs evenly by engine count to avoid wasting provisioned capacity.
Verify the engine count applied
After running your test, confirm that engine count was applied:
Follow these steps to verify:
Open the run’s report and select View Metadata.
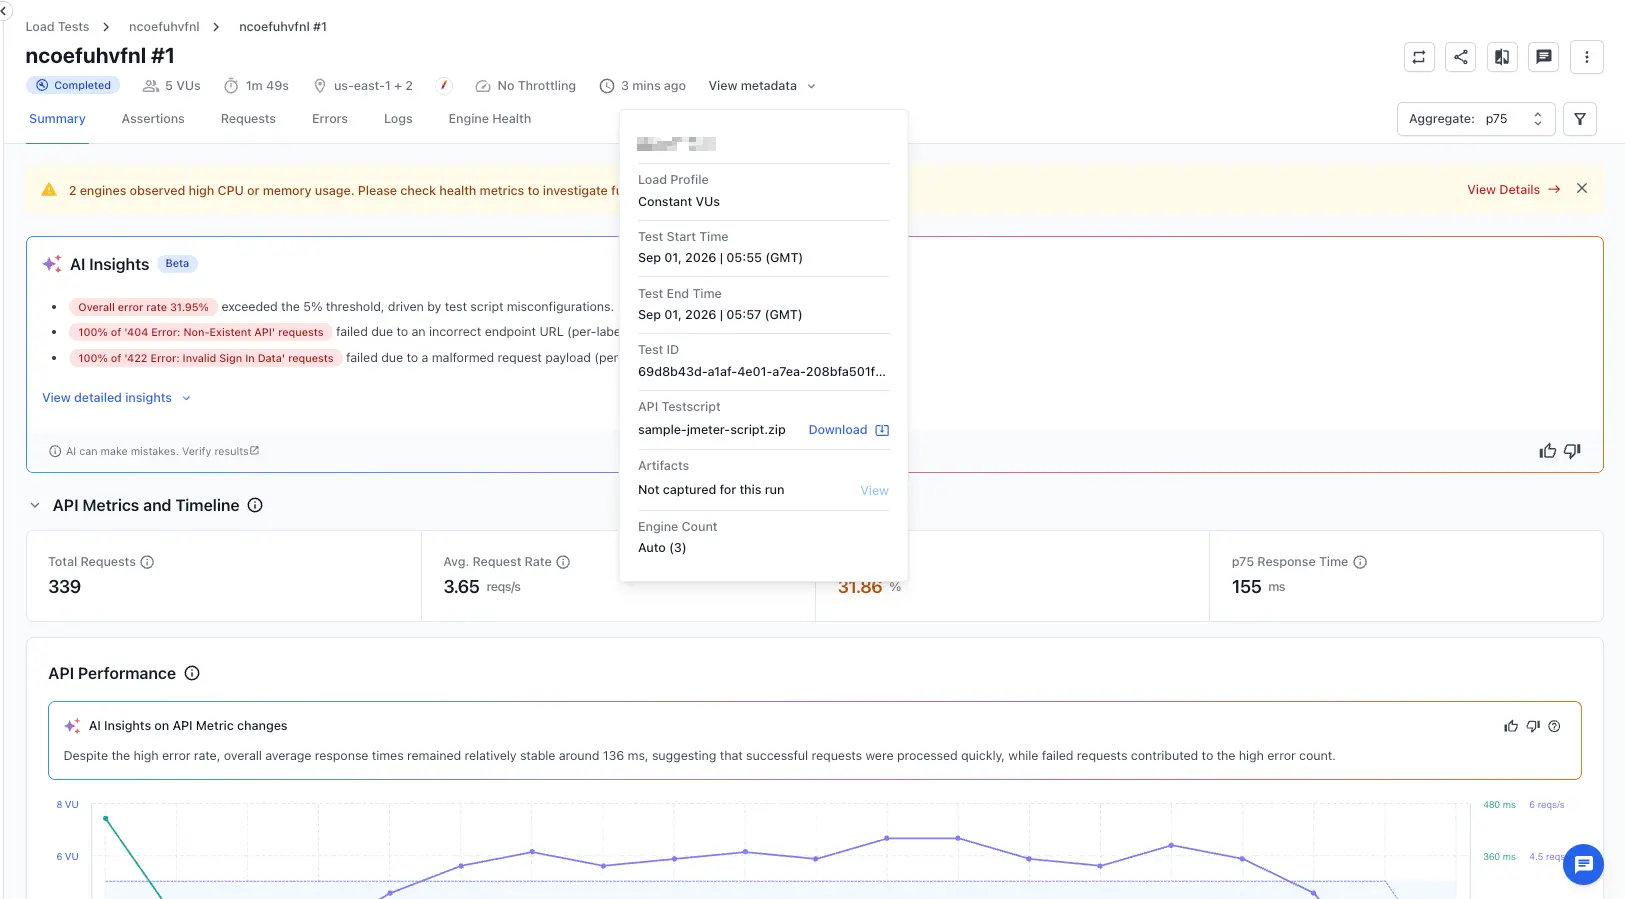
The Engine Count entry shows the number of engines used for the test.
The metadata also shows the engine count setting in the downloadable PDF report.
Best practices
Follow these recommendations to optimize your use of engine count:
Start small
Test with engine count 1 to establish your baseline response times and throughput. Scale to multiple engines only when you need more capacity.
Match VUs to engines
If you need 4,000 VUs, use engineCount: 4 with 1,000 VUs per engine. Uneven splits work but can give inconsistent per-engine results.
Monitor per-engine performance
Check metrics for each pod in your results to spot if one engine is slower or has higher error rates.
Test your script first
Run your test script on a single engine before scaling horizontally. This catches script errors before they affect a multi-engine test.
Troubleshooting
If you’re experiencing issues with engine count, refer to these common solutions:
Common issues and solutions
I set engine count but test results look the same
Make sure you are using a supported framework. For CLI tests, engine count works with JMeter only. For UI Builder tests, all frameworks are supported. Also verify that your account has engine-count entitlement.
Verify that your total VU count actually increases when you increase engine count. The total VUs should increase by roughly 1,000 per additional engine.
My test queued or timed out
Large engine counts can queue while waiting for pod availability. Check how many tests are already running on your account.
Try reducing engine count or running tests at different times. Contact BrowserStack support if you regularly need more capacity.
My results show different metrics per engine
This is normal. BrowserStack shows aggregated metrics across all engines plus per-engine breakdowns. Response times, error rates, and throughput are summed across all engines to give you total test metrics.
Check per-engine metrics to identify if individual pods are underperforming.
Related topics
- Choose a framework for an overview of the supported load testing frameworks.
- Configure load parameters to set virtual users, ramp profiles, and thresholds.
- Load Testing API reference for the full API documentation.
We're sorry to hear that. Please share your feedback so we can do better
Contact our Support team for immediate help while we work on improving our docs.
We're continuously improving our docs. We'd love to know what you liked
We're sorry to hear that. Please share your feedback so we can do better
Contact our Support team for immediate help while we work on improving our docs.
We're continuously improving our docs. We'd love to know what you liked
Thank you for your valuable feedback!