
 Join our Discord
Dynatrace integration for BrowserStack Load Testing
Learn how to send BrowserStack Load Testing metrics and events to Dynatrace so you can correlate load-test traffic with application and infrastructure performance.
Use this guide to connect BrowserStack Load Testing with Dynatrace so that you can correlate test activity with backend performance, infrastructure health, and user experience in a single place.
Prerequisites
Before you enable the Dynatrace integration, make ensure you have:
- Dynatrace environment: A Dynatrace SaaS or Managed environment that can receive metrics over the v2 metrics ingest API.
- Dynatrace platform token: A platform token created for a user or service account that has write access to metrics and events (for example, Storage: metrics: write and Storage: events: write). For details, see the Dynatrace platform token documentation.
- BrowserStack Load Testing account: Access to BrowserStack Load Testing with permission to configure integrations for your organization.
- Network access: Outbound access from BrowserStack infrastructure to your Dynatrace metrics ingest endpoint.
Sending BrowserStack Load Testing metrics to Dynatrace consumes custom metrics in your Dynatrace account. Before you enable the integration for large or long-running tests, review your Dynatrace licensing and metric quotas so you do not exceed your metric limits.
Integration overview
BrowserStack Load Testing streams metrics and events to your Dynatrace environment so you can analyze how your systems behave under load.
For an overview of all APM options, see Application Performance Monitoring integration.
Core capabilities:
- Metric streaming: BrowserStack aggregates performance data into short time buckets and pushes it to Dynatrace over HTTPS.
- Virtual user metrics: Track how many virtual users (VUs) are active, how long tests run, and how many requests they generate.
- Error and latency metrics: Monitor error rates and response-time percentiles to identify performance regressions.
- Browser metrics: For browser-based load tests, capture core web vitals such as LCP, FCP, CLS, and INP.
- Dimensions and tags: Each metric includes dimensions (for example, project name, test name, scenario, and region) so that you can slice and filter results inside Dynatrace.
Generate a Dynatrace platform token
Use a Dynatrace platform token so that BrowserStack can authenticate against the Dynatrace metrics ingest API.
Follow these steps in your Dynatrace environment:
Open Dynatrace platform tokens
- Sign in to your Dynatrace environment.
- Open the Platform tokens page in your Dynatrace environment. For navigation details, see the Dynatrace platform token documentation.
Create a platform token
- Click Generate new token.
- Enter a descriptive name, such as
browserstack-load-testing. - Ensure that the user or service account for this token has write permissions for metrics and events (for example, Storage: metrics: write and Storage: events: write).
- (Optional) Add any additional permissions required by your organization, such as access for dashboards if you plan to automate dashboard creation.
Save and secure the platform token
- Click Generate and copy the platform token value.
- Store the platform token in a secure location such as a secrets manager or CI/CD secret, and expose it to BrowserStack as an environment variable (for example,
DYNATRACE_API_TOKEN). - Verify that you do not commit the raw platform token to source control or share it in logs or screenshots.
- Use this environment variable (for example,
DYNATRACE_API_TOKEN) when you configure Dynatrace under theapmblock inbrowserstack-load.yml.
After you generate the token, store it securely. You can reference it in your BrowserStack Load Testing configuration through an environment variable.
Supported metrics and dimensions
BrowserStack Load Testing sends the following metrics to Dynatrace.
| Metric name | Description |
|---|---|
browserstack.vu.max |
Maximum number of virtual users (VUs) reached during the test. |
browserstack.vu.started |
Total number of VUs that started successfully. |
browserstack.vu.ended |
Total number of VUs that completed or were stopped. |
browserstack.test.duration |
Total test execution time, in seconds. |
browserstack.requests.total |
Total number of HTTP requests generated during the test. |
browserstack.requests.rate.avg |
Average request rate, in requests per second. |
browserstack.errors.percentage |
Percentage of failed requests during the test window. |
browserstack.response.time.avg |
Average response time across all requests, in milliseconds. |
browserstack.response.time.p90 |
90th percentile response time, in milliseconds. |
browserstack.response.time.p95 |
95th percentile response time, in milliseconds. |
browserstack.response.time.p99 |
99th percentile response time, in milliseconds. |
browserstack.response.time.max |
Maximum response time observed, in milliseconds. |
browserstack.response.time.min |
Minimum response time observed, in milliseconds. |
browserstack.browser.lcp |
Largest Contentful Paint, in seconds, for browser-based load tests. |
browserstack.browser.fcp |
First Contentful Paint, in seconds, for browser-based load tests. |
browserstack.browser.ttfb |
Time to First Byte, in milliseconds, for browser-based load tests. |
browserstack.browser.inp |
Interaction to Next Paint latency, in milliseconds, for browser-based load tests. |
browserstack.browser.cls |
Cumulative Layout Shift score for browser-based load tests. |
browserstack.browser.network.calls.total |
Total number of browser network calls recorded during the test window. |
Dimensions
Every metric sent to Dynatrace includes dimensions that help you filter and group data.
| Dimension key | Description |
|---|---|
browserstack.executorName |
User who has triggered the test. |
browserstack.region |
Load zone or region (for example, us-east-1, eu-west-2) generating the traffic. |
Use these dimensions to build focused charts and dashboards.
Lifecycle events
In addition to metrics, BrowserStack Load Testing can send lifecycle events to Dynatrace so you can align spikes or drops in performance with changes in test state.
Typical events include:
- Test initialized: Marks the setup phase and environment preparation.
- Test running: Marks the start of the main load window.
- Ramp up started or ramp down started: Indicates changes in active VUs.
- Test completed, passed, or failed: Reports the final status and outcome of the test.
- Test timed out: Indicates that the test did not finish gracefully within the configured duration.
You can use these events as annotations on Dynatrace charts or in dashboards to understand what was happening during a particular time range.
Configure Dynatrace from the CLI
You configure Dynatrace integration in the browserstack-load.yml file. The following example shows a minimal configuration that enables Dynatrace and sends metrics to the v2 ingest endpoint.
This configuration lives under the top-level integrations block in browserstack-load.yml alongside any other APM tools you configure.
Best practices:
- Store the Dynatrace platform token (the
apiTokenvalue) in an environment variable (for example,DYNATRACE_API_TOKEN) instead of hard-coding it in the YAML file. - Make sure that the Dynatrace endpoint URL and token match the region and account where you want to receive load-test data.
Switching to OpenTelemetry (OTel)
If you already have Dynatrace connected to BrowserStack Load Testing, you can switch from the native SDK path to OpenTelemetry (OTLP) push.
Switch to OpenTelemetry (OTel)
OTLP is a vendor-neutral standard. Switching to OTel on Dynatrace lets you also push metrics in parallel to other observability tools (Honeycomb, Grafana Cloud, CloudWatch, or self-hosted collectors) without reconfiguring. You keep your Dynatrace connection intact - it’s just an alternative transport path.
How to switch
- In BrowserStack, open Load Testing > Project Settings > Integrations.
- Find the Dynatrace tile and click it to expand its configuration.
- Look for the Send via OpenTelemetry section and toggle it on to enable OTLP push.
- You’ll be prompted to provide a Classic API Token (in addition to the Platform Token you already saved).
- Enter your Classic API Token and click Save.
- (Optional) Click Add Metrics/Events/Header to customize which metrics and events to send.
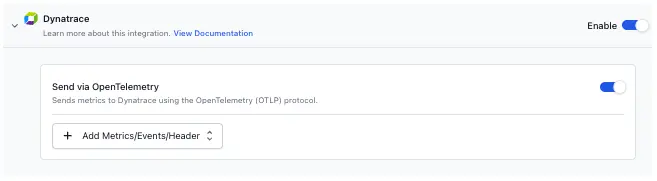
Dynatrace requires different tokens for the two paths:
- Platform Token - used by the Direct path (Grail API, already configured).
- Classic API Token - required for the OTel push path.
If the Classic API Token expires during a test run, BrowserStack stops only the OTel push. Your Direct path continues working with the Platform Token. You’ll see an “APM credentials invalid” flag on the affected run with a prompt to re-save the Classic token.
For more details on OpenTelemetry and custom OTLP collectors, see Configure Load Testing with Custom OpenTelemetry (OTLP).
Next steps
After you save your changes to browserstack-load.yml, run your load test from the CLI or dashboard. When the test completes, open Dynatrace and search for the configured metric names and dimensions to validate that data is flowing correctly. Then build dashboards and alerts based on the metrics that matter most to your team.
We're sorry to hear that. Please share your feedback so we can do better
Contact our Support team for immediate help while we work on improving our docs.
We're continuously improving our docs. We'd love to know what you liked
We're sorry to hear that. Please share your feedback so we can do better
Contact our Support team for immediate help while we work on improving our docs.
We're continuously improving our docs. We'd love to know what you liked
Thank you for your valuable feedback!