Get your setup working faster. Join our Discord for optimisation tips from elite testers.Join our Discord
Browser test results
Analyze browser test results including web vitals, network performance, and test case outcomes.
The Browser tab is divided into three sub-tabs: Web Vitals, Network, and Tests. Use these to drill into browser performance, user experience metrics, and network behavior during load testing.
Identify slow URLs, inspect page-load phases, and drill into per-URL network calls during a browser load test.
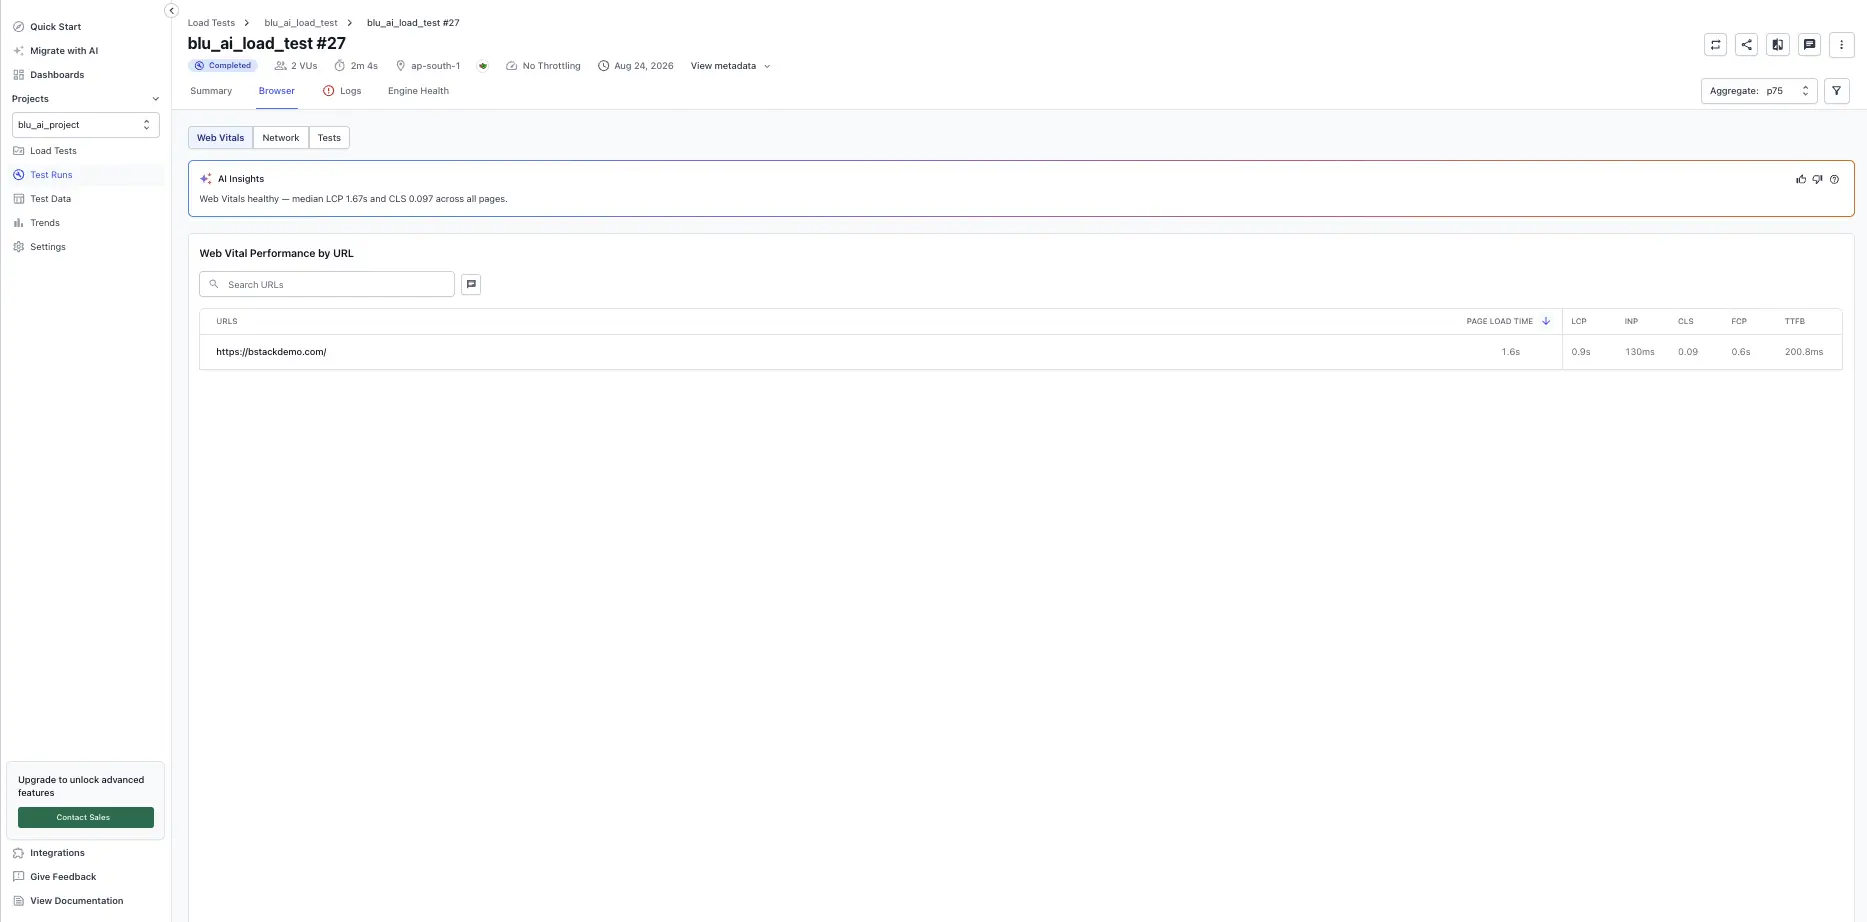
The Web Vitals tab highlights the most important frontend performance signals for your application during load. Use this page to identify slow URLs, compare key metrics across the site, and drill into the network calls that explain a slow page.
Worst-performing URLs
The Worst-performing URLs chart surfaces the top 5 URLs with the worst values for the selected metric. Use the toggle to switch between LCP, INP, CLS, FCP, and TTFB. Values represent the percentile selected in the report header (for example, p75) across all virtual users.
Use this view to decide which URLs to prioritize for optimization.
Detailed URL table
The Detailed URL table lists every tested URL with its Web Vitals values and a breakdown of page-load phases (for example, DNS, connect, request, response, render). Sort by any column or search by URL to narrow the list. A dash (-) in a cell means the metric was not captured for that URL.
For multiple scenarios tests, a Scenario column shows which scenario each URL belongs to, and the report-wide Scenarios filter narrows the table to the selected scenarios.
URL drill-in: per-URL network calls
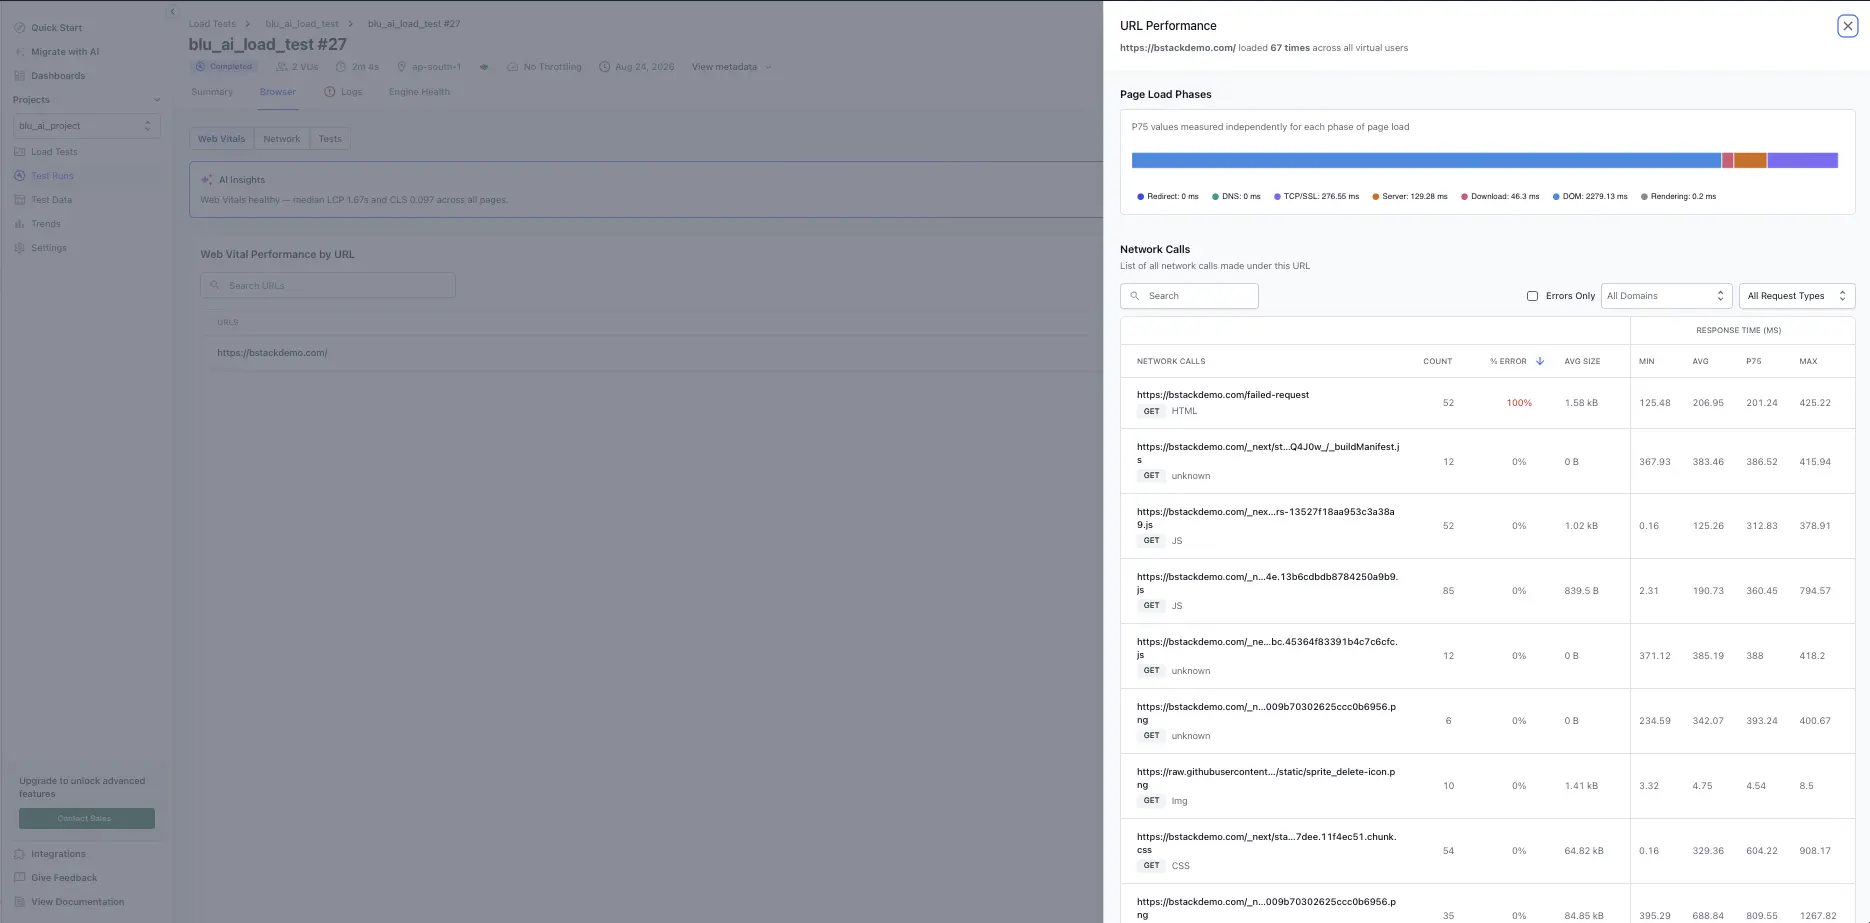
Select any row in the detailed URL table to open the per-URL drill-in view. This view lists every network call made while loading that URL along with each call’s response code and individual response-time performance, so you can pinpoint which API or asset is responsible for a slow page.
URL Performance breakdown
This view displays a comprehensive breakdown of your URL’s performance, including page-load phase distribution, individual network call performance, and response-code metrics. Use this data to understand where bottlenecks occur and identify optimization opportunities.
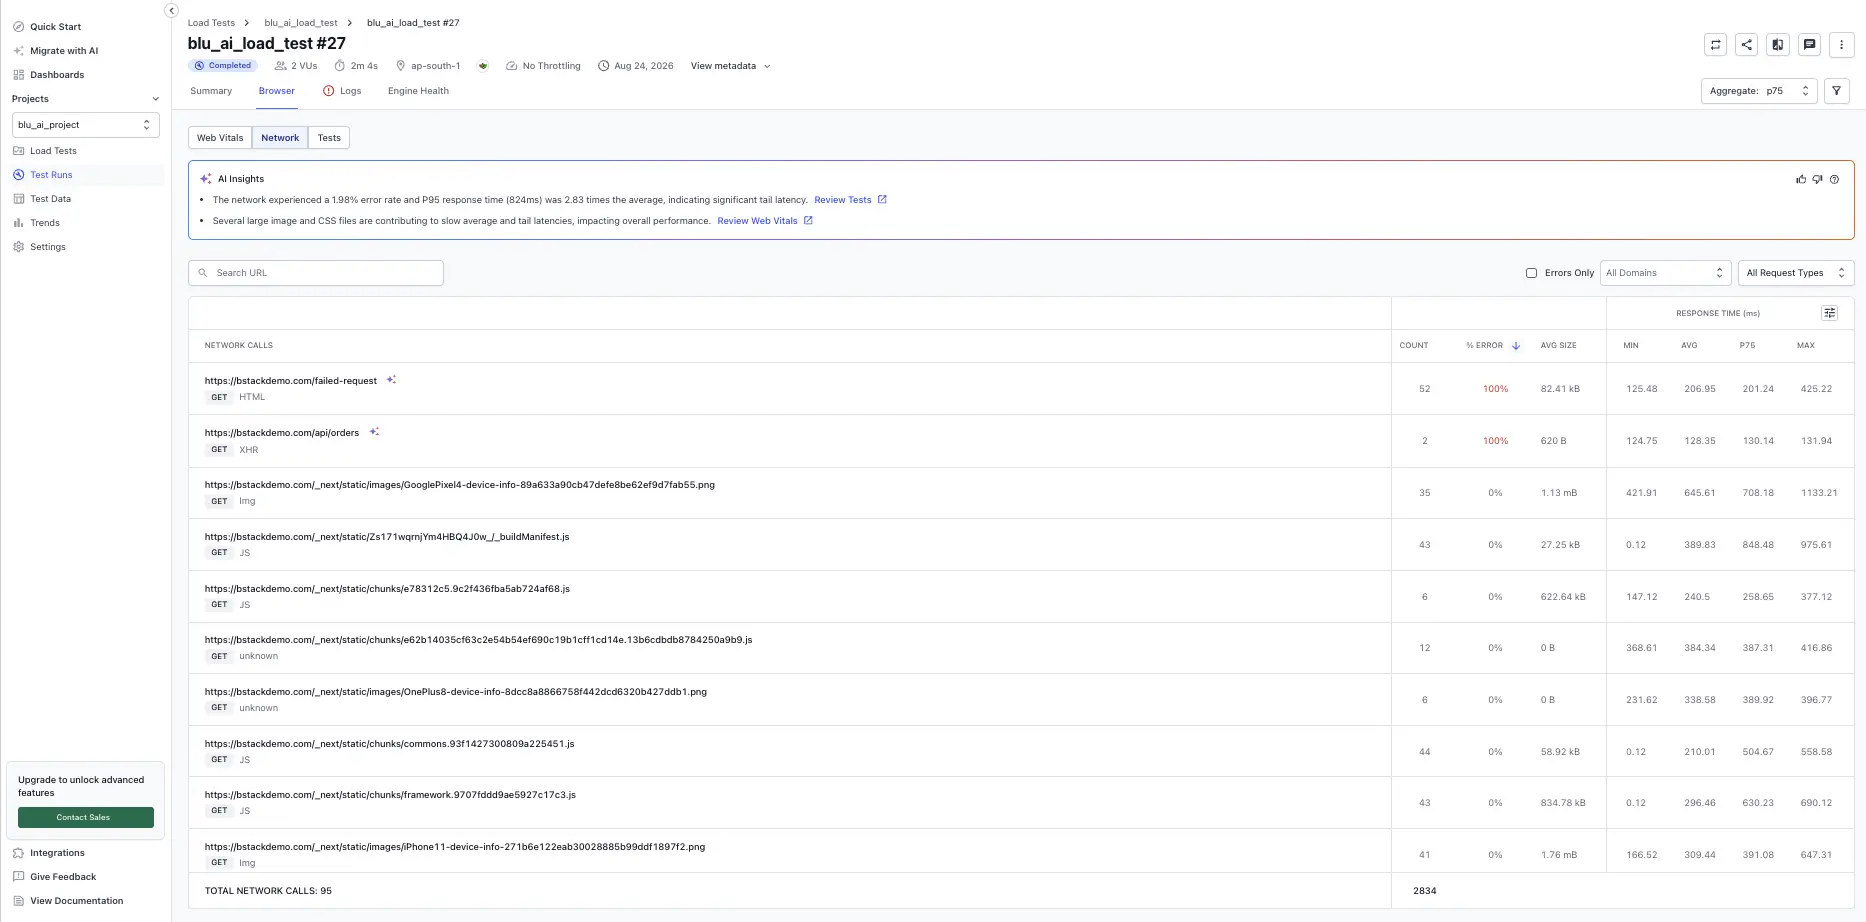
Use the Network tab to analyze all HTTP requests initiated by browsers during load testing. This includes images, scripts, stylesheets, API calls, fonts, and other resources. Inspect every network request, filter by type or error status, and drill into per-call diagnostics.
Network calls overview
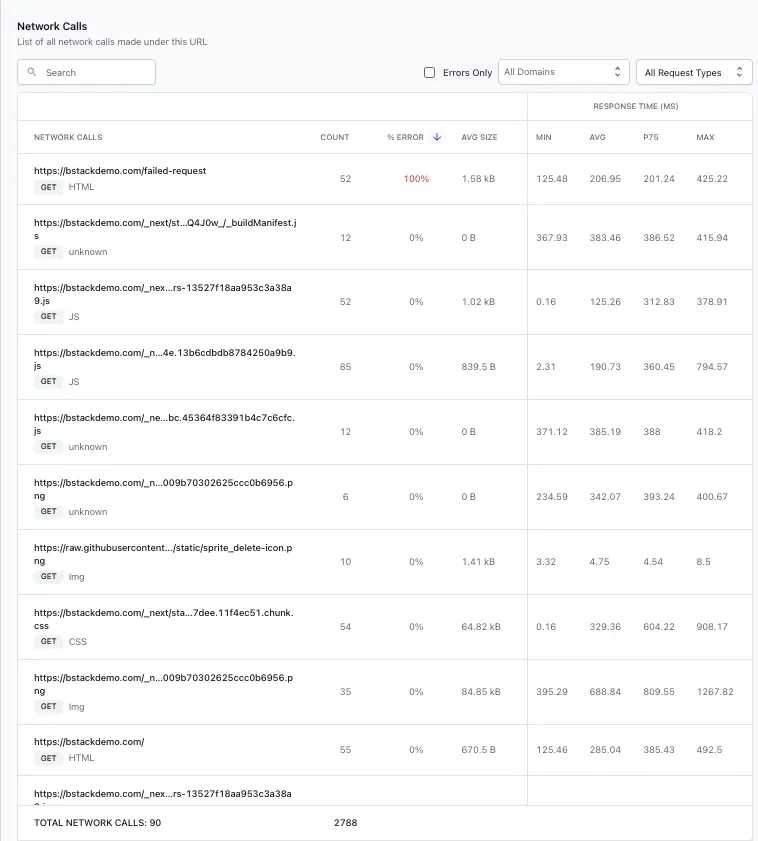
The Network tab provides a comprehensive list of all network requests during load tests, enabling analysis of request patterns, identification of slow or failing endpoints, and troubleshooting of network performance issues.
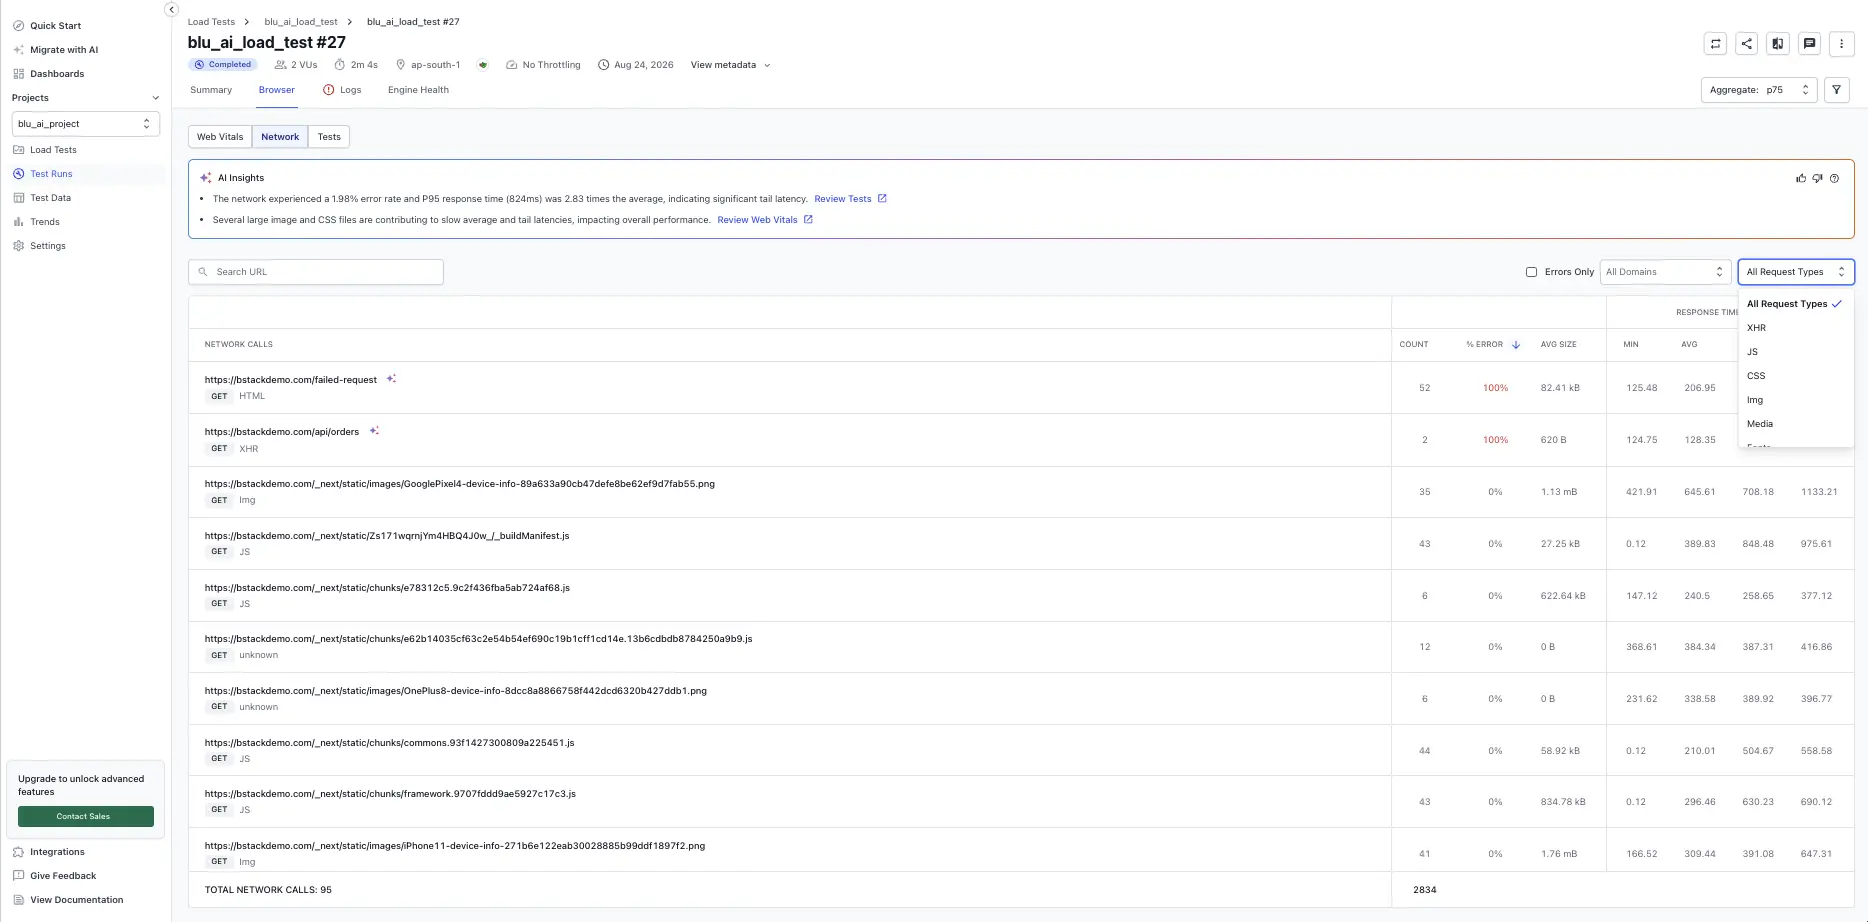
Filter requests
Use the controls at the top to narrow the view:
Errors only checkbox: Display only non-2xx responses (4xx and 5xx, timeouts).
Request type chips: Filter by XHR, HTML, Script, Image, and other categories.
Sorting options: Sort by error percentage or average response time.
Scenario filtering: For multi-scenario tests, focus on specific scenarios.
Search box: Find requests by URL substring.
Network metrics table
The main table shows per-request data with the following columns:
Column
Purpose
Network calls
URLs and request types, such as HTML, Image, Script, and XHR
Scenario
Associated scenario for multi-scenario tests
Count
Request frequency across all virtual users
% Error
Rate of 4xx and 5xx responses
Avg size
Average payload size in bytes
Response times
Avg, Min, P90, P95, Max values in milliseconds
An aggregate count row at the bottom reports the total count of all network calls in the current view, broken down by request type.
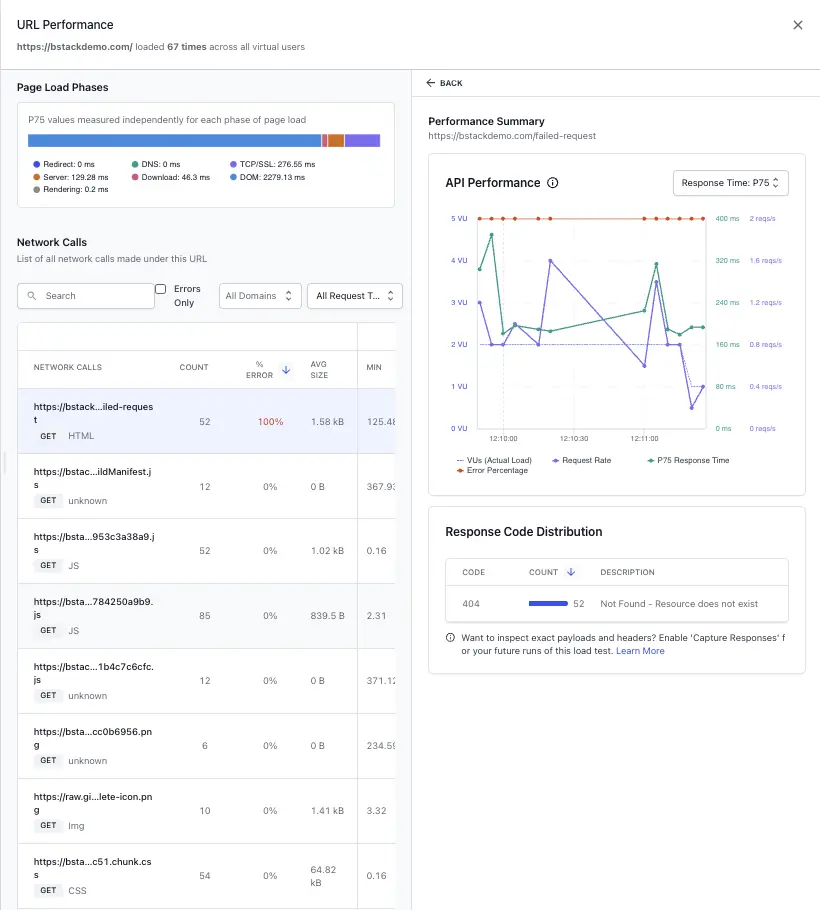
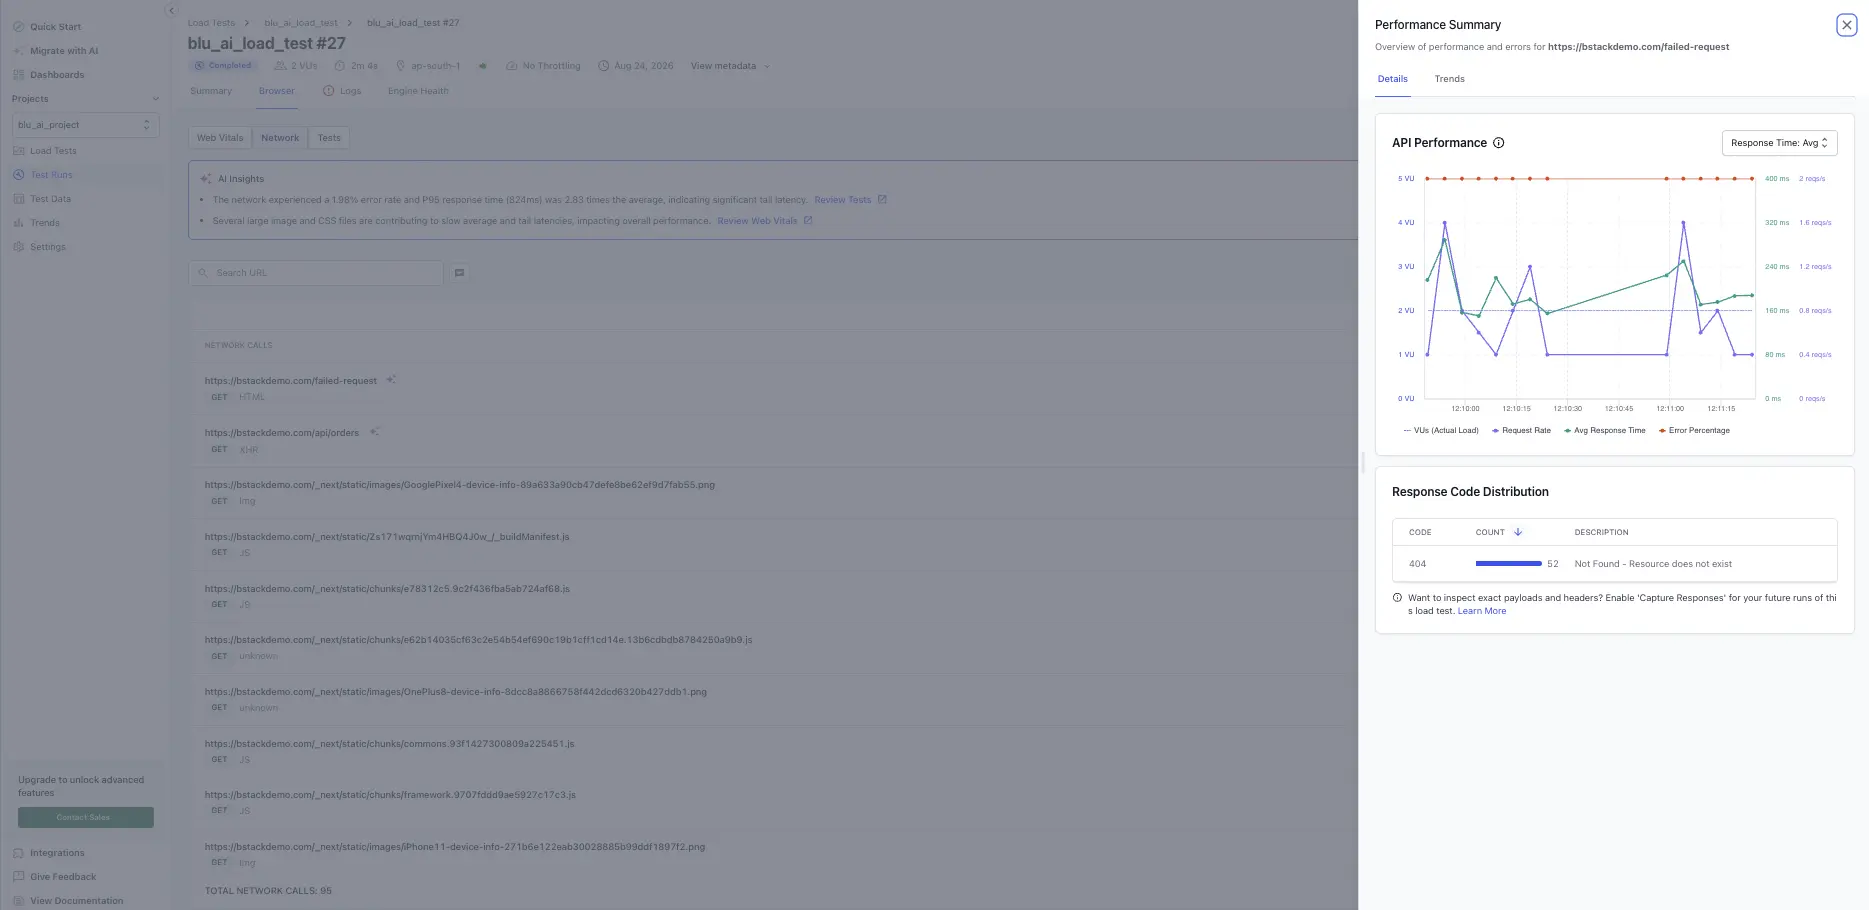
Per-call diagnostics
Select any request row to open its full diagnostic detail.
Time-series trends: How response times changed across the test duration
Response-code breakdown: Distribution of status codes returned
Common patterns to investigate
When you scan the network table, look for these patterns:
Large images without optimization: Sort by Size. High-MB images per page slow LCP.
Slow API calls: Filter to XHR. Look for duration spikes and correlate with load peaks.
Failed assets, 4xx and 5xx: Filter “Errors only” for broken paths or rate-limited endpoints.
Third-party latency: Filter by domain. Third-party CDNs or analytics may bottleneck under load.
High error rate on specific endpoints: Use % Error sort to identify problematic APIs.
Network data is available on Browser Load Testing runs only, not on Hybrid runs.
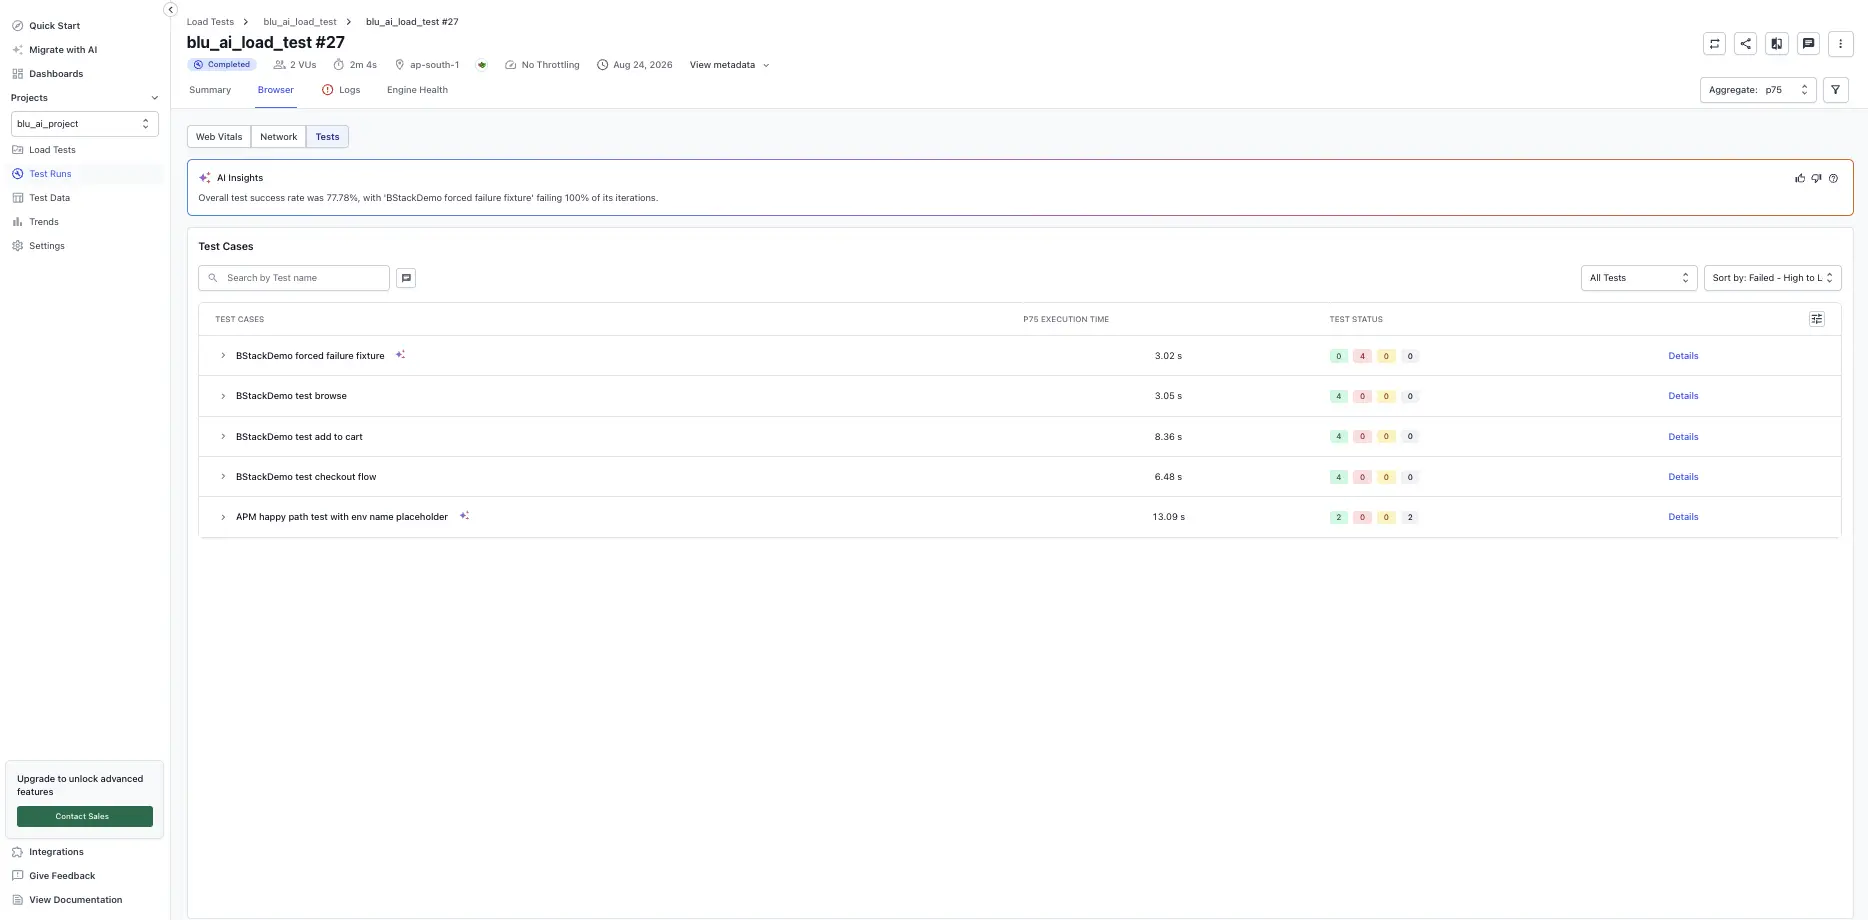
The Tests tab lists every test case executed during the run, surfaces its outcome, and links the result back to the underlying test reporting and analytics record. Use this tab to confirm functional correctness under load and to triage any tests that did not pass.
What you can do here
On this tab, you can:
Review the four status counts on every test case row: Passed, Failed, Skipped, and Other status (across virtual users).
Search by test name to locate a specific test case.
Filter the list with the All Tests dropdown, or sort by status (for example, Failed - High to Low) to bring the worst-performing tests to the top.
Open the Details link on any row to inspect a single test’s failure profile.
Test status reference
The following table describes the possible test statuses you may see on the Tests tab:
Status
Meaning
Passed
Test ran end-to-end without assertion failures or runtime errors
Failed
Test ran but one or more assertions or steps failed
Skipped
Test was not executed due to preconditions or filters
Other
Test didn’t complete due to non-functional issues like aborted runs or engine errors
Drill into a single test
Select Details on any test case row to open the per-test panel. The panel shows:
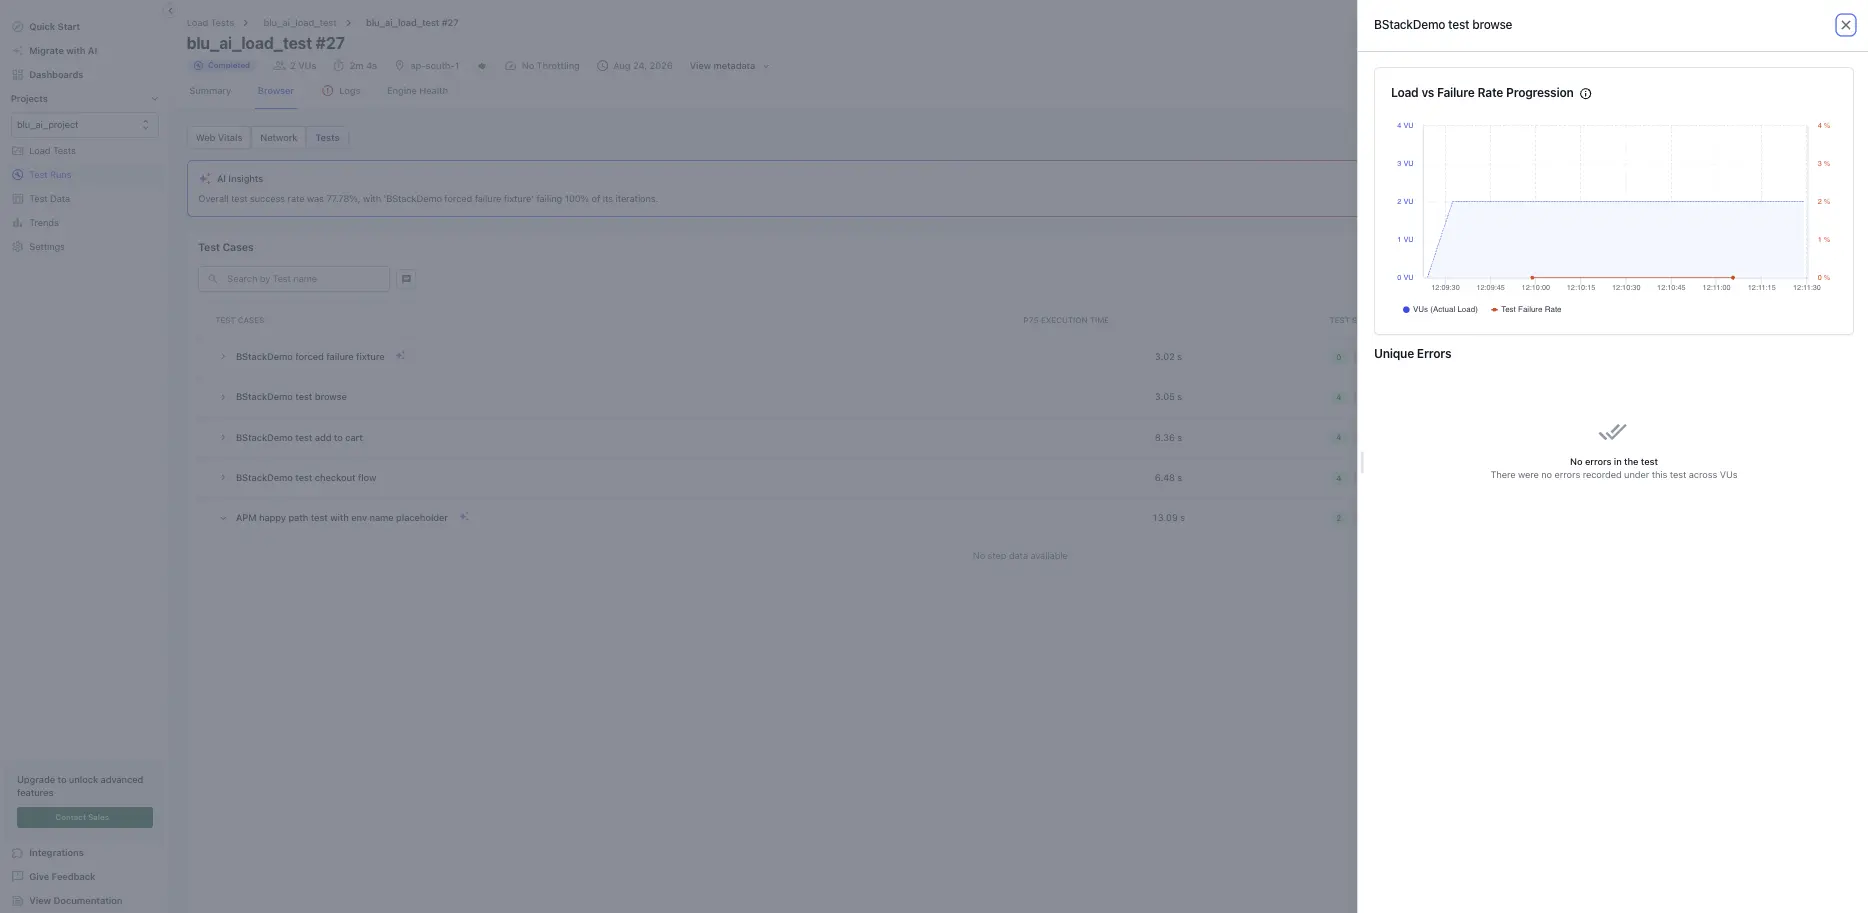
Load vs Failure Rate Progression for that single test case: virtual users (actual load) plotted alongside the test failure rate against time, so you can correlate the test’s failures with the run’s load profile.
Unique Errors recorded for that test case across all virtual users.
Use this view to confirm whether a failing test failed under specific load levels and to read its errors without leaving the tab.
Review unique errors
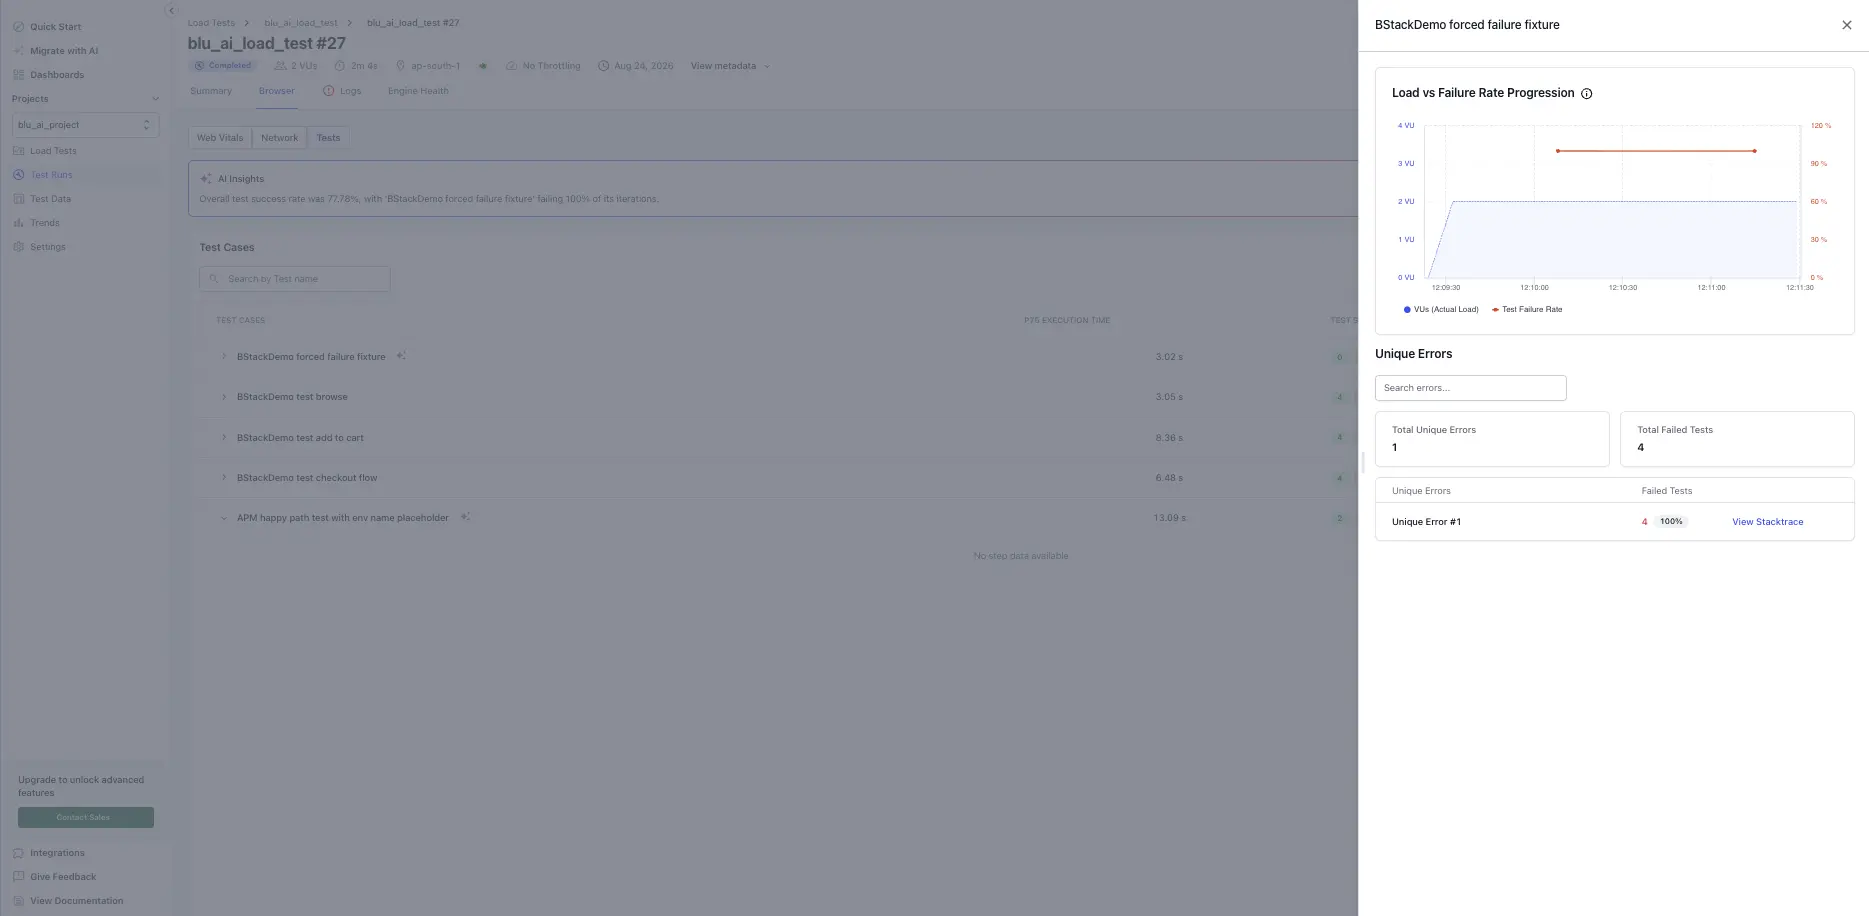
The Unique Errors section of the per-test panel groups every error recorded for a test case across all virtual users into a deduplicated list. This helps you spot the top causes of failure for that test case and decide what to fix first.
The section appears below the Load vs Failure Rate Progression chart when you open a test case’s Details panel. It shows:
Total Unique Errors and Total Failed Tests for the test case.
A table that lists each distinct error, the number of tests it failed, the percentage of failed tests it accounts for, and a View Stacktrace link.
When a test case has many distinct failures, use the search box to find a specific error.
When a test case records no errors, the section shows No errors in the test and notes that no errors were recorded under this test across virtual users. A clean result here means the test case passed for every virtual user that ran it.
Debug a unique error
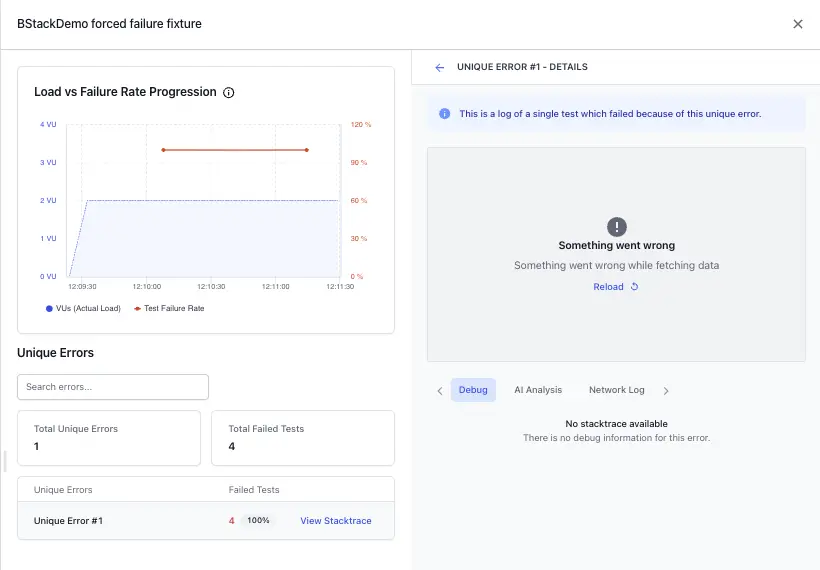
Select View Stacktrace on any error to open the logs for a single test that failed with that error. This view helps you move from what failed to why it failed without leaving the report. It shows:
A session recording of the failed test.
The complete Stack trace for the error.
Debug, AI Analysis, and Network Log tabs for deeper investigation.
A Debug with AI option that explains the likely cause.
Tests tab requires the Test-Results entitlement to view detailed test execution data.
Did this page help you?
We're sorry to hear that. Please share your feedback so we can do better
Contact our Support team for immediate help while we work on improving our docs.
We're continuously improving our docs. We'd love to know what you liked
Thank you for your valuable feedback
Is this page helping you?
Yes
No
We're sorry to hear that. Please share your feedback so we can do better
Contact our Support team for immediate help while we work on improving our docs.
We're continuously improving our docs. We'd love to know what you liked

 Join our Discord