Network tab
Inspect every network request made during a browser load test, filter by request type or error status, and drill into per-call diagnostics.
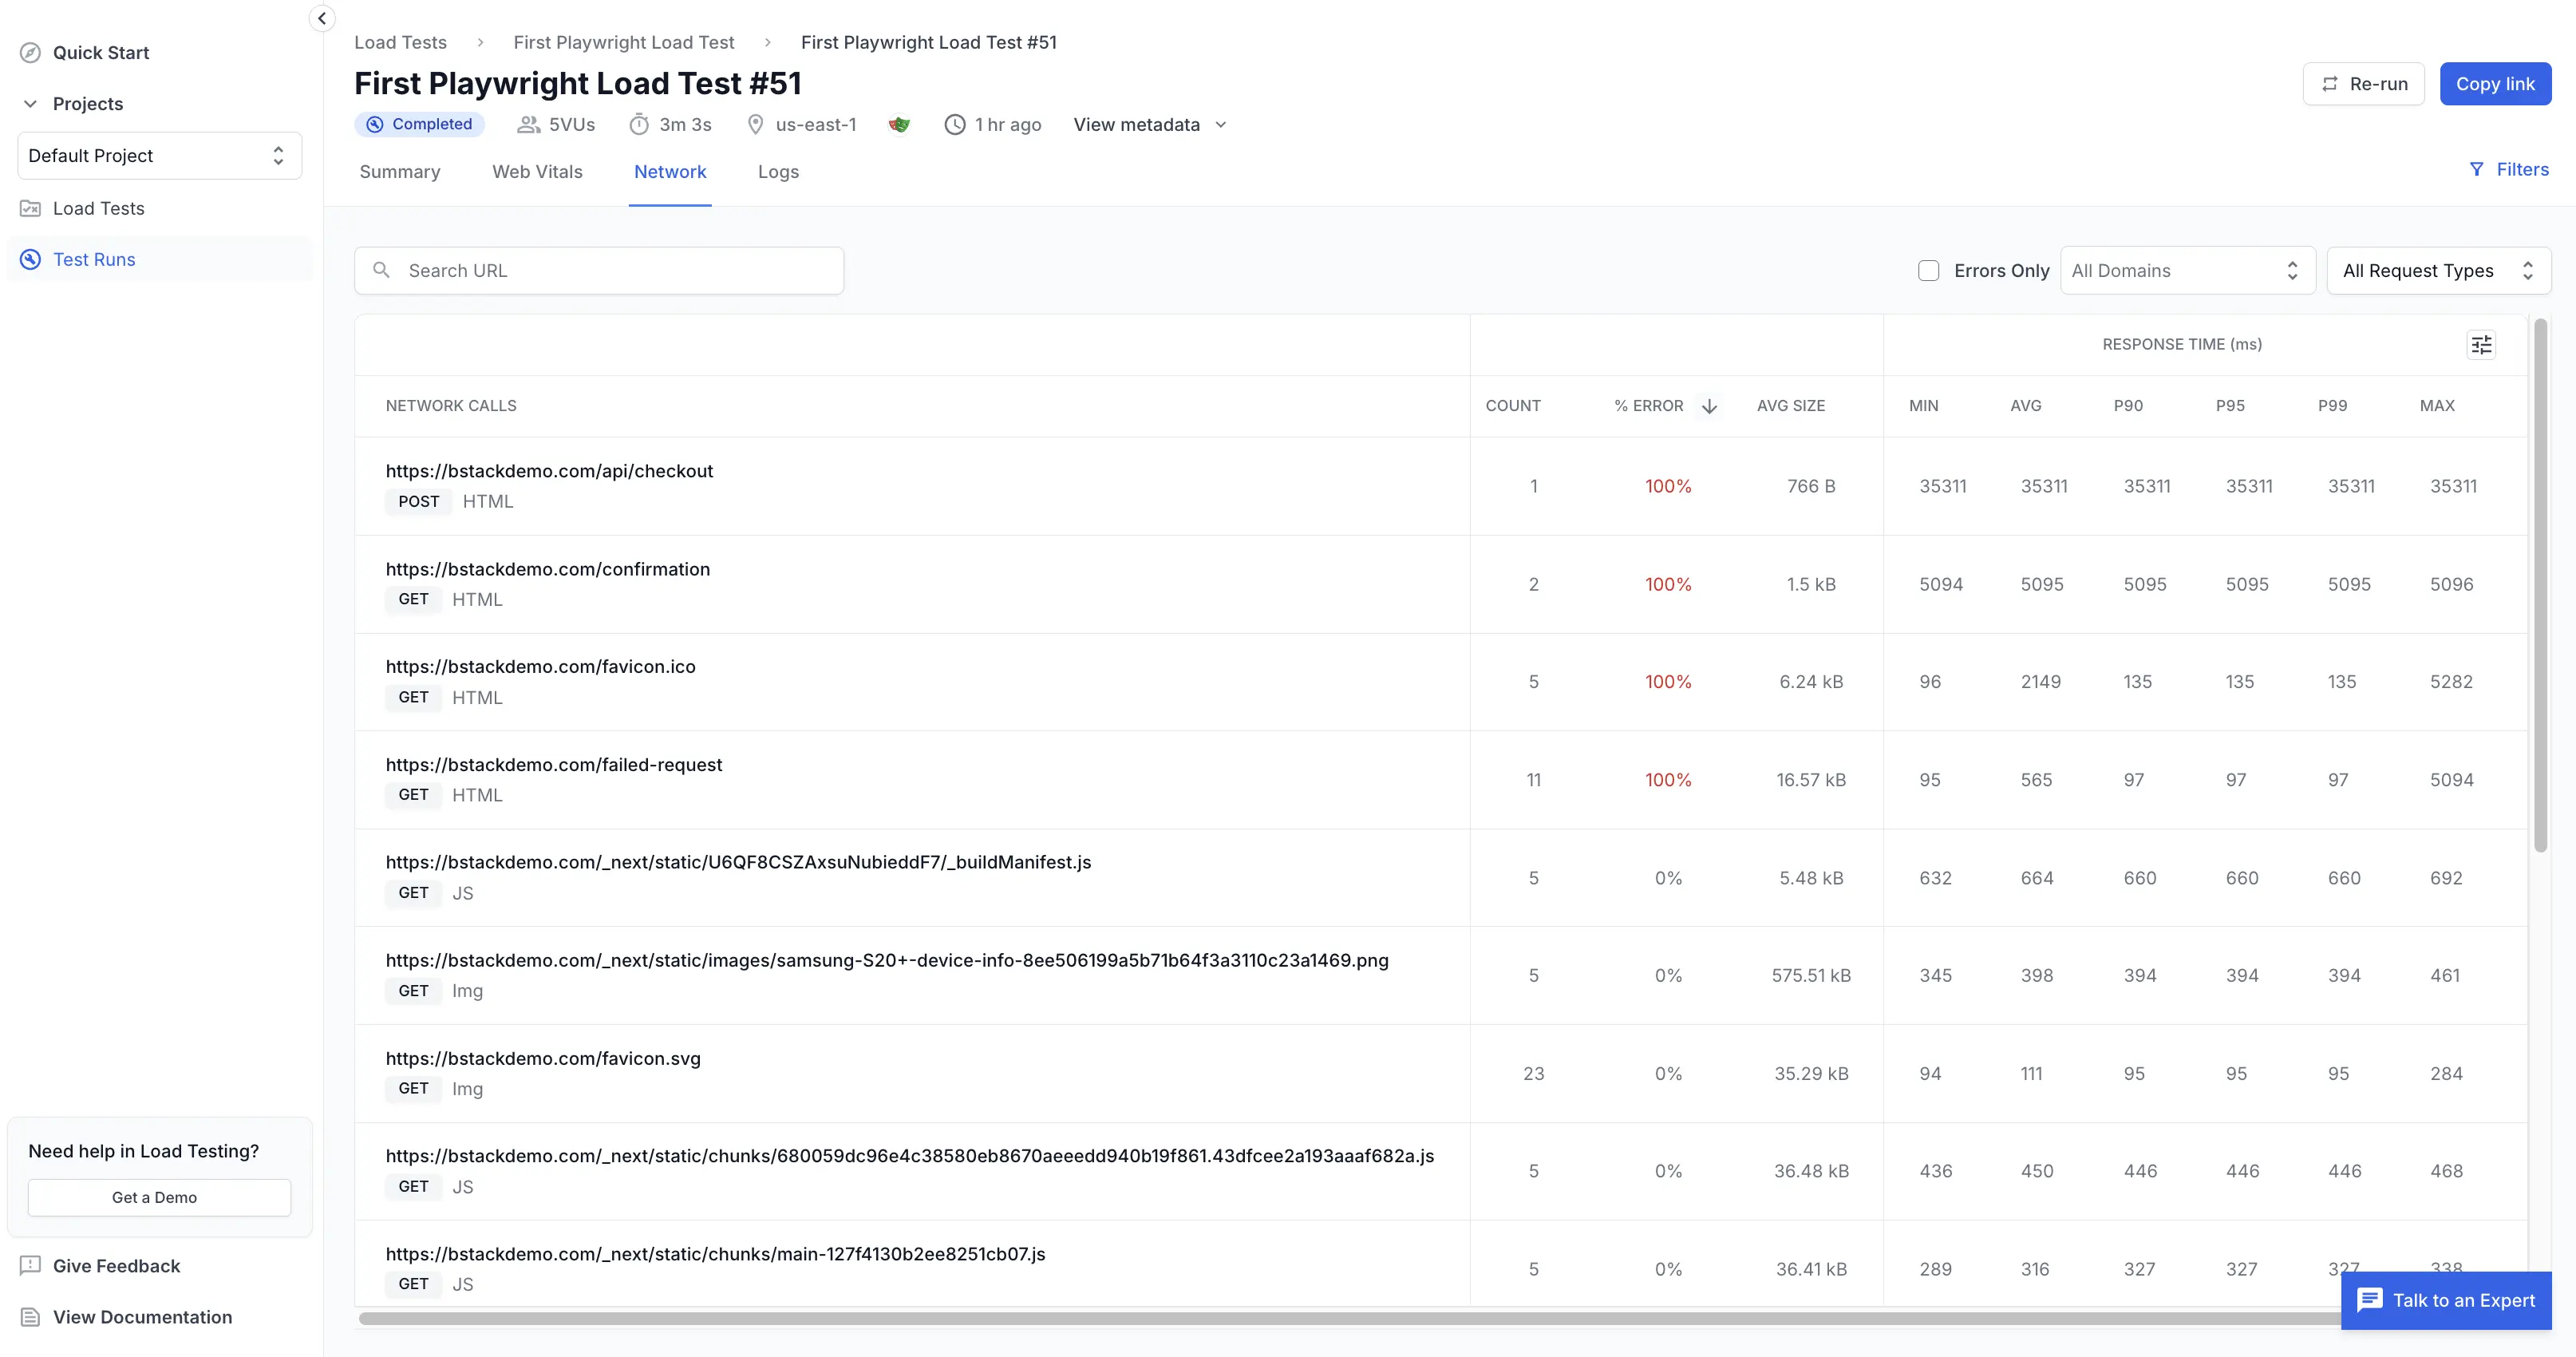
The Network tab lists every network request made during your load test. Use this view to analyze request patterns, identify slow or failing endpoints, and troubleshoot network-related issues affecting application performance.
| Column | Description |
|---|---|
| Network calls | URL and request type (HTML, Image, Script) |
| Scenario | The scenario the request belongs to, shown for multi-scenario tests |
| Count | Frequency of requests |
| % Error | Rate of 4xx and 5xx responses |
| Avg size | Payload size |
| Response times | Avg, Min, P90, P95, Max values |
Aggregate count row
A summary row at the bottom of the network calls list reports the aggregate count of all network calls in the current view, broken down by request type. The aggregate respects the filters you have applied, so it always reflects the calls you are currently looking at.
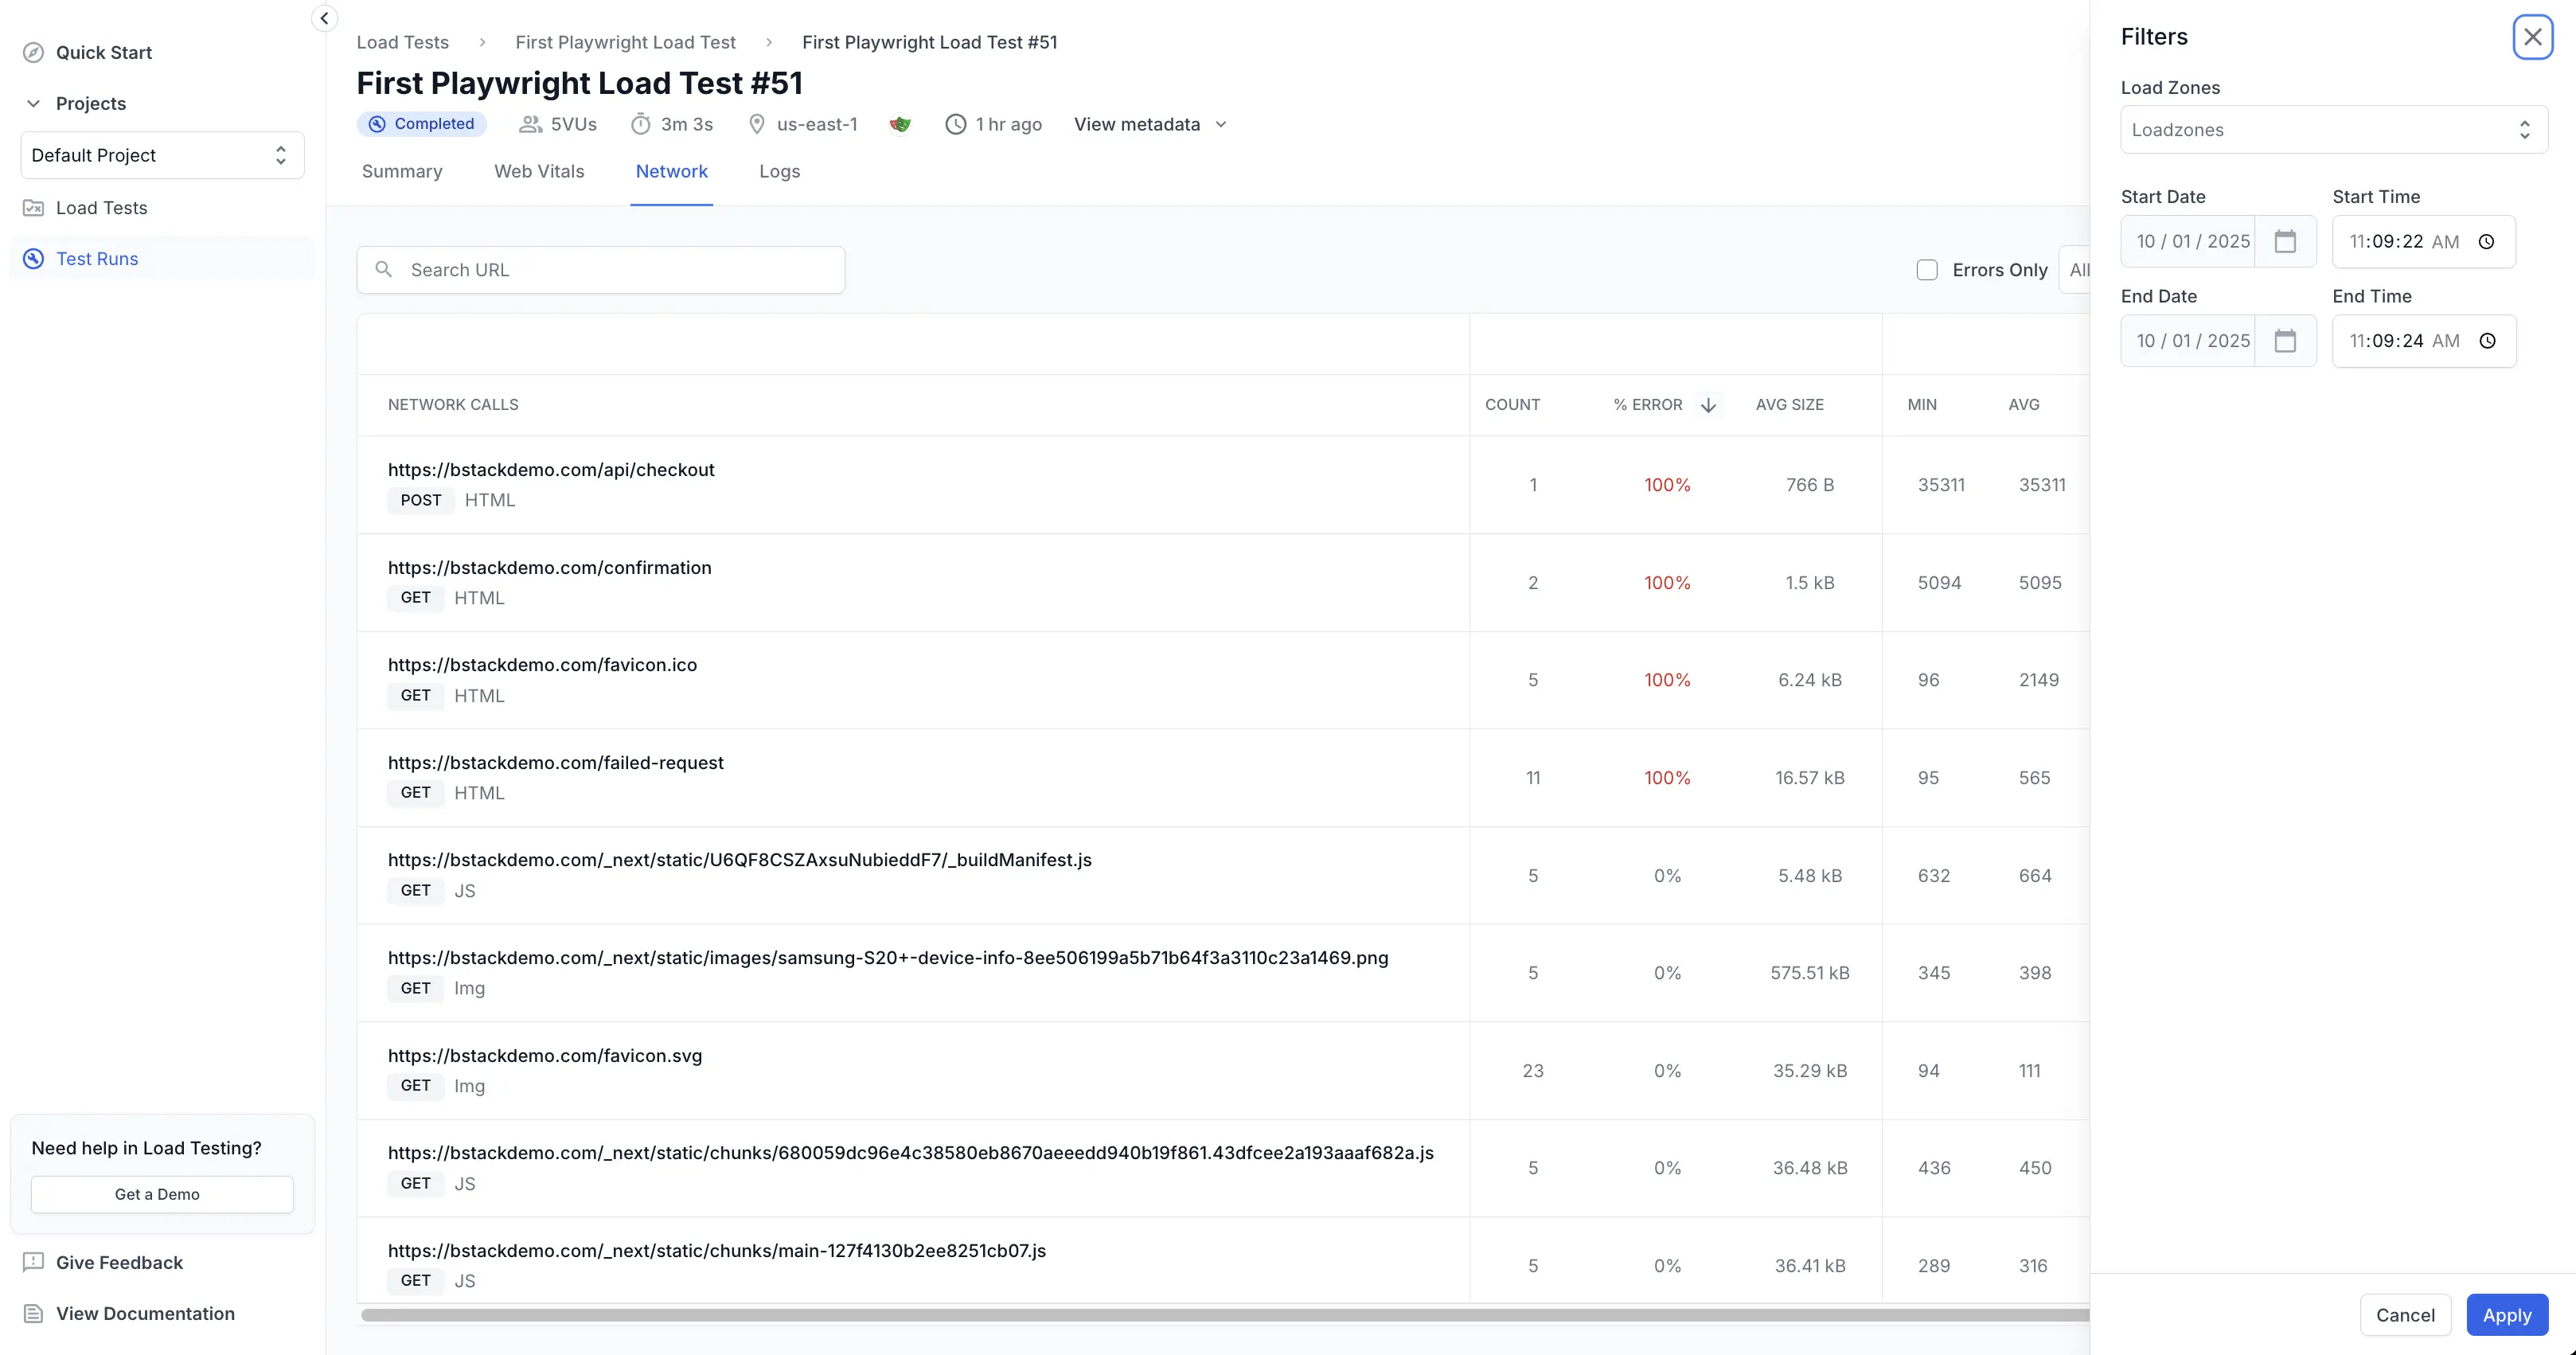
Filter and triage
A row of inline filters sits above the network calls table. Use them to narrow the list before drilling into a specific call:
- Errors only: toggle this checkbox to show only requests that returned a non-2xx response.
- Request type: select one or more chips (for example, XHR, HTML, Script, Image) to filter by request type.
- Sort by % error or Avg. response time: sort the table to surface the slowest or most error-prone calls first.
For multiple scenarios tests, the report-wide Scenarios filter also narrows the network calls to the selected scenarios, and the Scenario column shows which scenario each call came from.
Drill into a single call
Select any row to open a per-call view with time-series trends and a response-code breakdown so you can correlate a failure or slowdown with the load profile.
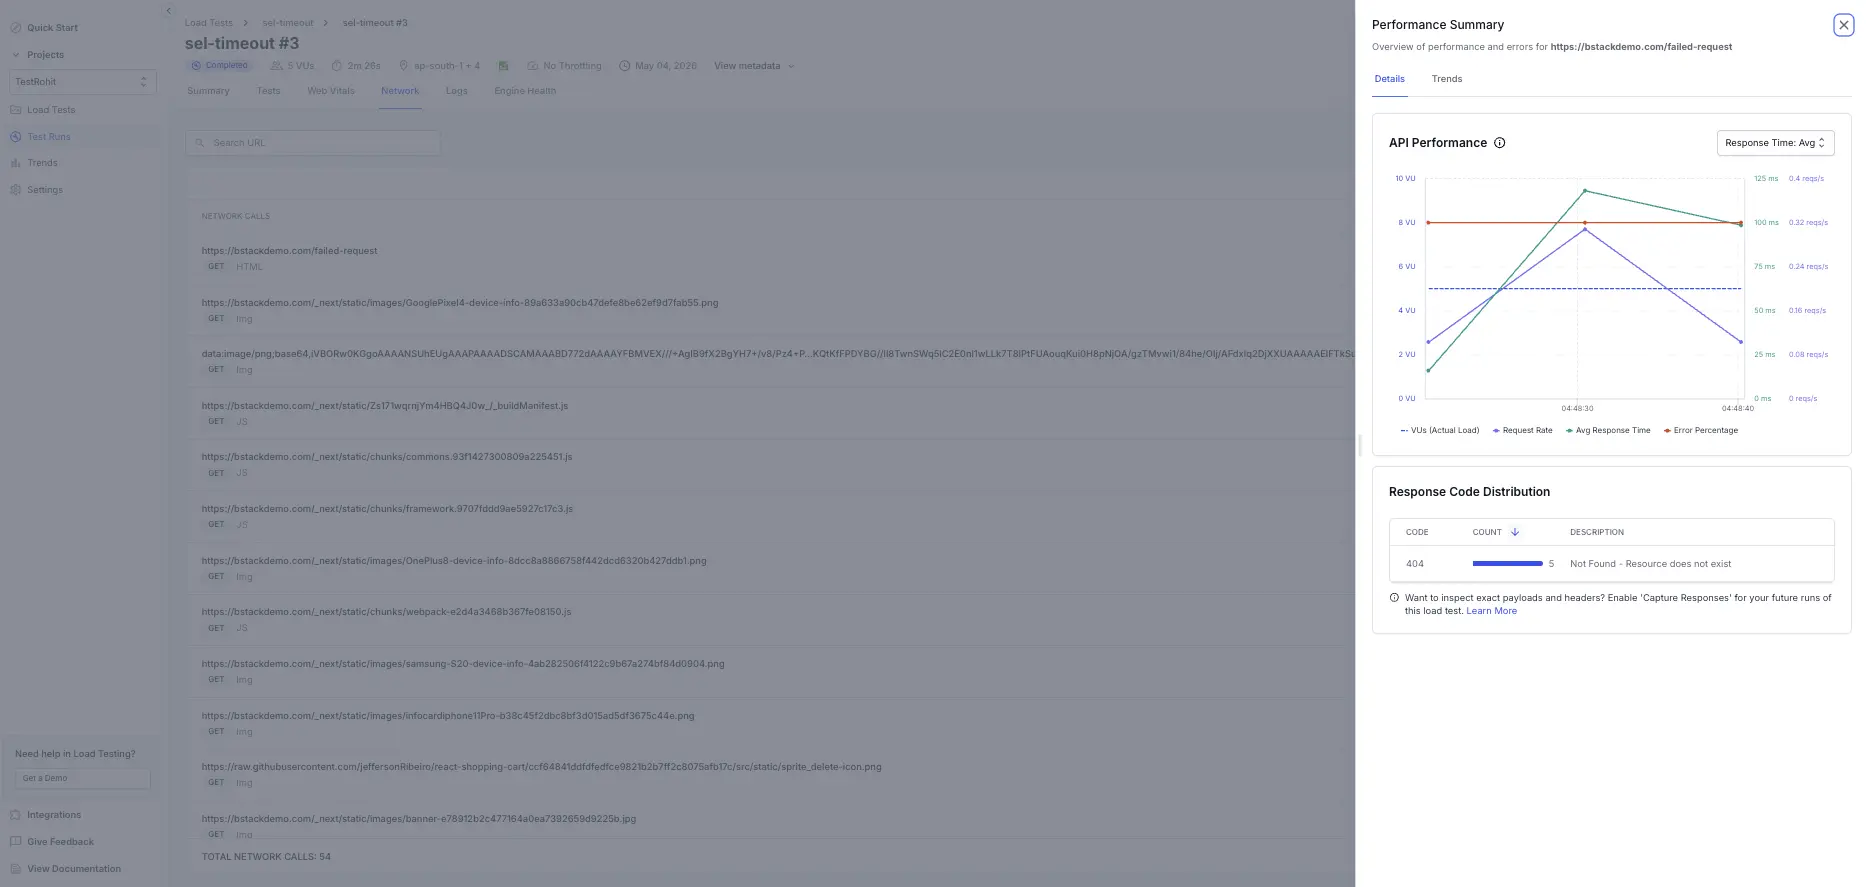
Response codes are only captured for XHR calls in Browser tests. Read more about how to capture response details to enable response-code capture.
We're sorry to hear that. Please share your feedback so we can do better
Contact our Support team for immediate help while we work on improving our docs.
We're continuously improving our docs. We'd love to know what you liked
We're sorry to hear that. Please share your feedback so we can do better
Contact our Support team for immediate help while we work on improving our docs.
We're continuously improving our docs. We'd love to know what you liked
Thank you for your valuable feedback!