Page load time
View how long your pages take to fully load under load, with a phase-by-phase breakdown of where latency is introduced.
Backend metrics such as throughput, error rate, and response time indicate how your servers behave, but they don’t capture how slow the application feels to a real user. Page load time captures that experience in a single number, so you can answer the question most relevant to stakeholders: how slow a page feels to a real user when traffic spikes.
Page load time is available for browser and hybrid load tests. It appears in the Summary tab as an aggregate value and in the Web Vitals tab for each tested URL.
What page load time measures?
Page load time is the duration from the moment the browser starts loading a page to the moment the browser triggers the window.load event, which signals that the document and all its dependent resources have finished loading.
Web Vitals such as LCP, FCP, and TTFB indicate which part of the experience is slow and why. Page load time complements them by reporting the full, end-to-end time a user waits. Under load, small delays across the network, server, and browser add up, and page load time captures that cumulative effect in one intuitive value.
Page load time phases
To help you find the bottleneck, BrowserStack breaks each page load into the following phases:
| Phase | What it measures? |
|---|---|
| Redirect | Time spent following HTTP redirects before the final page loads. A high value points to redirect links you can remove. |
| DNS lookup | Time taken to resolve the hostname into an IP address. A high value points to a slow DNS provider or CDN resolution. |
| TCP/SSL connection | Time taken to open the connection and complete the secure handshake. This reflects network latency and the server’s encryption efficiency. |
| Server processing | Time between the request being sent and the first byte of the response arriving, also called Time to First Byte (TTFB). A high value points to slow database queries, inefficient code, or an overloaded server. |
| Content download | Time taken to download the HTML document. A high value points to a large page or a slow connection. |
| DOM processing | Time the browser takes to parse the HTML and build the page structure. A high value points to heavy JavaScript blocking the main thread. |
| Page rendering | Time from when the page structure is ready until the load event fires, while images, stylesheets, and scripts finish loading. A high value points to heavy assets such as large images or third-party scripts. |
When a page loads slowly, the phase breakdown points you to the layer responsible, whether that’s the network, the server, or the browser.
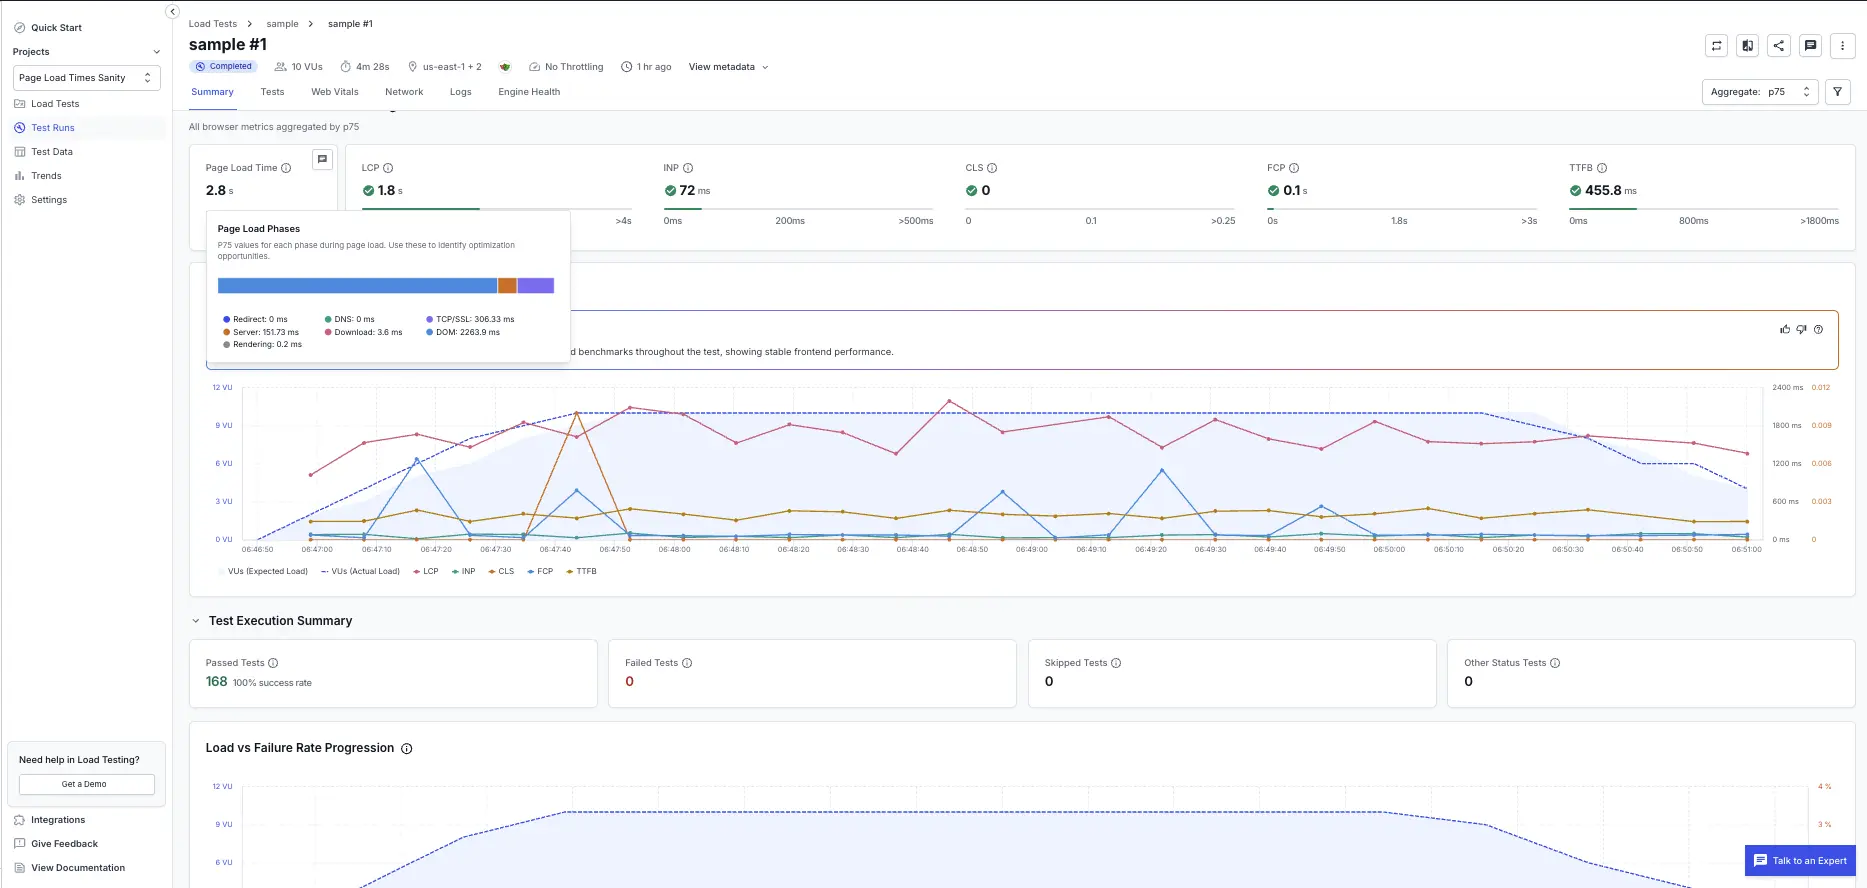
View aggregate page load time in the Summary tab
In the Summary tab, scroll to the Browser Metrics and Timeline section to view the aggregate page load time across all virtual users, along with the p75, minimum, and maximum values. The breakdown shows how much time each phase contributed, so you can spot the slowest part of the load at a glance.
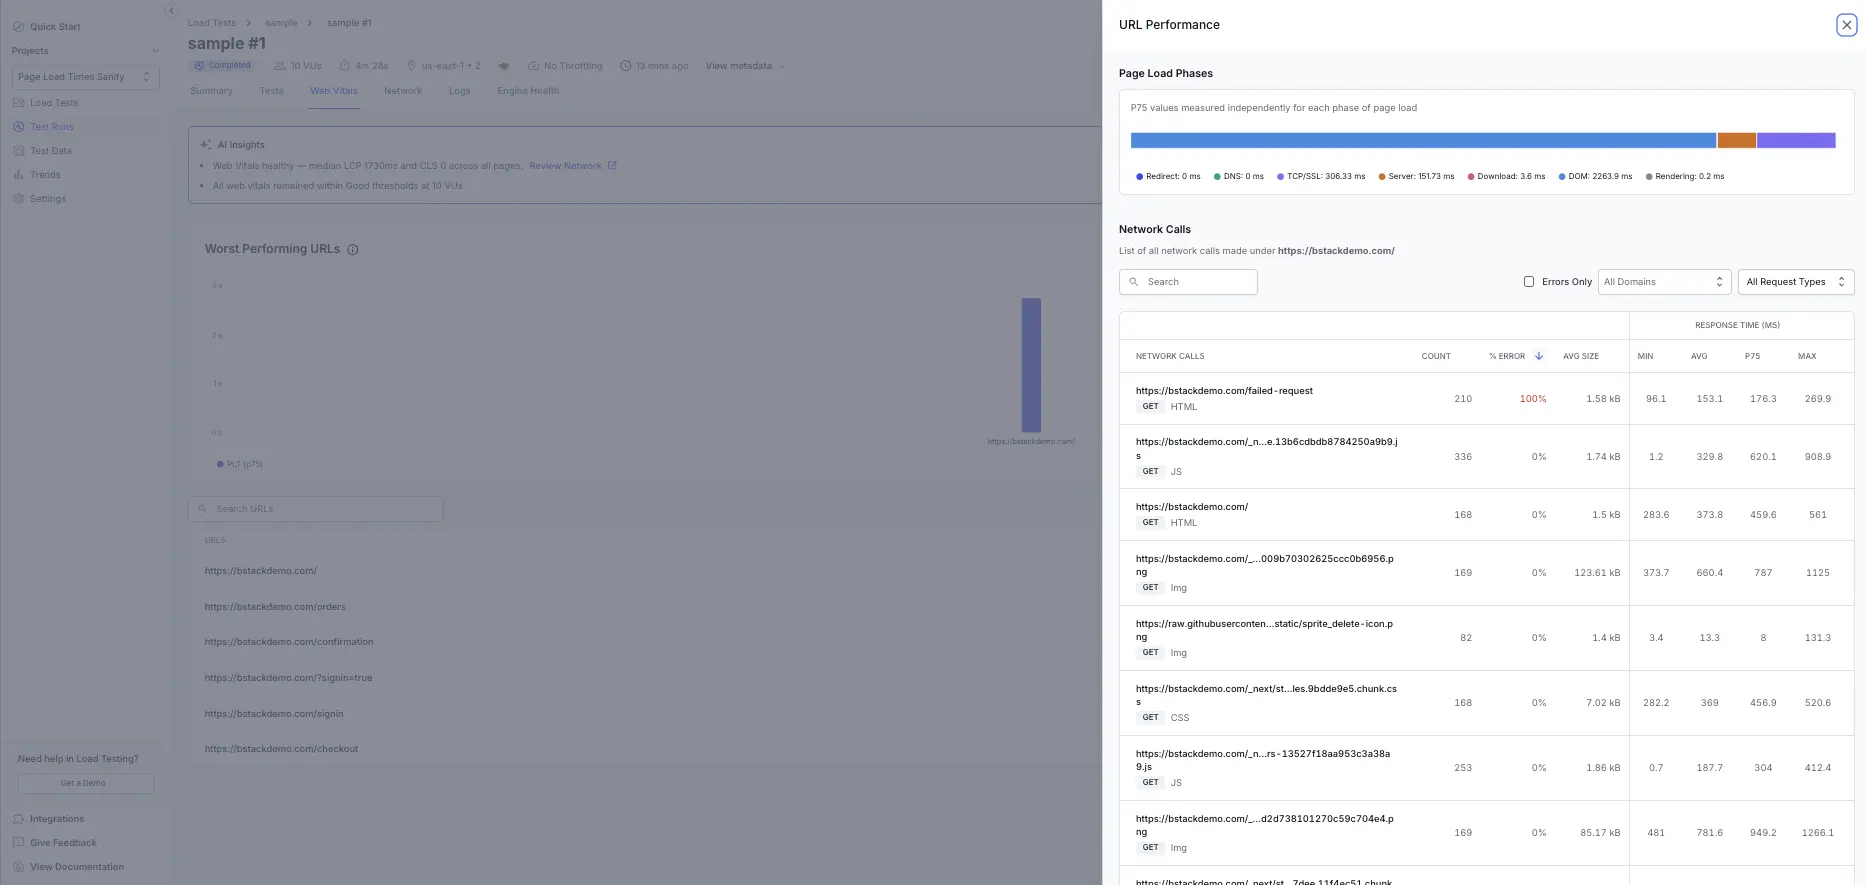
View page load time per URL in the Web Vitals tab
The Web Vitals tab lists every tested URL with its page load time and a breakdown of the same phases. Each URL shows the p75, minimum, and maximum values, so you can compare pages and prioritize the ones that hurt the user experience most.
For more about the Web Vitals tab, see Web Vitals tab.
Set a page load time threshold
You can set a threshold on page load time to fail a test when pages load too slowly under load. When you configure a threshold for a browser or hybrid test, select Page load time, choose a condition, and enter a value in milliseconds.
For the full threshold workflow, see Set thresholds.
We're sorry to hear that. Please share your feedback so we can do better
Contact our Support team for immediate help while we work on improving our docs.
We're continuously improving our docs. We'd love to know what you liked
We're sorry to hear that. Please share your feedback so we can do better
Contact our Support team for immediate help while we work on improving our docs.
We're continuously improving our docs. We'd love to know what you liked
Thank you for your valuable feedback!