Tests tab
Inspect every test case executed during a browser load test, including pass and fail status and per-test diagnostics.
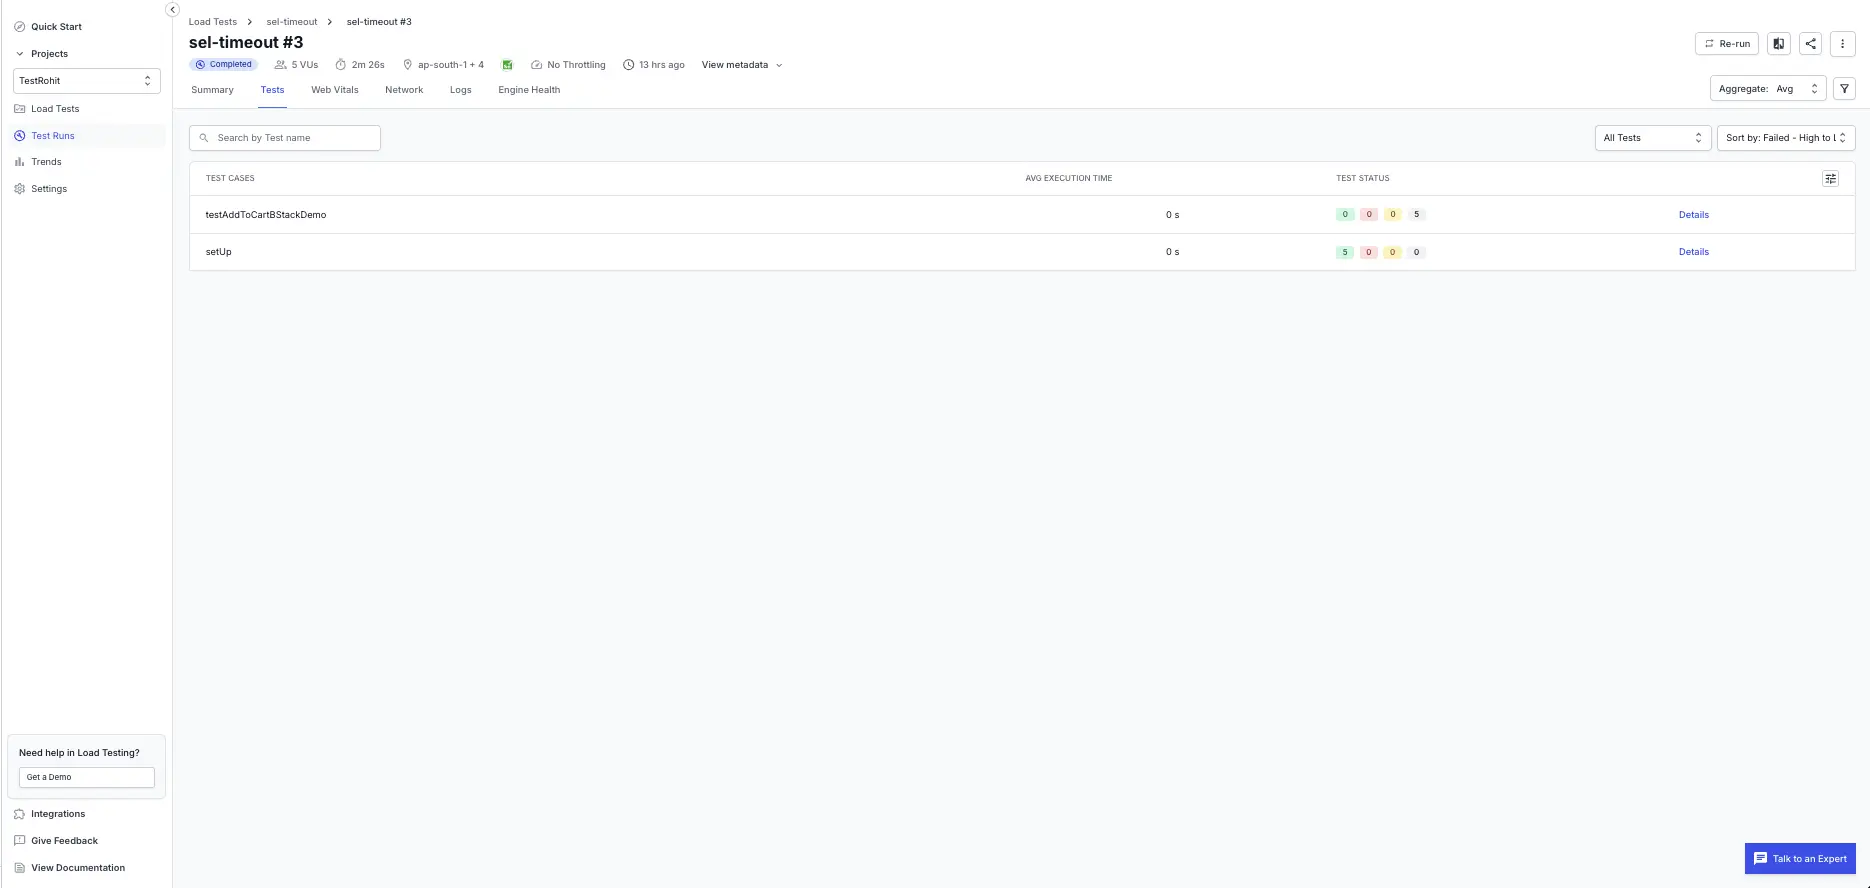
The Tests tab lists every test case executed during the run, surfaces its outcome, and links the result back to the underlying test reporting and analytics record. Use this tab to confirm functional correctness under load and to triage any tests that did not pass.
What you can do here
On this tab, you can:
- Review the four status counts on every test case row: Passed, Failed, Skipped, and Other status (across virtual users).
- Search by test name to locate a specific test case.
- Filter the list with the All Tests dropdown, or sort by status (for example, Failed - High to Low) to bring the worst-performing tests to the top.
- Open the Details link on any row to inspect a single test’s failure profile.
Test status reference
The following table describes the possible test statuses you may see on the Tests tab:
| Status | Meaning |
|---|---|
| Passed | The test case ran end-to-end without assertion failures or runtime errors. |
| Failed | The test case ran but one or more assertions or steps failed. |
| Skipped | The test case was not executed (for example, due to a precondition or a filter). |
| Other | The test case did not complete due to a non-functional issue (for example, an aborted run or an engine-side error). |
Drill into a single test
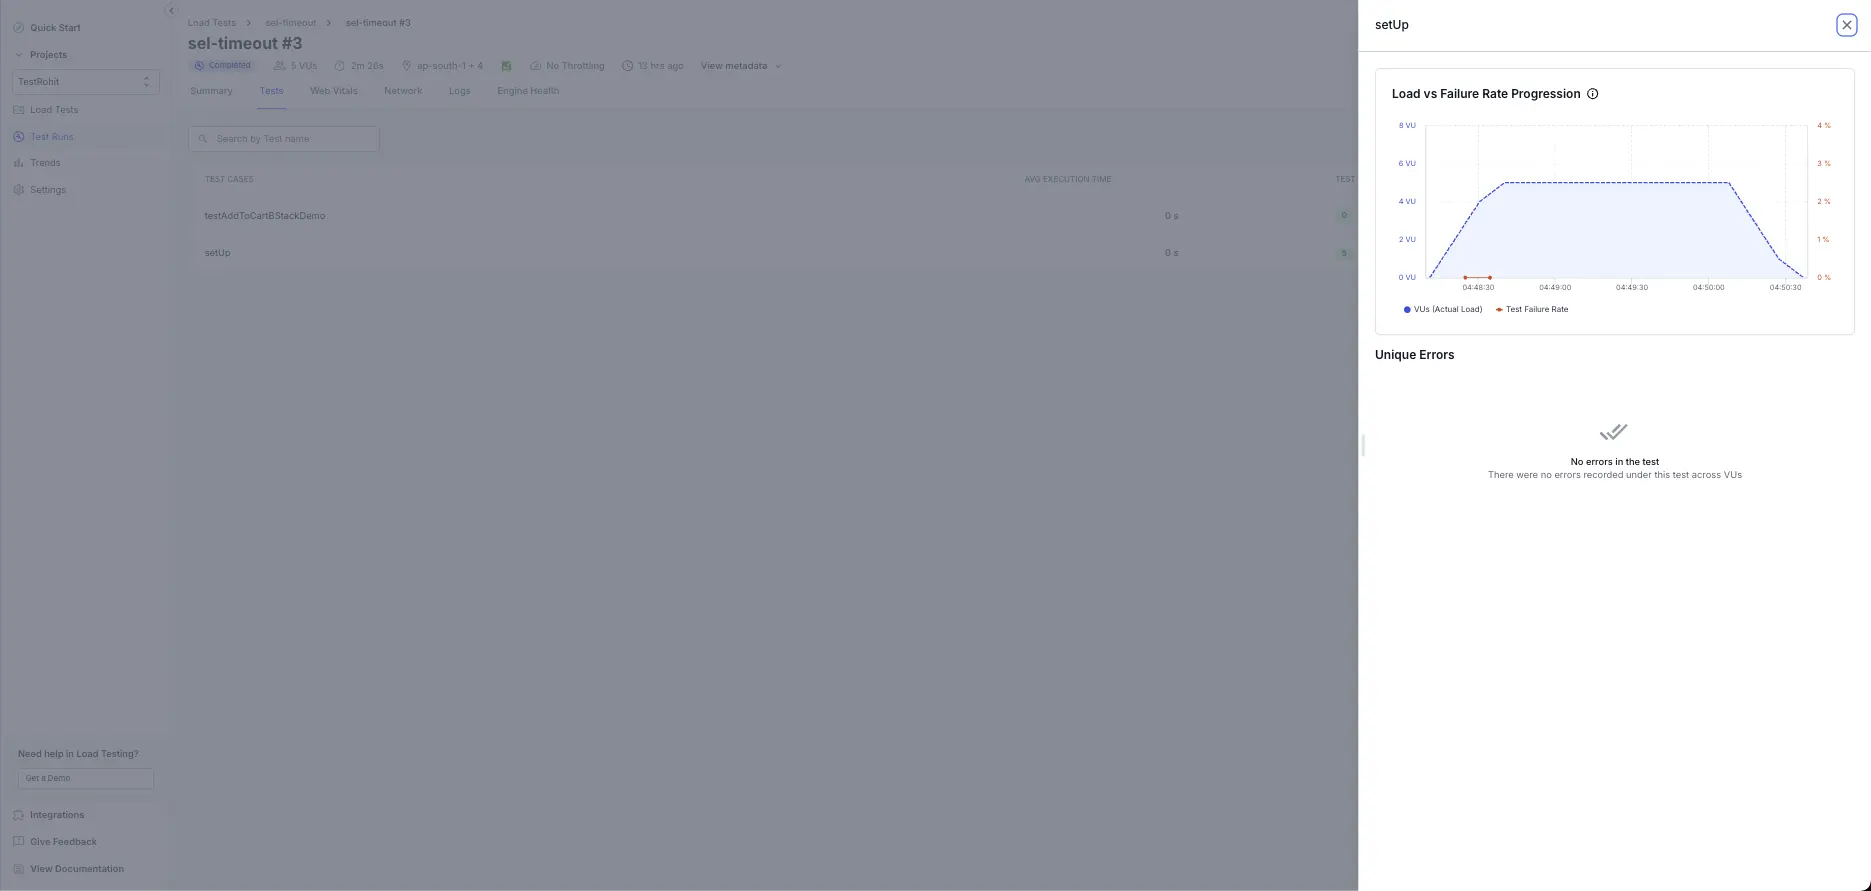
Select Details on any test case row to open the per-test panel. The panel shows:
- Load vs Failure Rate Progression for that single test case: virtual users (actual load) plotted alongside the test failure rate against time, so you can correlate the test’s failures with the run’s load profile.
- Unique Errors recorded for that test case across all virtual users.
Use this view to confirm whether a failing test failed under specific load levels and to read its errors without leaving the tab.
Review unique errors
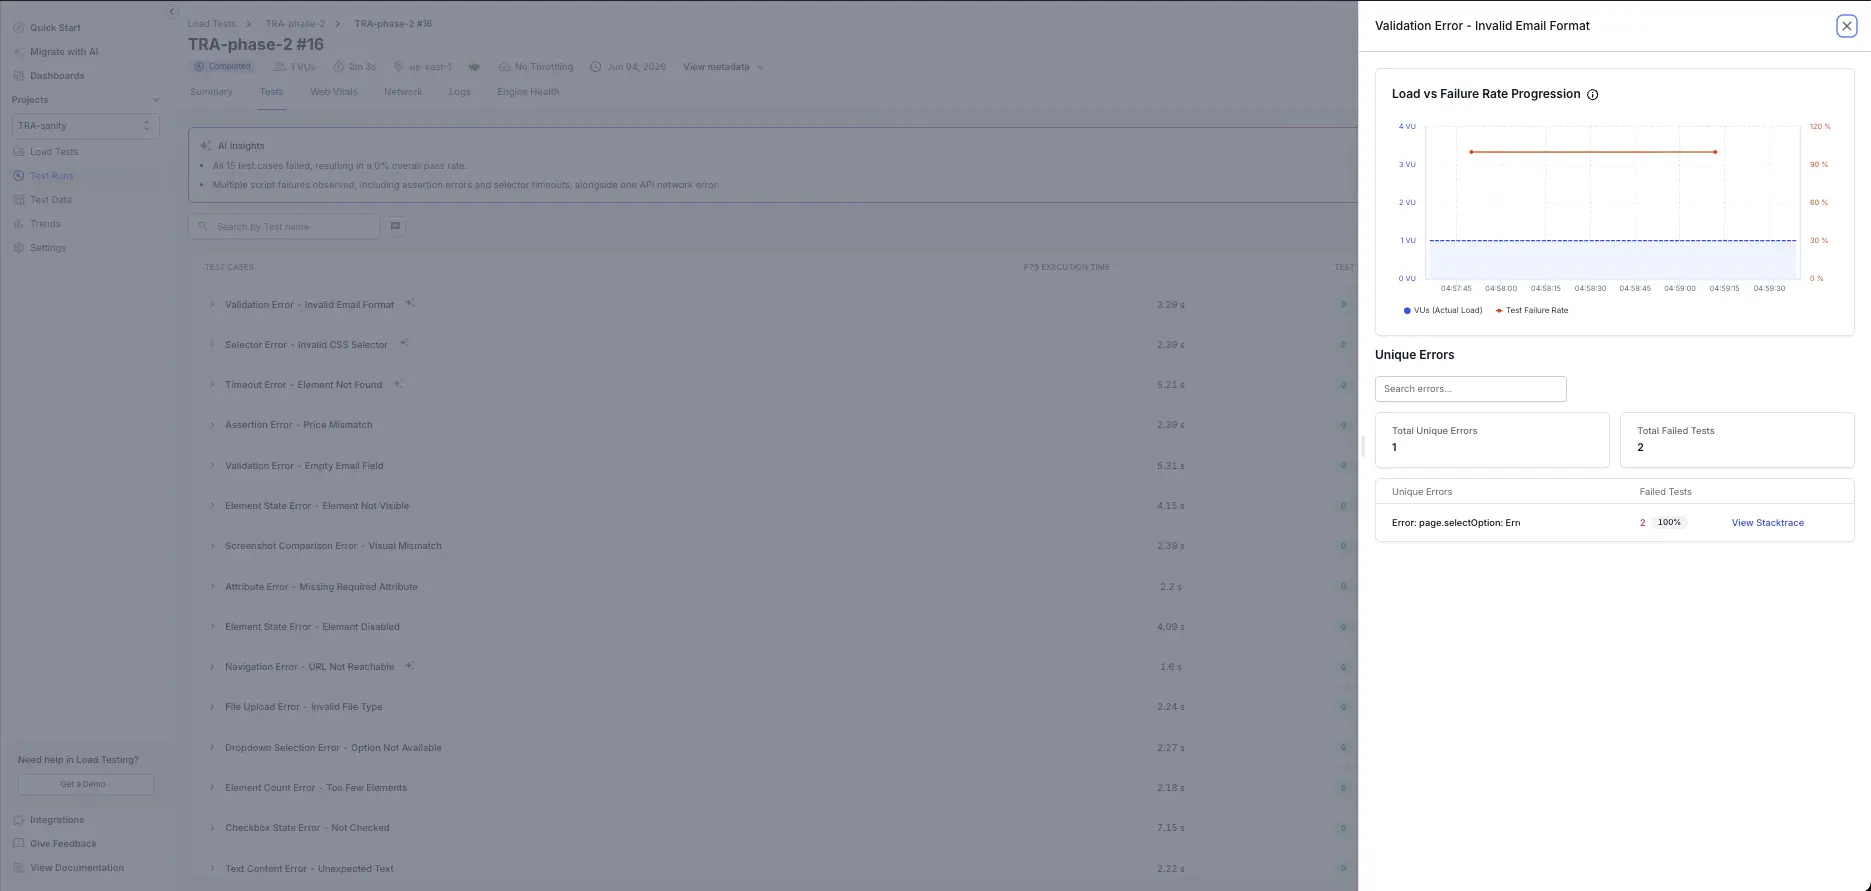
The Unique Errors section of the per-test panel groups every error recorded for a test case across all virtual users into a deduplicated list. This helps you spot the top causes of failure for that test case and decide what to fix first.
The section appears below the Load vs Failure Rate Progression chart when you open a test case’s Details panel. It shows:
- Total Unique Errors and Total Failed Tests for the test case.
- A table that lists each distinct error, the number of tests it failed, the percentage of failed tests it accounts for, and a View Stacktrace link.
When a test case has many distinct failures, use the search box to find a specific error.
When a test case records no errors, the section shows No errors in the test and notes that no errors were recorded under this test across virtual users. A clean result here means the test case passed for every virtual user that ran it.
Debug a unique error
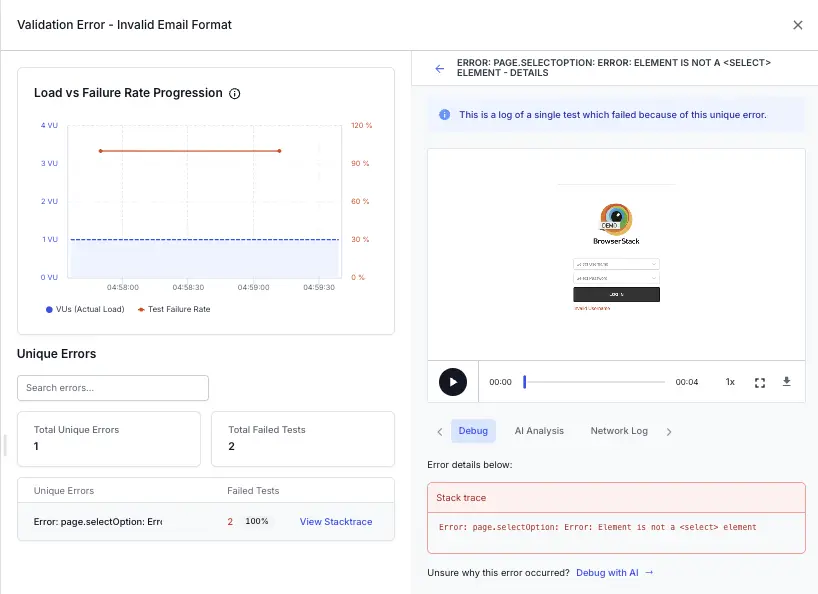
Select View Stacktrace on any error to open the logs for a single test that failed with that error. This view helps you move from what failed to why it failed without leaving the report. It shows:
- A session recording of the failed test.
- The complete Stack trace for the error.
- Debug, AI Analysis, and Network Log tabs for deeper investigation.
- A Debug with AI option that explains the likely cause.
Related tabs
- Logs: full execution logs per virtual user session.
- Network: network calls and response codes captured during the run.
- Web Vitals: per-URL frontend performance.
We're sorry to hear that. Please share your feedback so we can do better
Contact our Support team for immediate help while we work on improving our docs.
We're continuously improving our docs. We'd love to know what you liked
We're sorry to hear that. Please share your feedback so we can do better
Contact our Support team for immediate help while we work on improving our docs.
We're continuously improving our docs. We'd love to know what you liked
Thank you for your valuable feedback!