Summary tab
The Summary tab gives you a snapshot of how your app performed under hybrid load.
The Summary tab gives you a high-level overview of your application’s performance during load testing. Use this page to quickly assess key metrics, identify trends, and spot potential issues that may affect user experience under load.
Report-level controls (Re-run, Compare run, Set as Baseline, Share, Download PDF, Aggregate, and Filters) live in the report header and apply to the entire run. See Test run report controls.
AI Insights
The AI Insights card (Beta) summarizes the most important findings from the run in plain language. It surfaces:
- Overall test case pass rate.
- Whether all Web Vitals are within “Good” thresholds.
- Notable network error rates with the failing endpoint(s) called out.
- Notable response-time outliers that indicate long-tail latency.
Select View detailed insights to expand the full AI-generated explanation. AI Insights is advisory. Verify findings against the underlying metrics before acting on them. For more about this feature, see AI Insights.
Network metrics
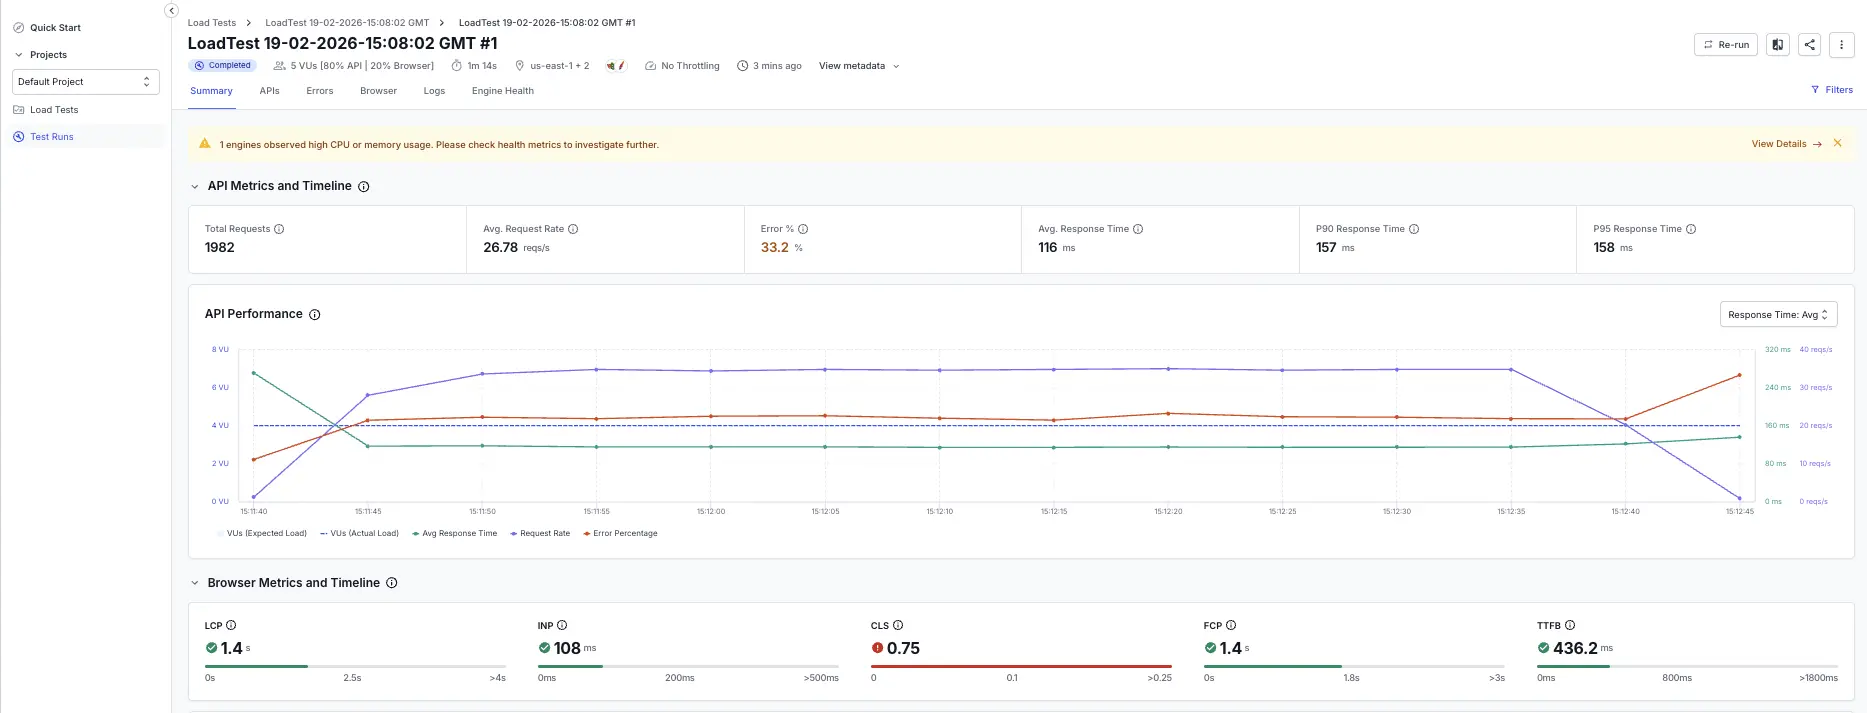
The Network metrics section provides detailed insights into your application’s network performance during load testing. These metrics help you identify backend issues, such as latency, bottlenecks, and error rates, that can impact user experience.
| Metric | Description |
|---|---|
| Max VUs | Highest number of concurrent users during the test. |
| Total requests | All network calls made. |
| Avg. request rate | Requests per second by all users. |
| Error % | Rate of non-200 responses. |
| Avg. response time | Mean response time for all requests. |
| P90 Response Time | Time taken for 90% of requests to be completed. |
Web Vitals
The Web Vitals section displays the percentile values for key frontend performance metrics, aggregated across all users and pages during the test, using the percentile selected in the report header.
| Metric | Description | Debug tip |
|---|---|---|
| LCP (Largest Contentful Paint) | Time to render the largest visible element. | Check for slow images, fonts, or containers. |
| INP (Interaction to Next Paint) | Delay between user action and visual response. | Debug JavaScript blocking or slow APIs. |
| CLS (Cumulative Layout Shift) | Measures layout shifts during load. | Inspect DOM changes or font swaps. |
| FCP (First Contentful Paint) | Time to render the first visible element. | Look for render-blocking CSS or server latency. |
| TTFB (Time to First Byte) | Time until first byte from the server. | Check for backend slowness or network issues. |
Click a red metric or go to the Browser tab for detailed page-level insights.
Graphs and visualizations
The following charts provide a visual summary of your application’s performance during load testing. Use these graphs to quickly spot trends, anomalies, and areas that may need further investigation.
Browser performance summary graph
Helps identify frontend trends affecting user experience. To drill into specific time intervals, click and drag your mouse across the desired range on the chart. All metrics will be filtered based on the zoomed-in time range.
- X-axis: Test duration.
- Y-axis (left): Virtual users.
- Y-axis (right I): LCP, INP, FCP, TTFB (in ms).
- Y-axis (right II): CLS.
Network performance summary graph
Helps spot backend issues like latency or bottlenecks. To drill into specific time intervals, click and drag your mouse across the desired range on the chart. All metrics will be filtered based on the zoomed-in time range.
- X-axis: Test timeline.
- Y-axis (left): Number of virtual users.
- Y-axis (right): Response time and request rate.
We're sorry to hear that. Please share your feedback so we can do better
Contact our Support team for immediate help while we work on improving our docs.
We're continuously improving our docs. We'd love to know what you liked
We're sorry to hear that. Please share your feedback so we can do better
Contact our Support team for immediate help while we work on improving our docs.
We're continuously improving our docs. We'd love to know what you liked
Thank you for your valuable feedback!