Integrate Zephyr Scale with Quality Engineering Insights
Enhance your test execution metrics by connecting Zephyr Scale with BrowserStack’s Quality Engineering Insights.
Integrate your Zephyr Scale setup with BrowserStack Quality Engineering Insights and track key metrics on projects and test cases.
Prerequisites
You must have the following:
- Zephyr Scale account
- Jira account
- Jira API access token
- Zephyr Scale API access token
- BrowserStack account
Integration steps
- Go to Quality Engineering Insights.
- Go to Integrations > Test Management Tools.
- Zephyr Scale connection requires a two-step authentication: Jira authentication and Zephyr access. Select Zephyr Scale and click + Connect.
The Integrate seamlessly with Jira window appears.
- You can connect Jira with OAuth or using PAT.
-
a. Connect using OAuth
- Select your account. You will be redirected to the Atlassian access page.
- Click Accept to allow BrowserStack JIRA Integration access to your Atlassian account. The Connect Zephyr Scale window opens.
-
b. Connect using PAT (Personal Access Token)
- Enter your Atlassian host name and email ID.
- To get the Zephyr Scale API access token, click the Get your API token link. It redirects you to the Jira website.
- In Jira, under API Tokens, click Create API token.

- Enter a label for your token and click Create.
- Copy the generated API token right away. Note, it will not be visible again.
- Return to Quality Engineering Insights, enter the hostname, email, and the copied token.
- Click Continue to connect to Zephyr Scale.
-
a. Connect using OAuth
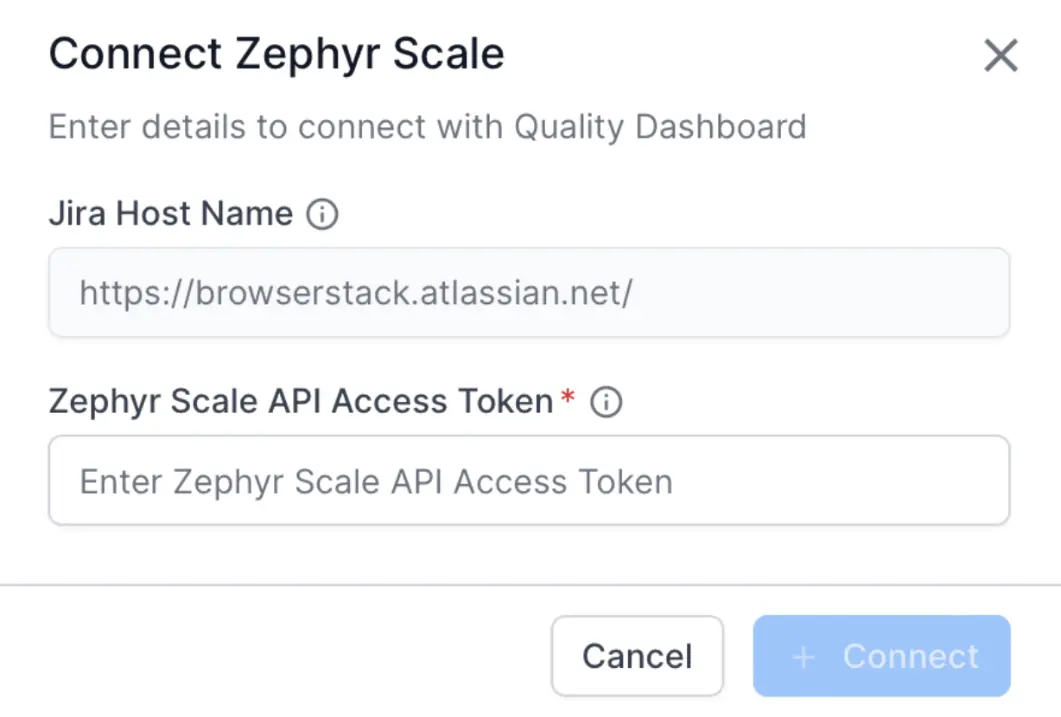
- In the Connect Zephyr Scale window, enter the Jira Host Name (e.g.,
https://yourcompany.atlassian.net) and the Zephyr Scale API access token.
- To obtain the Zephyr Scale API access token, visit the Atlassian host URL at
https://yourcompany.atlassian.net. Navigate to Account Profile > Zephyr Scale API Access Tokens in Jira. - Under API Access Tokens, click Create access token and copy the new token.
- Return to Quality Engineering Insights, paste the token, and click + Connect.
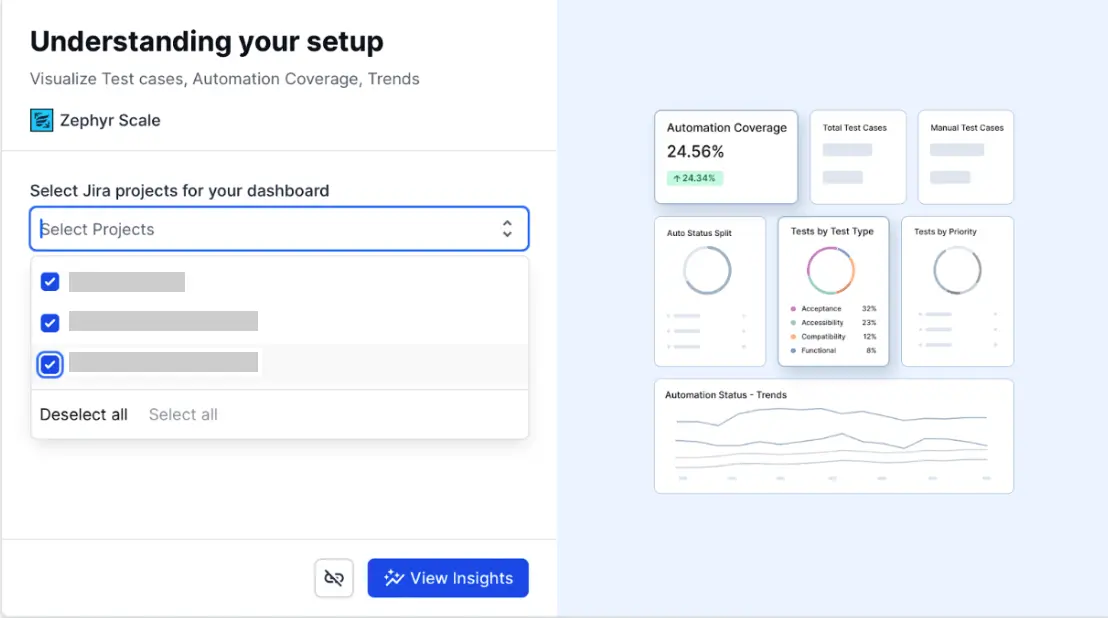
- Once connected, you will be redirected to the setup page.
- Select the Jira project, click View Insights, and view the dashboard.

Setting up Coverage Metrics Dashboard
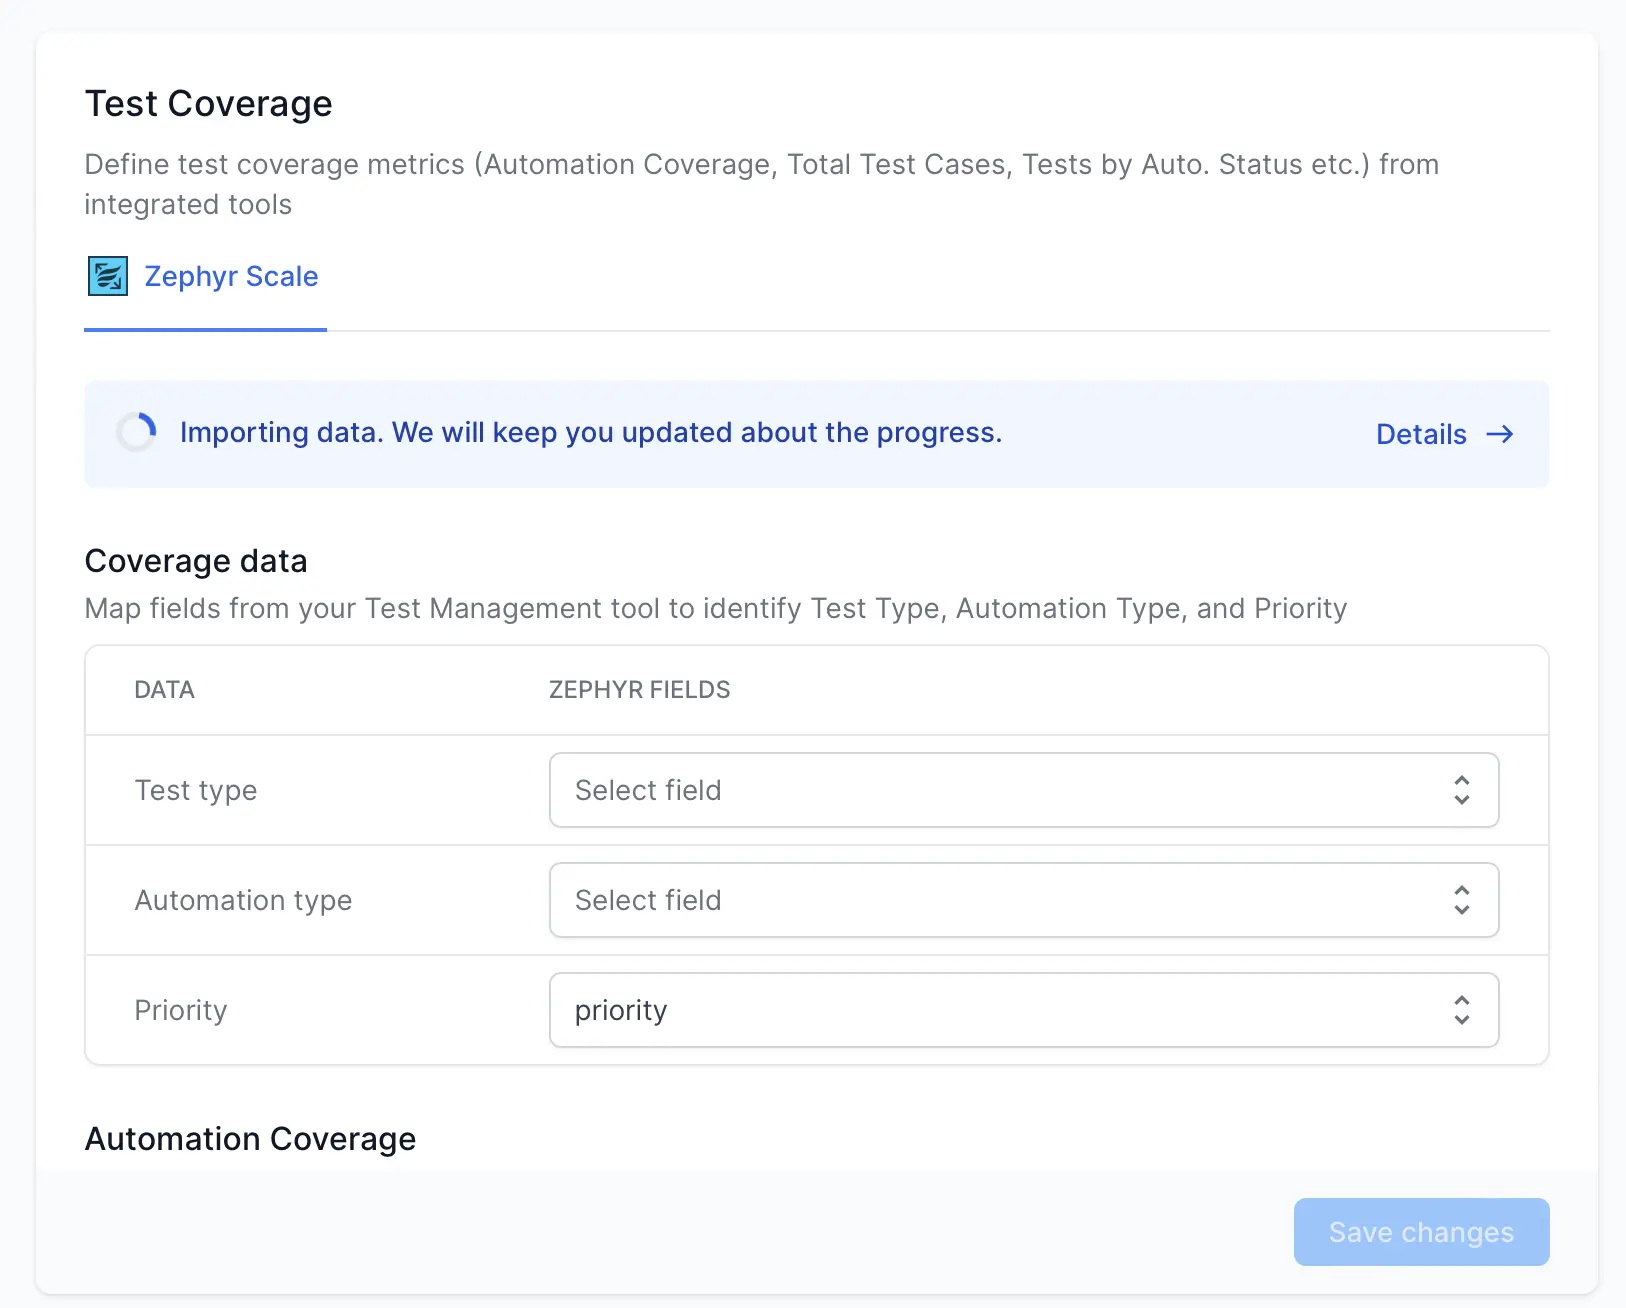
The Coverage Metrics Dashboard provides insights into test coverage metrics like automation coverage, historical trends and how test cases are distributed based on priority and testing type.
Use the Test Coverage tab in Settings to configure different distribution fields like Priority as per your Zephyr Scale setup.

We're sorry to hear that. Please share your feedback so we can do better
Contact our Support team for immediate help while we work on improving our docs.
We're continuously improving our docs. We'd love to know what you liked
We're sorry to hear that. Please share your feedback so we can do better
Contact our Support team for immediate help while we work on improving our docs.
We're continuously improving our docs. We'd love to know what you liked
Thank you for your valuable feedback!