Integrate SonarQube
Integrate SonarQube with Quality Engineering Insights (QEI) to import and visualize key code health metrics. This allows you to track line coverage, branch coverage, open bugs, code smells, and vulnerabilities directly within your QEI dashboards.
This document explains how to connect your SonarQube instance and configure your projects.
Prerequisites
Before you begin, you must have a Personal Access Token (PAT) from your SonarQube instance.
The Personal Access Token must have Browse permission. This permission is required for QEI to connect and access your project data.
Connect your SonarQube account
You must be an admin in QEI to manage integrations. Follow these steps to connect with your SonarQube account:
-
From the QEI left navigation bar, go to Integrations.
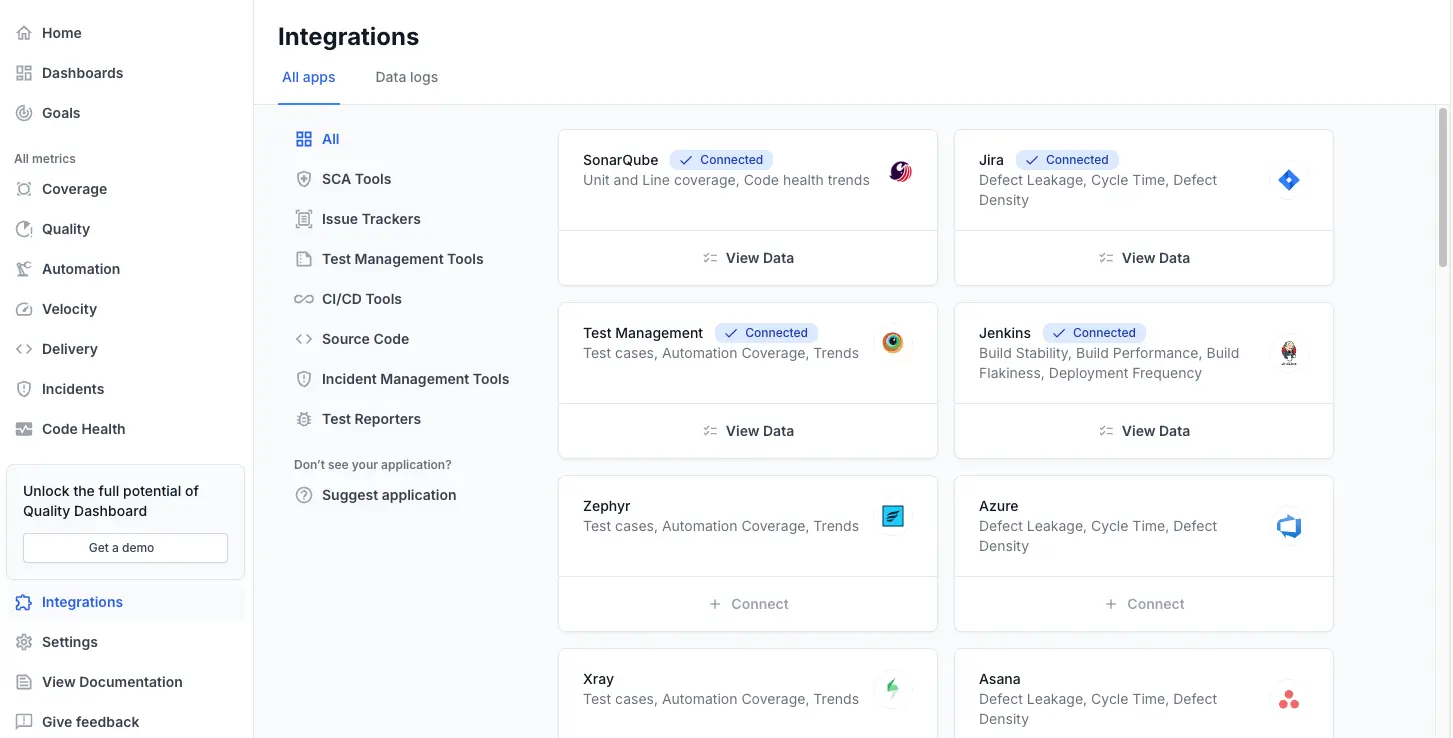
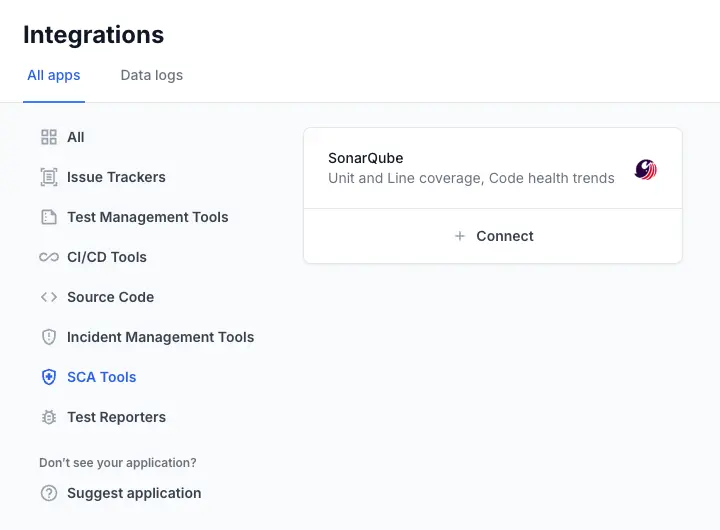
- Find and click the SCA Tools tab.
-
On the SonarQube tile, click Connect.
-
In the Connect SonarQube dialog, paste your Personal Access Token.
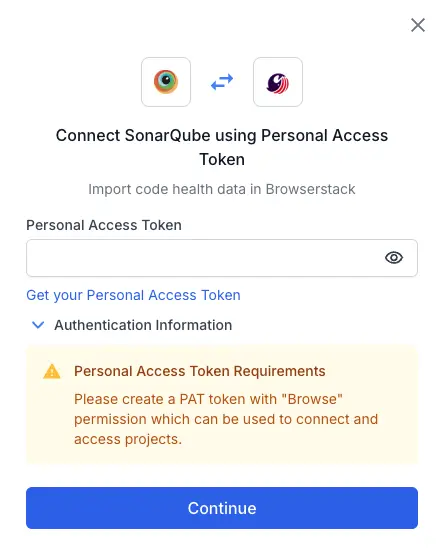
- Click Continue.
QEI will validate your token and connect to your SonarQube instance.
Configure repositories
After successfully connecting, you must select which projects to import.
-
On the Understanding your setup screen, use the Select organization dropdown to choose the SonarQube organization you want to sync.
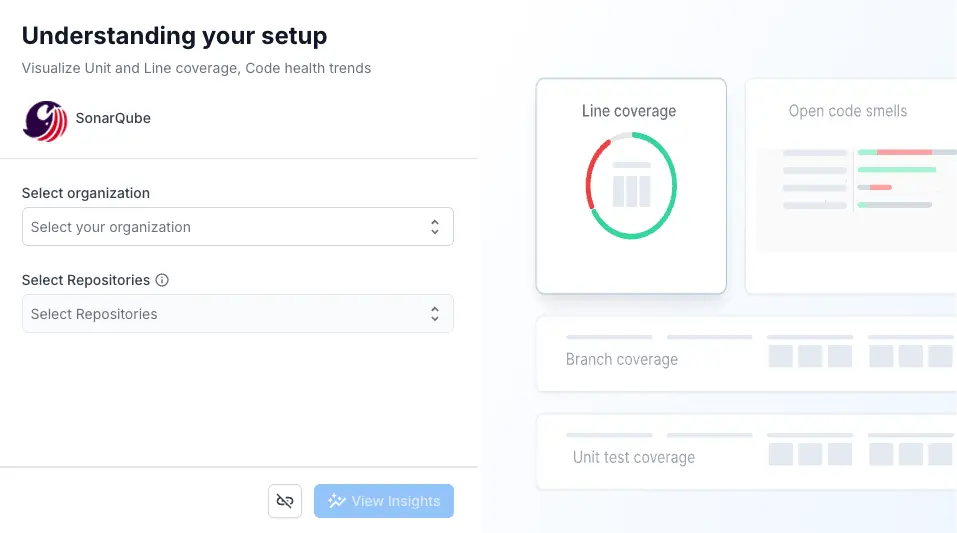
- Once an organization is selected, the Select Repositories list will load.
-
Check the boxes for all repositories (projects) you want to import data from. You can select multiple repositories.
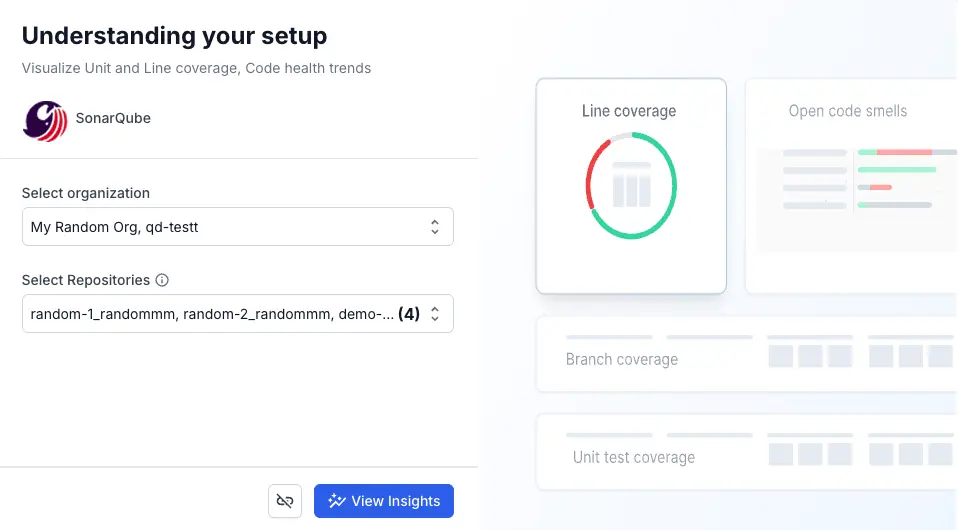
- Click View insights.
QEI will begin importing your SonarQube data. This may take a few minutes. Once complete, you will be redirected to your dashboard, and data will be visible on the Code Health dashboard.
View SonarQube data
Once your data is imported, you can see it in Code Health Dashboard:
- A dedicated dashboard that displays all your key SonarQube metrics, widgets, and trends.
Disconnect SonarQube
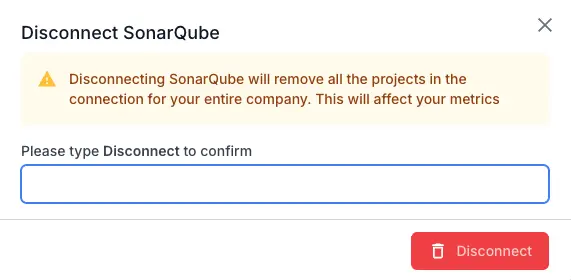
Disconnecting SonarQube will remove the integration and stop all data imports. All existing Code Health widgets will stop displaying data.
-
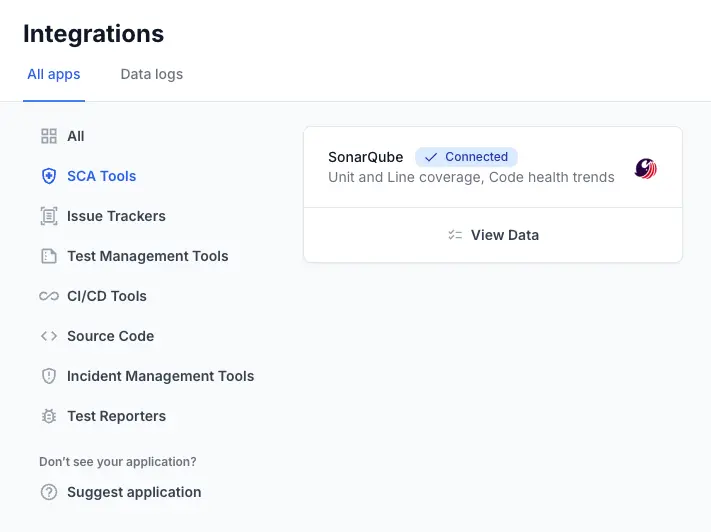
Navigate to Integrations from left sidebar.
- Select SCA Tools.
-
Click View Details on the connected SonarQube integration tile.
-
On the SonarQube data page, click more options (⋮).
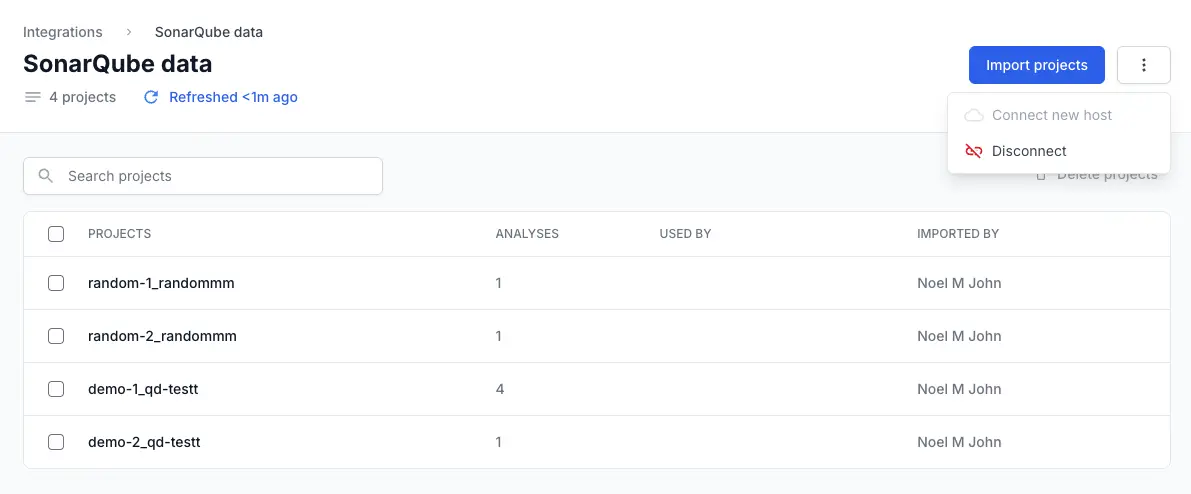
- Click Disconnect button (trash icon).
-
A confirmation dialog will appear. Type Disconnect to confirm.
We're sorry to hear that. Please share your feedback so we can do better
Contact our Support team for immediate help while we work on improving our docs.
We're continuously improving our docs. We'd love to know what you liked
We're sorry to hear that. Please share your feedback so we can do better
Contact our Support team for immediate help while we work on improving our docs.
We're continuously improving our docs. We'd love to know what you liked
Thank you for your valuable feedback!