
 Join our Discord
Visual analysis
Run Percy visual tests on your web pages and app screens, then compare each snapshot against its baseline and approve it from your IDE.
A visual test captures a snapshot of your page or screen and compares it against the last approved version of that snapshot. Percy marks the snapshot as changed when the two differ. You decide whether the change is intended.
Test Companion runs that loop for you. It captures the snapshots, sends them to BrowserStack Percy, waits for the build to finish, and opens the comparison in the Visual Analysis panel. You approve the build without leaving your IDE.
Test Companion never approves a visual build for you. It captures the snapshots and opens the comparison. You decide what becomes the baseline.
Prerequisites
Before you start, confirm the following:
- Test Companion is installed in a supported IDE and you are signed in to your BrowserStack account.
- Your BrowserStack account has access to Percy.
- For a web app, you have a public URL, a running local server, or a web project in your workspace.
- For a mobile app, you have an Android
.apkor an iOS.ipabuild.
How visual analysis works
A visual analysis run moves through these stages:
- You ask for a visual test, or you fill the guided form in the Visual Analysis panel.
- Test Companion selects a capture method for your project, then captures the snapshots.
- Percy renders each snapshot and compares it against the project baseline.
- The Visual Analysis panel opens on the finished build. You approve the build or fix the code.
Percy needs time to render and compare a build. The panel shows that no review is ready, then refreshes automatically after the results arrive.
Connect Visual Analysis
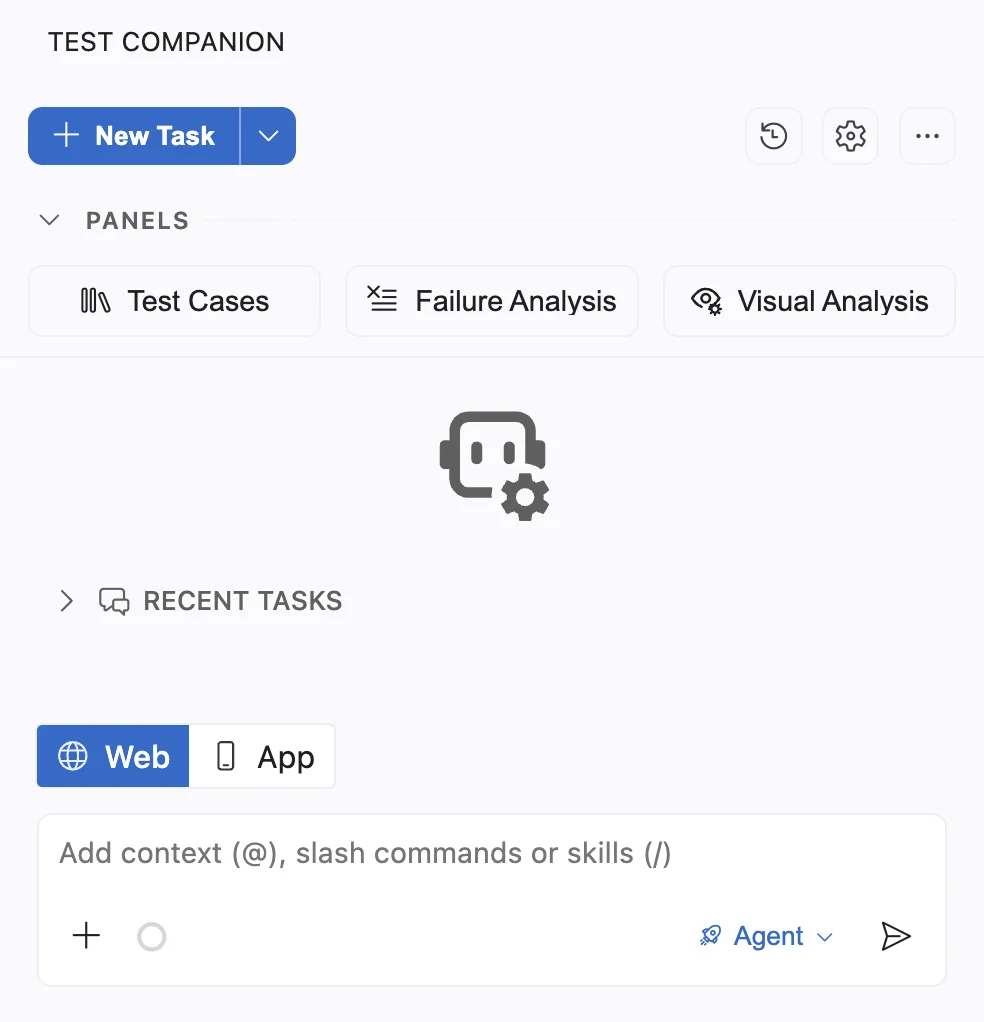
Open the Visual Analysis panel from the PANELS row at the top of the Test Companion sidebar, next to Test Cases and Failure Analysis.
Before you connect a project, the panel opens on Connect Visual Analysis and shows two paths. Pick the one that matches your project.
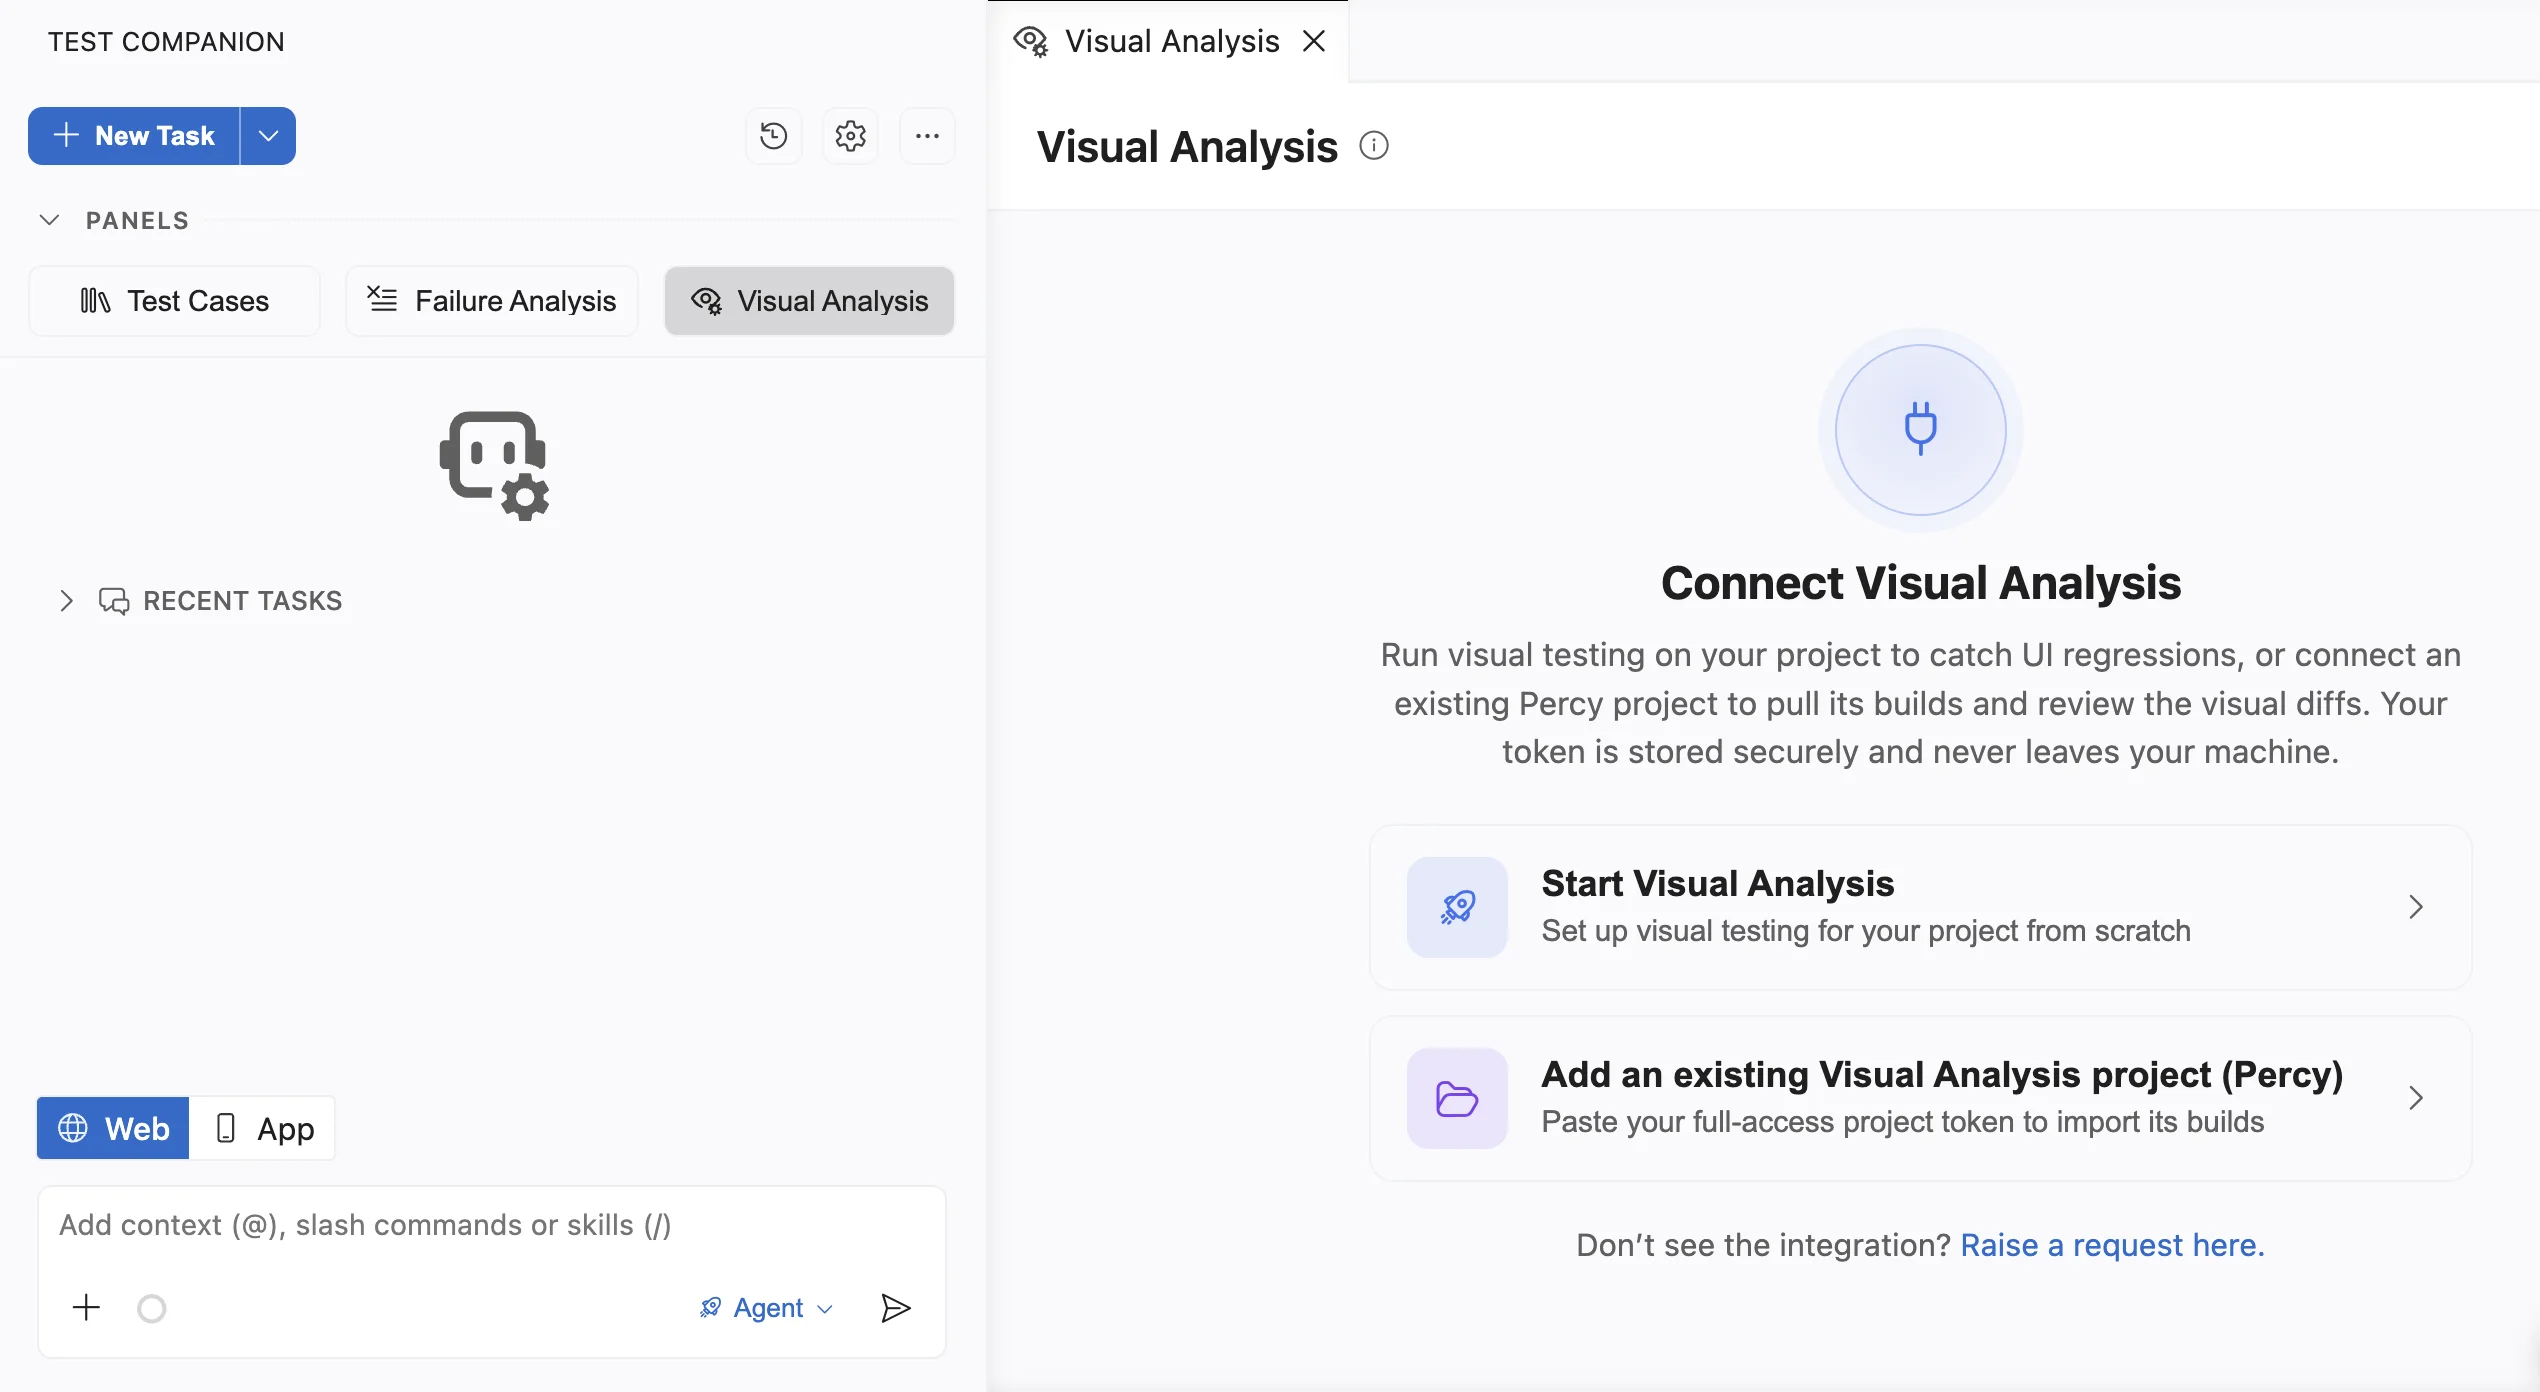
Your Percy token is stored on your machine. Test Companion does not send your token anywhere else.
Set up visual testing from scratch
Choose this path when your project has no visual testing yet. Test Companion writes the prompt for you, so you do not need to know how to phrase it.
- Click Start Visual Analysis.
- In Paste your Product URL or test folder, enter the URL or the folder to capture.
- In Type or paste additional details, name the screens to cover, or leave the field empty.
-
Click Add to prompt.
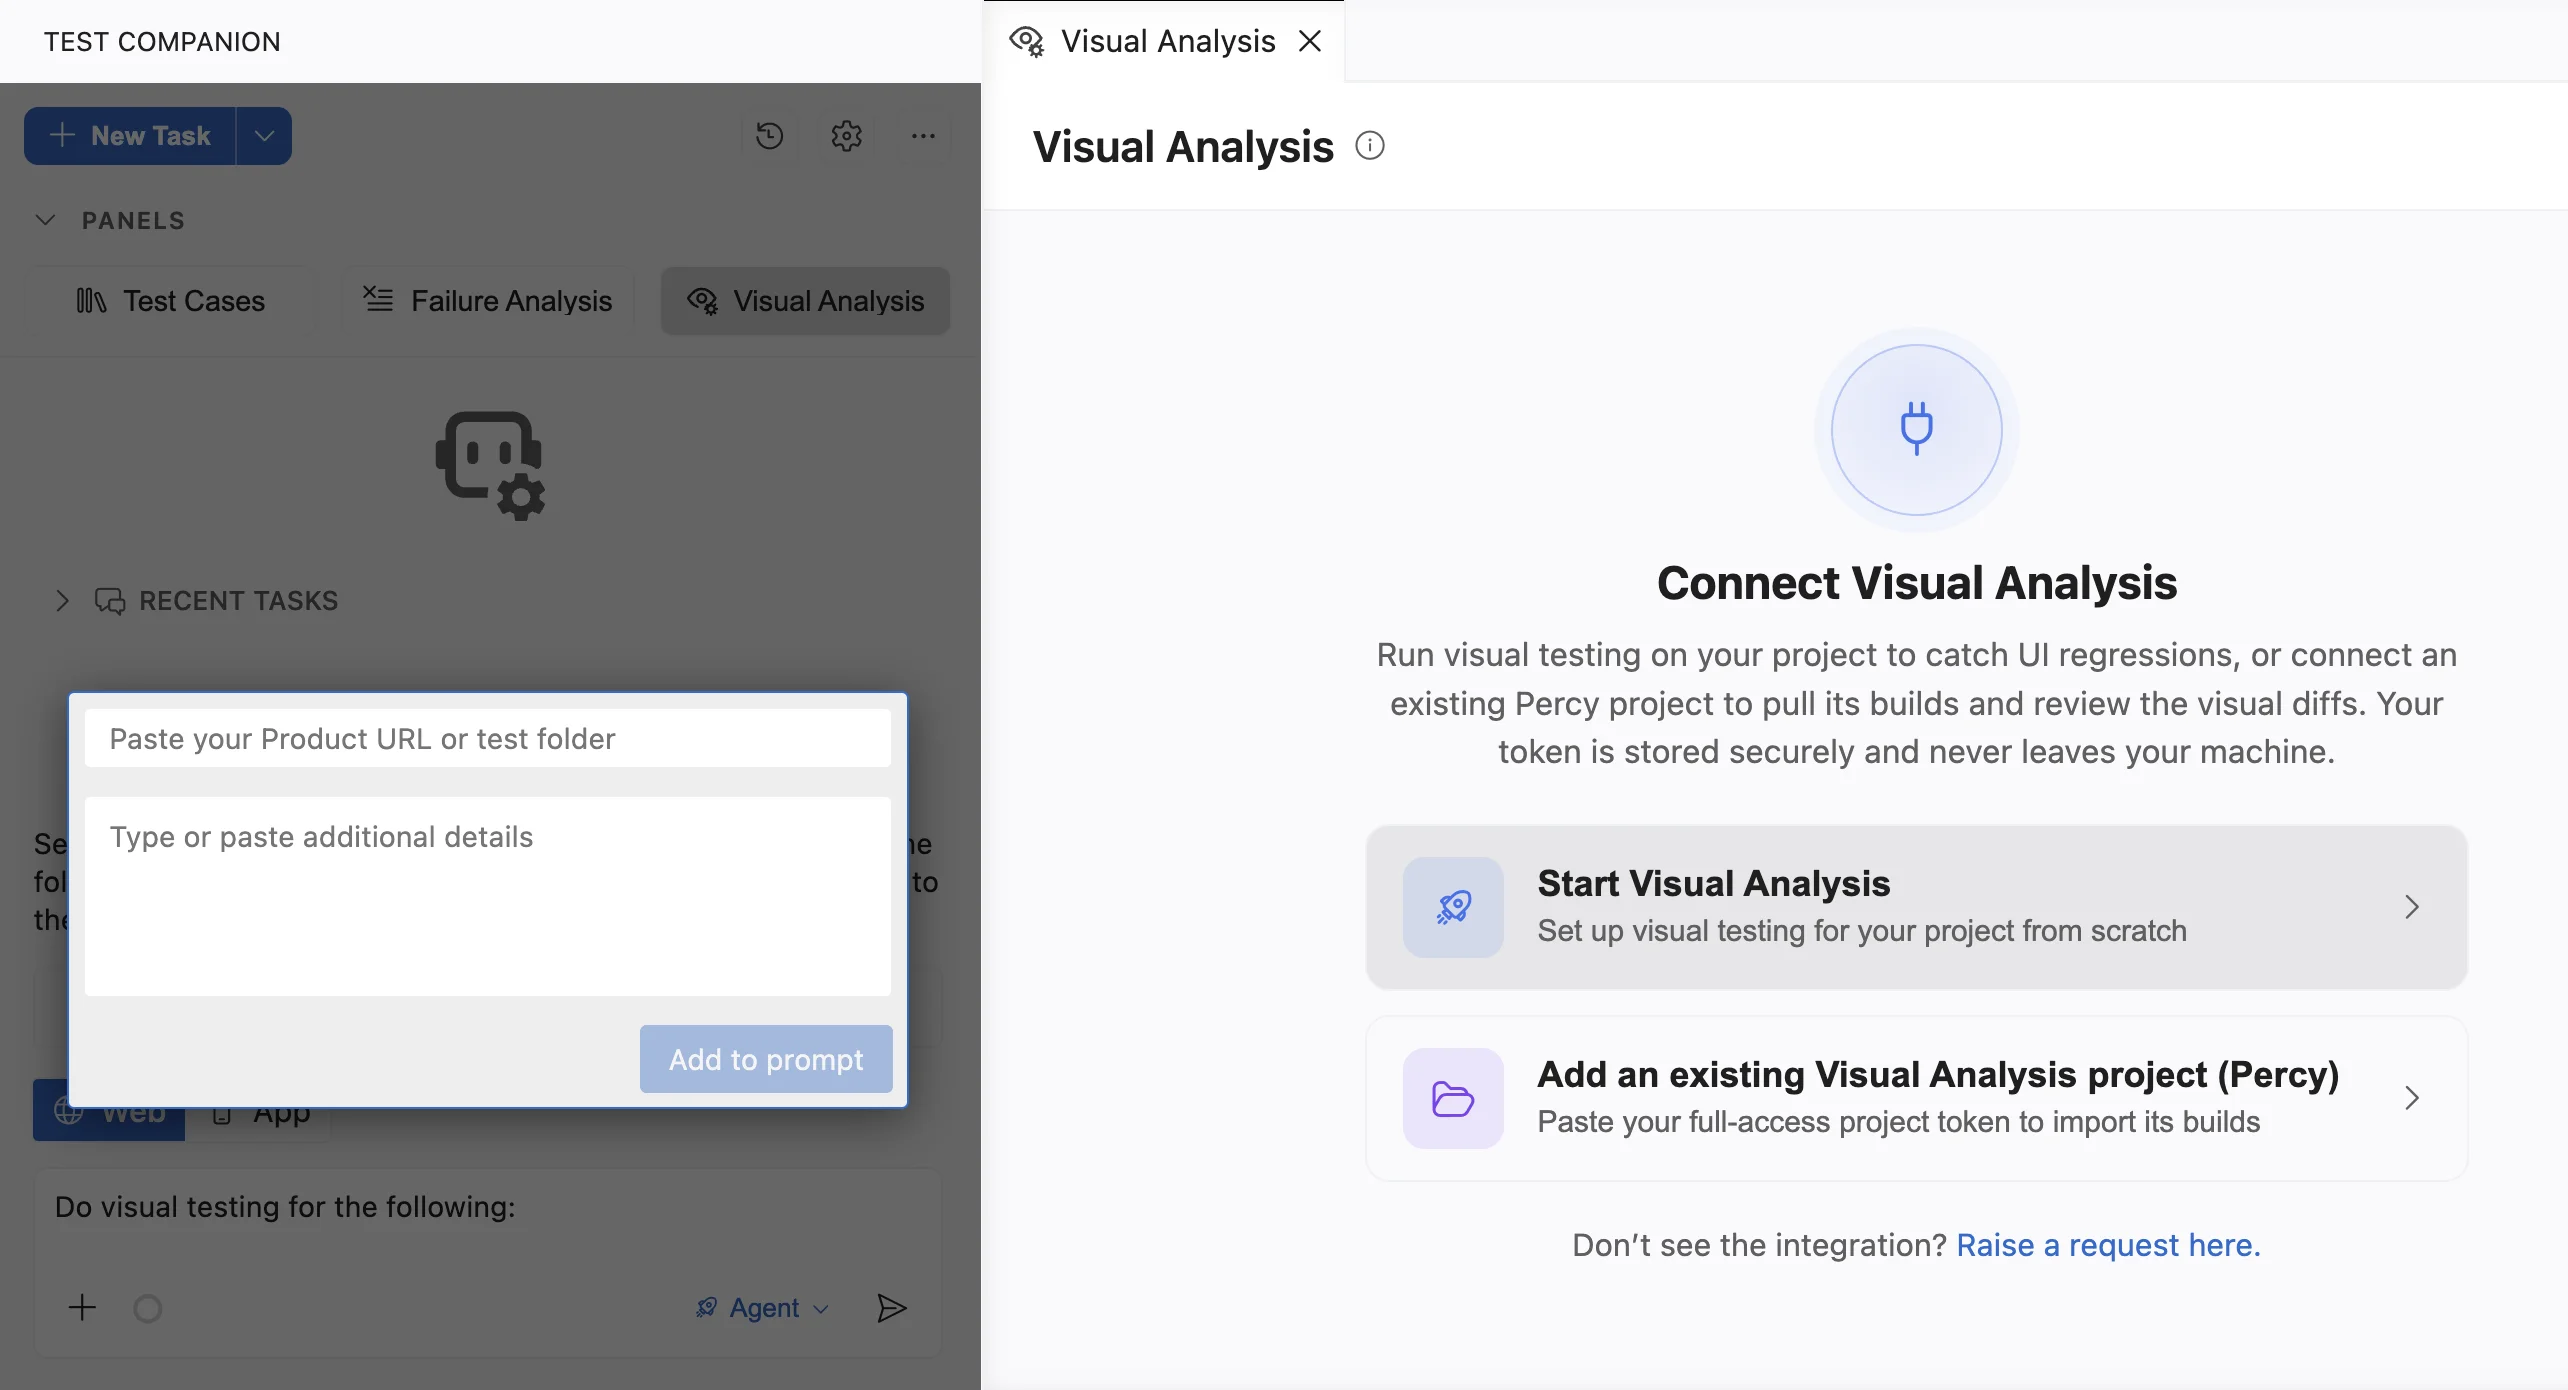
- Press Enter to send the prompt that Test Companion built.
Add an existing Percy project
Choose this path when you already run Percy, for example, in CI, and you want to review its builds in your IDE.
- Click Add an existing Visual Analysis project (Percy).
- Paste your Percy full-access project token, then press Enter.
Test Companion imports that project and lists its builds in the panel. You review and approve the builds the same way you review a build you started yourself.
The Visual Analysis panel
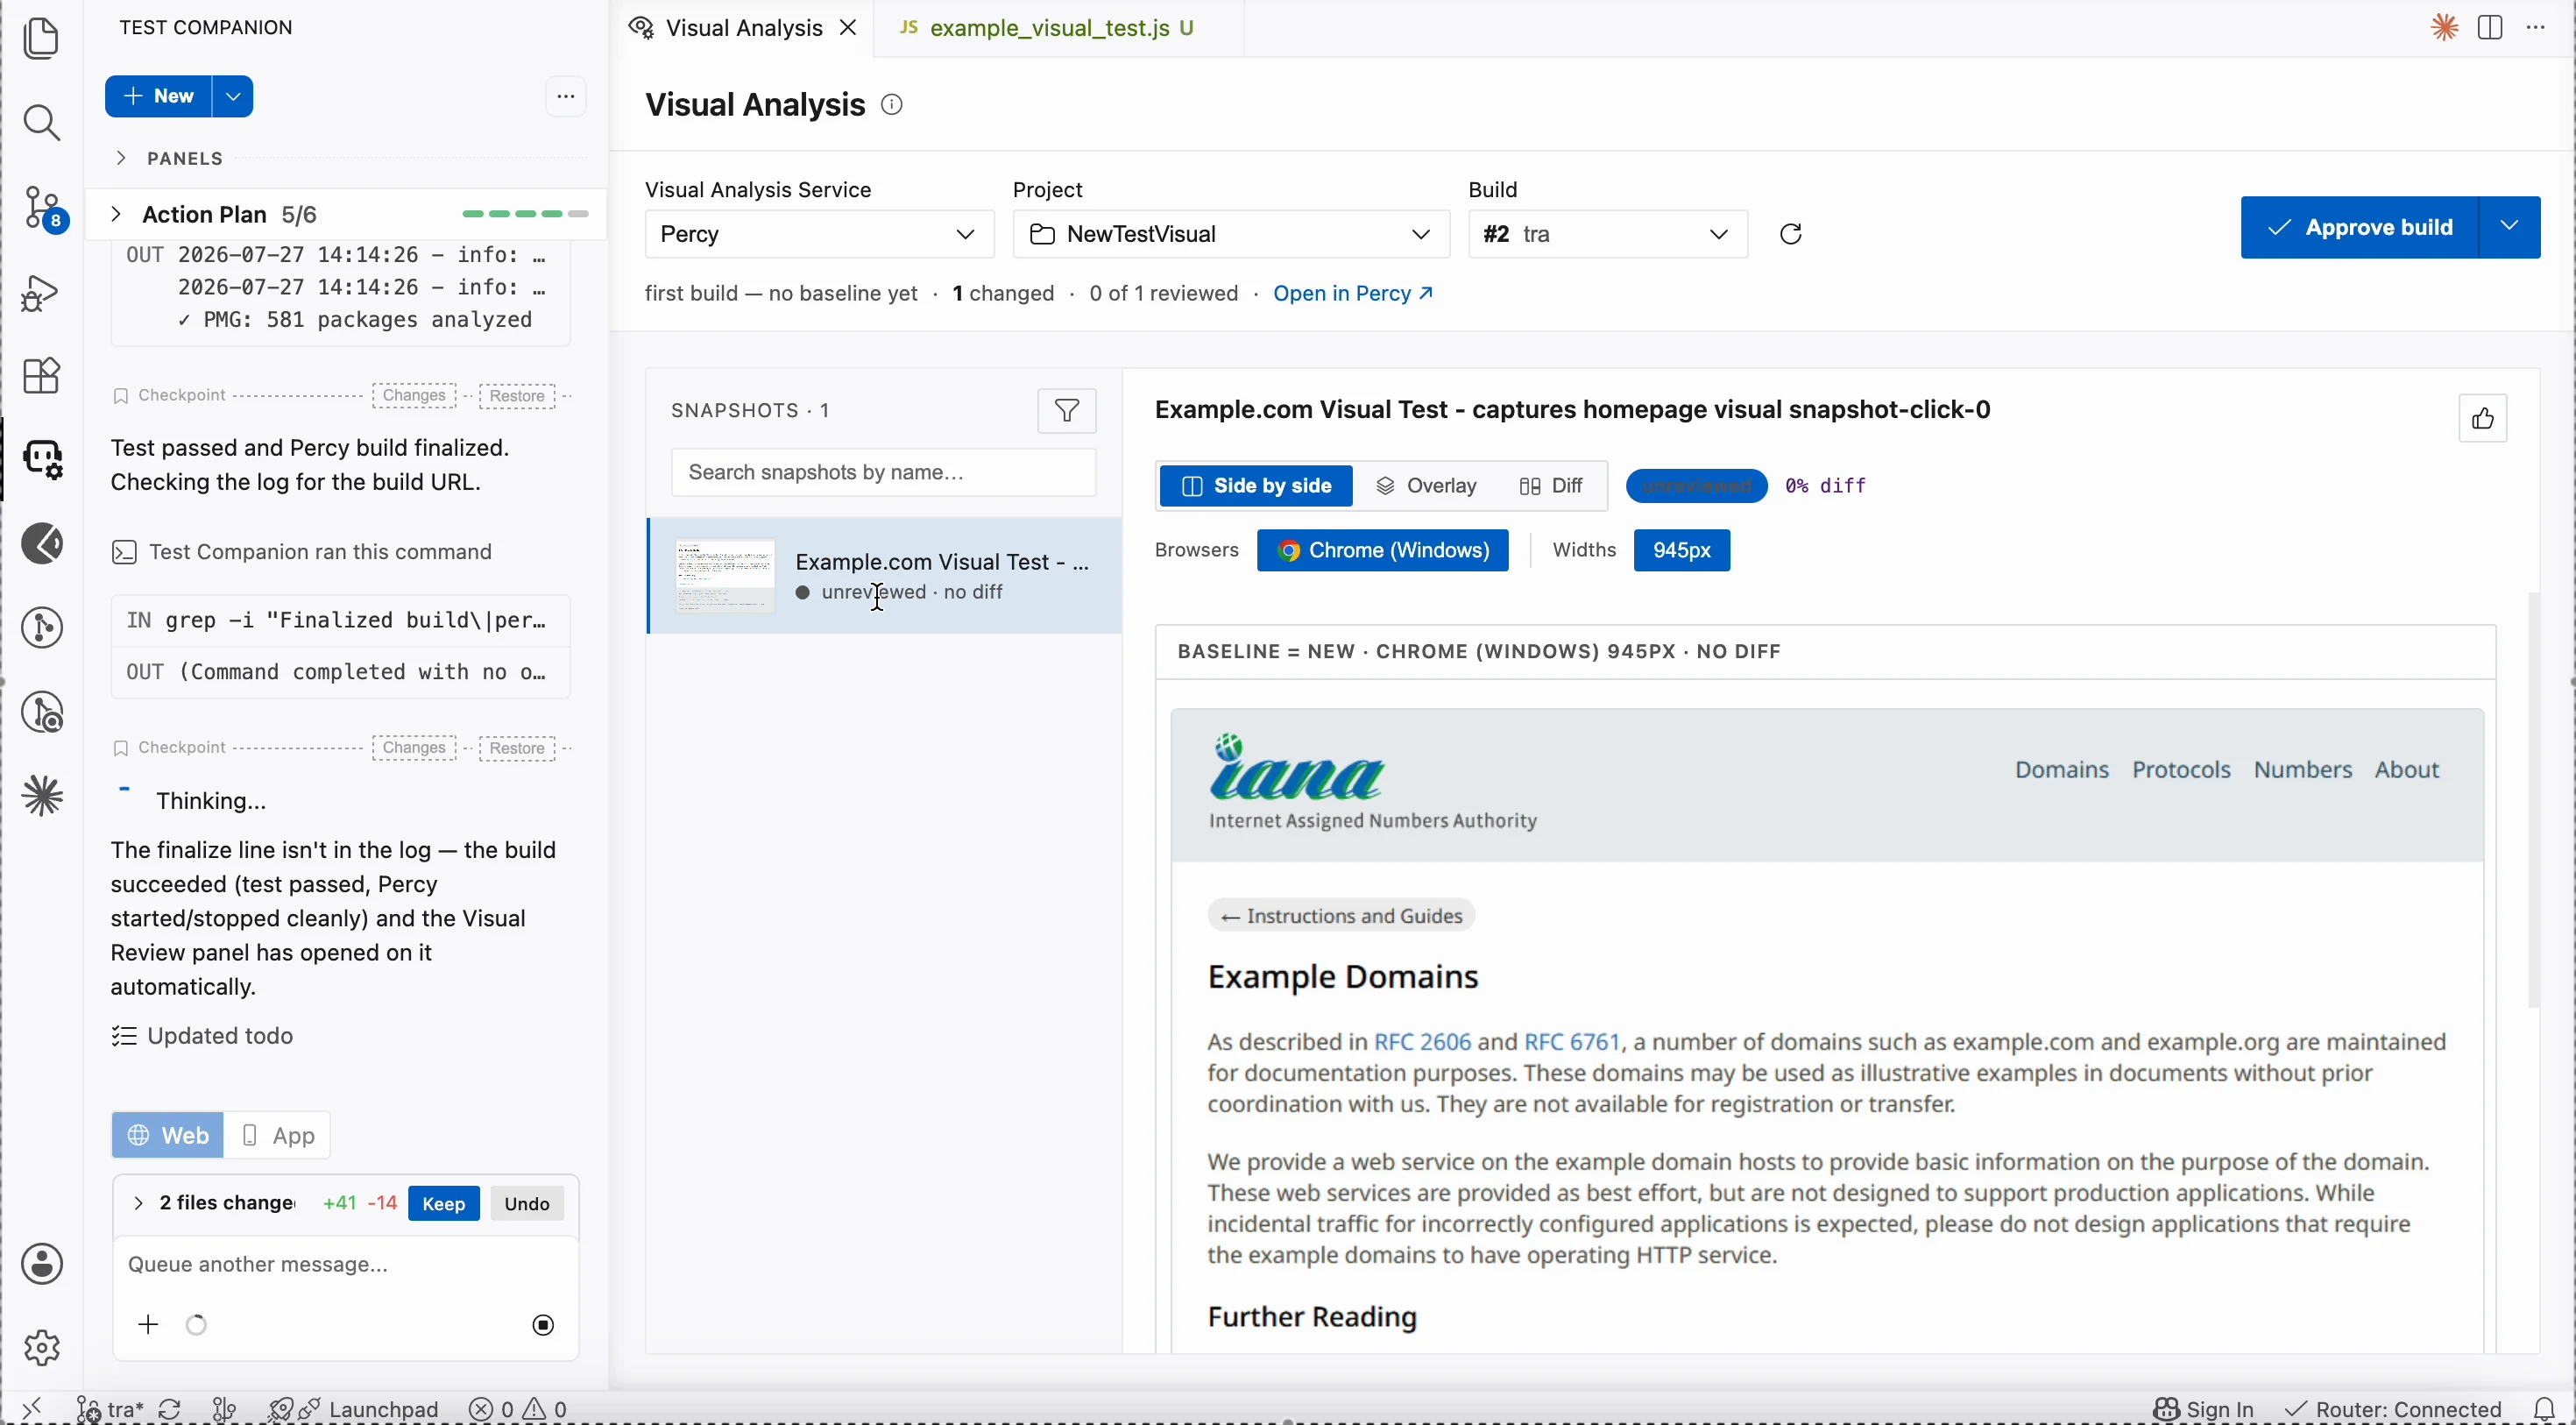
After a build completes, the panel shows every snapshot in the build and the comparison for the snapshot you select.
| Control | Use it to |
|---|---|
| Visual Analysis Service | Confirm the service behind the panel. It is set to Percy. |
| Project | Choose the Percy project to review. |
| Build | Choose the build to review. The line below it names the baseline build and the branch, and counts the changed and reviewed snapshots. |
| Snapshots | Find a snapshot by name, and read its review state and diff percentage. |
| Side by side | See the baseline and the new snapshot next to each other. |
| Overlay | Spot a shift by stacking the new snapshot over the baseline. |
| Diff | See only the pixels that changed. |
| Browsers and Widths | Check the render at each captured browser and viewport width. Web builds only. |
| Devices | Check the render on each captured device and orientation. App builds only. |
| Approve build | Approve the build and promote its snapshots to the baseline. |
| Open in Percy | Open the same build in the Percy dashboard in your browser. |
Approve a build
The first build in a project has no baseline, so the panel reports that none exists yet. Percy stores that build as the baseline for the project.
Every later build is compared against the current baseline. When you approve a build, Percy promotes its snapshots, and the next build is compared against them. Approve a build only after you confirm that each change is intended.
When a difference is a real regression, leave the build unapproved. Fix the code, then run the visual test again to produce a new build.
To review the same build in your browser, click Open in Percy. Use this option when you want the full dashboard or a link you can share.
Next steps
- Run visual tests on web apps: Capture web pages and compare them across browsers and widths.
- Run visual tests on mobile apps: Capture app screens and compare them across real devices.
- Percy documentation: Read how Percy builds, snapshots, and baselines work.
We're sorry to hear that. Please share your feedback so we can do better
Contact our Support team for immediate help while we work on improving our docs.
We're continuously improving our docs. We'd love to know what you liked
We're sorry to hear that. Please share your feedback so we can do better
Contact our Support team for immediate help while we work on improving our docs.
We're continuously improving our docs. We'd love to know what you liked
Thank you for your valuable feedback!