Automation coverage widget
Learn how the Automation Coverage widget helps you monitor and improve your test automation efforts through visualization.
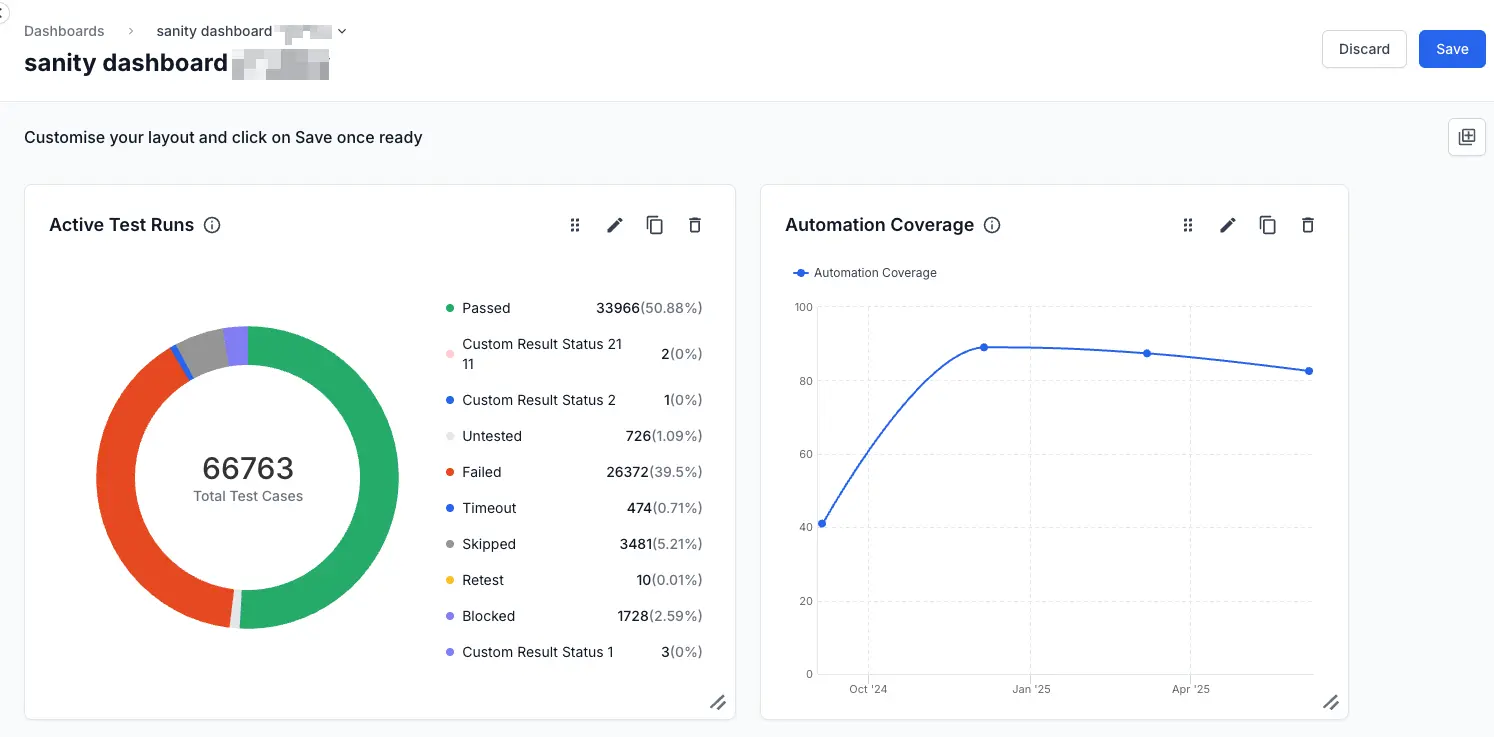
Use the Automation Coverage widget to track how much of your test suite is automated over time. The widget visualizes the percentage of automated tests and lets you segment results by common test properties such as project, folder, type, state, owner, tags, or custom fields. You can view a trend line or a compact table to spot growth or stagnation in your automation program. Depending on the visualization you have selected in the widget, you will see a line chart or a table.
Key metric information and visualization
This widget shows simple numeric metrics that provide the following quick insights into your test status.
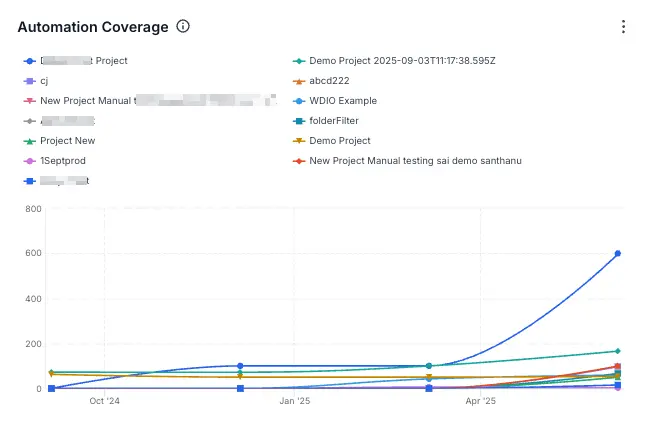
- Coverage trend over time as a line chart.
- Breakdowns by segments such as Project or Folder.
- Tabular view of the same metric for quick scanning and sorting.
- Scoped views using filters that stack on top of any global or dashboard-level filters already in use.
Metrics
You can switch between line chart and table at any time.
Line chart
With line chart you can:
- Plot Automation Coverage over time for each segment.
- Hover to see exact percentages for the selected date.
- Refine filters if the series count exceeds this limit. The legend lists up to 20 series.
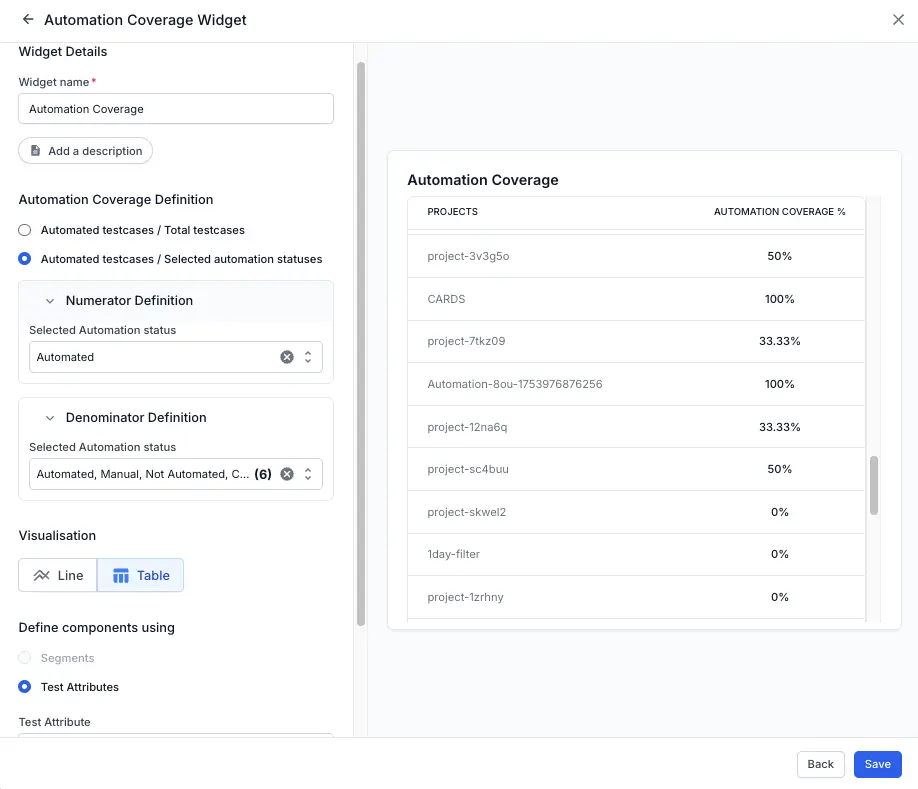
Table
With table you can:
- Lists each segment with its Automation Coverage percentage.
- Include the counts for Automated tests and the chosen Denominator based on the formula.
How coverage is calculated
Coverage is always expressed as a percentage.
Automation Coverage = (Automated tests/Denominator) × 100
Choose one formula:
- Automated tests / Total tests: Uses all tests in scope as the denominator.
- Automated tests / Selected tests: Uses only tests with the Automation status values you select as the denominator.
Automation status options
You can use Automated, Not automated, Cannot be automated, Obsolete, Automation not required, and any custom statuses. When you use Selected tests, the statuses you pick define the denominator and are applied consistently to all segments, test attributes, and filters.
Add the widget
-
Navigate to your project dashboard and select Add widget icon.
- Select Automation Coverage.
-
Enter widget name and an optional description.
- In Automation Coverage Definition, choose either:
- Automated tests / Total tests, or
- Automated tests / Selected tests, then pick one or more Automation status values.
- Choose a Visualization: Either Line chart or Table.
- Configure Define components: Either use Segments or Test Attribute.
- Select Confirm to add the widget.
Available filters
Apply the following filters to narrow down to specific test runs based on your criteria.
| Filter | Description |
|---|---|
| Test Case Tags | Filter tests using specific labels or tags. |
| Test Case Priority | Focus on test cases with specific priority levels. |
| Test Case Status | Filter test cases by their current status, such as passed, failed or blocked tests etc. |
| Test Case Owner | Show test cases by the responsible team member/owner. |
| Automation Status | Filter by automated or manual test cases. |
To apply filters, click Add filter dropdown and select the applicable filters.
Use cases and actionable insights
Regularly checking these metrics helps keep your testing processes efficient and focused.
| Insight | Action |
|---|---|
| Quickly grasp test completion and issue status. | Take immediate action if failure counts increase or test coverage decreases. |
Interpreting test data
- If coverage is flat or falling, review new manual tests and create an automation backlog for the highest-impact segments.
- If one segment lags, address its blockers or reallocate effort.
- Fix data hygiene issues first if counts or statuses look inconsistent.
We're sorry to hear that. Please share your feedback so we can do better
Contact our Support team for immediate help while we work on improving our docs.
We're continuously improving our docs. We'd love to know what you liked
We're sorry to hear that. Please share your feedback so we can do better
Contact our Support team for immediate help while we work on improving our docs.
We're continuously improving our docs. We'd love to know what you liked
Thank you for your valuable feedback!