
 Join our Discord
Test cases breakdown
See how your test cases are distributed across a property you choose, such as project, priority, owner, or automation status.
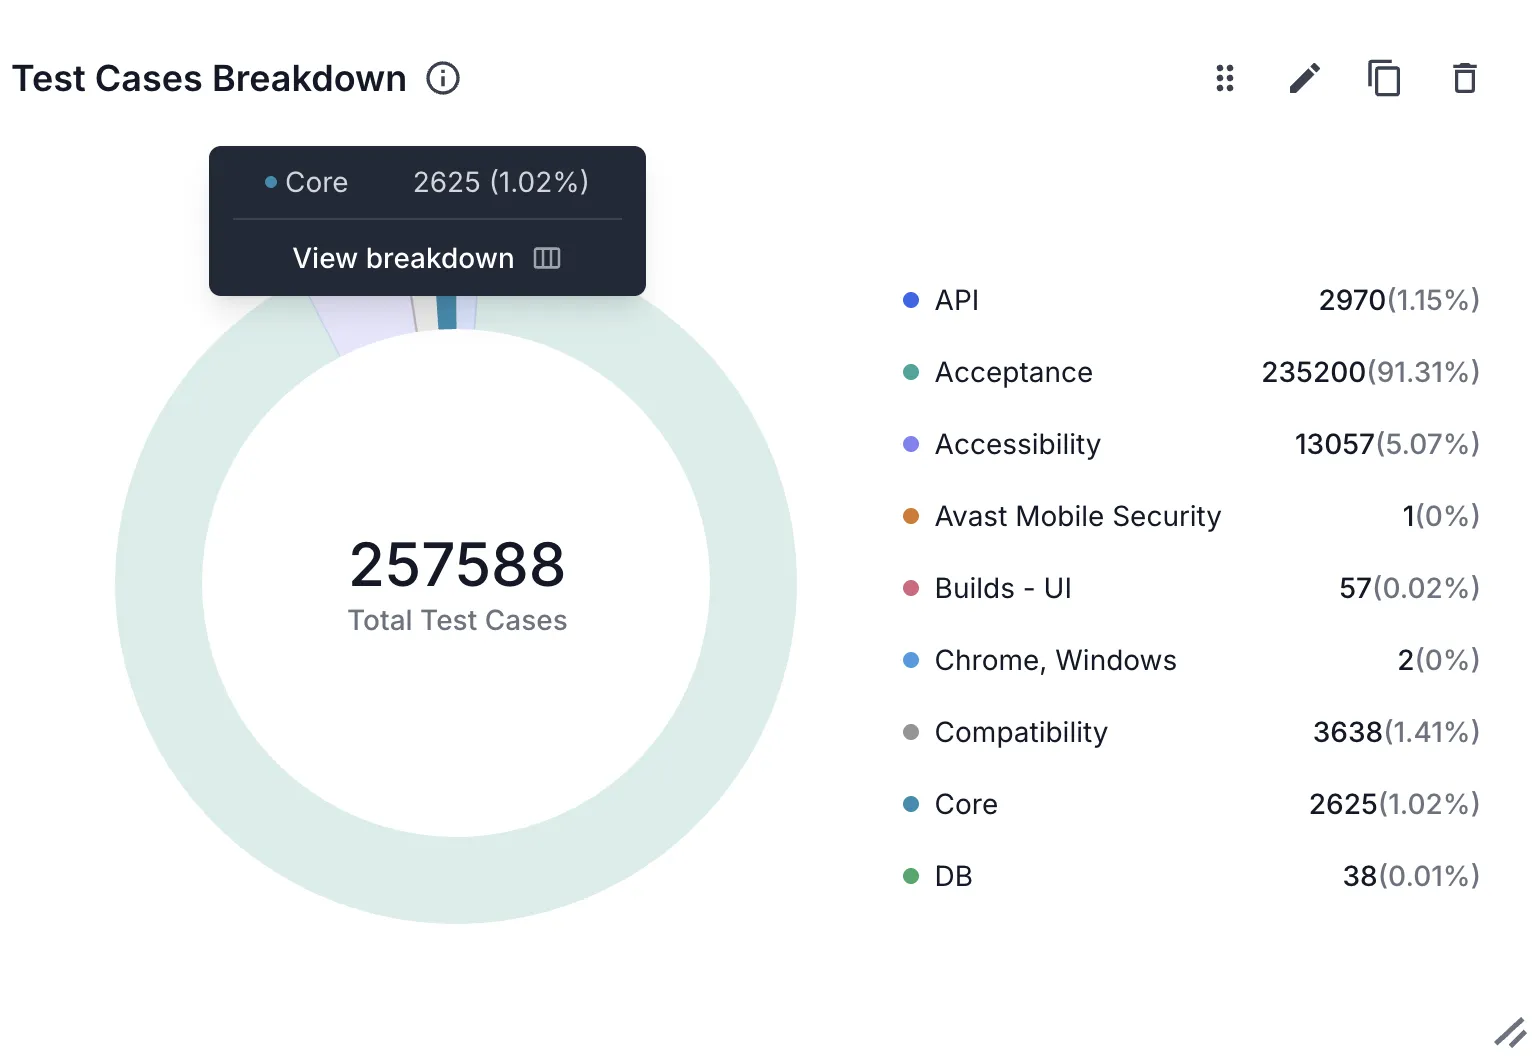
The test cases breakdown widget shows the composition of your test case library as a donut chart. You pick one property to group the cases by. Each segment is one value of that property. Because the widget counts every test case in scope, the chart answers what your library holds rather than how a single run performed. The count is all-time.
You can add this widget to a custom dashboard in Test Management or Test Reporting & Analytics, and to the project insights dashboard of a single project. The breakdown options are the same everywhere.
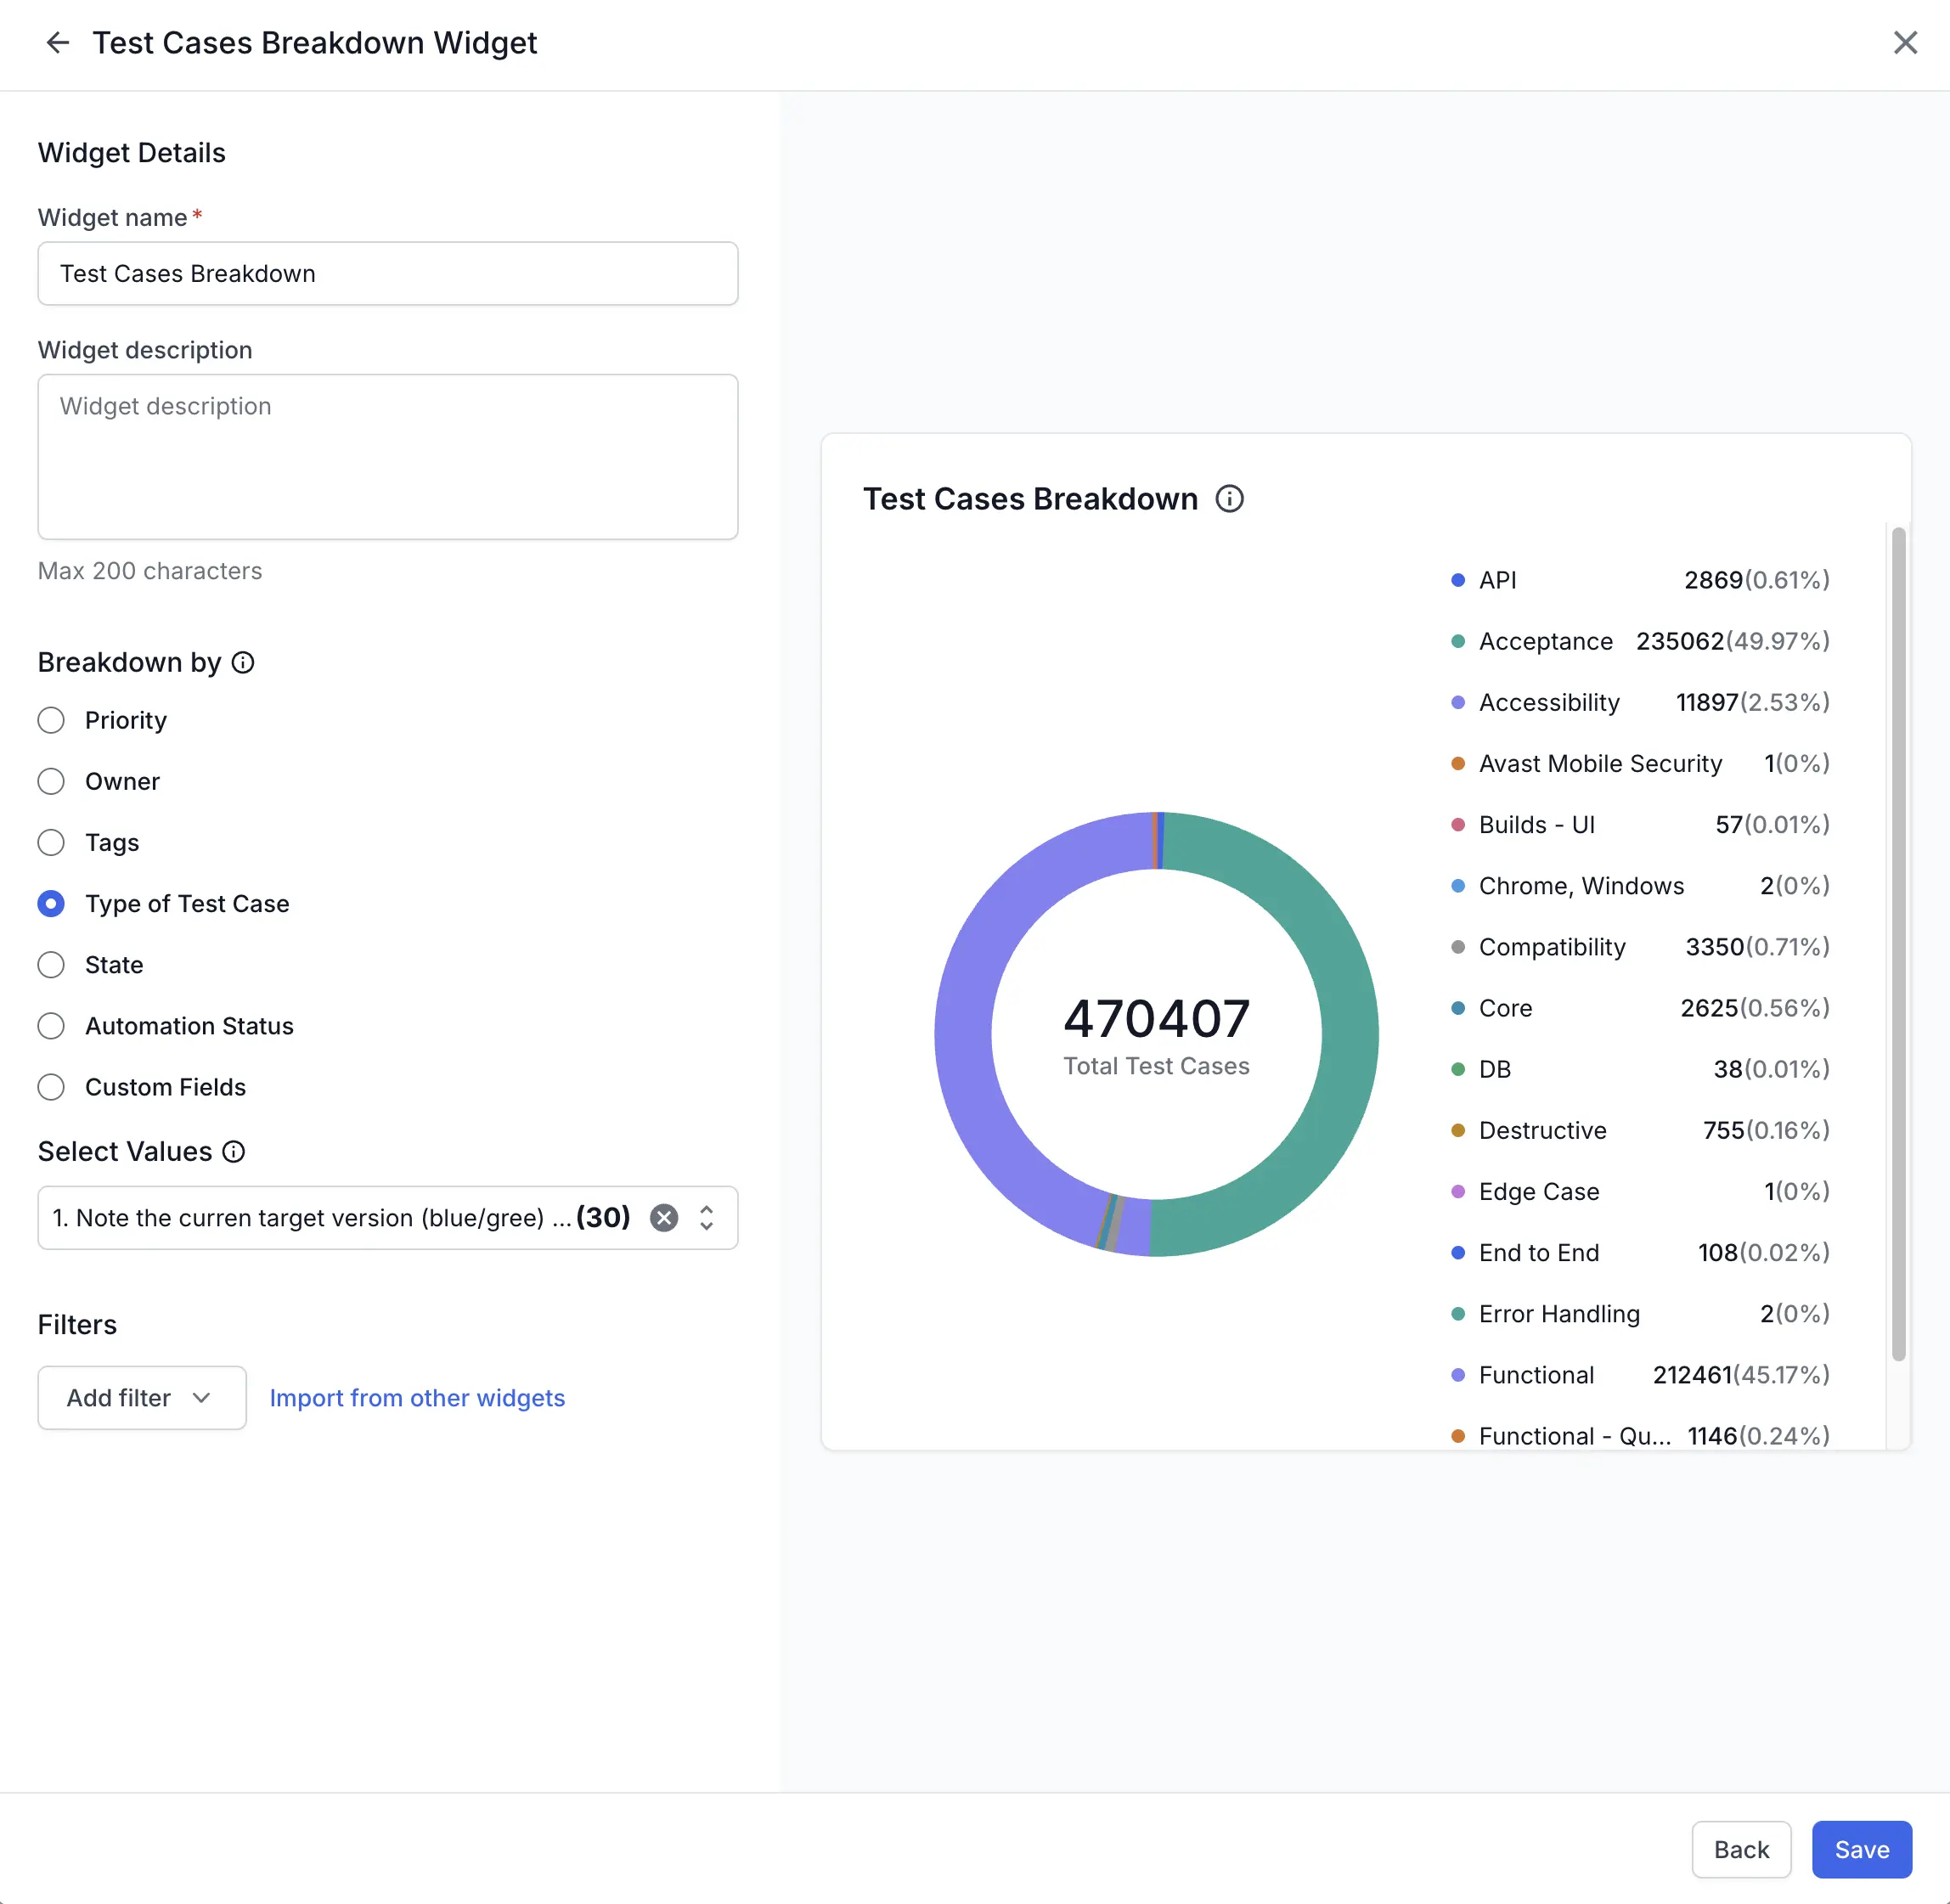
Key metric information and visualization
The number at the center of the chart is the total count of test cases that match your filters. This count appears as Total Test Cases. The legend lists every value with its count and its share of that total. Each segment’s size reflects its count.
Hover over any segment to read its value, count, and percentage in a tooltip.
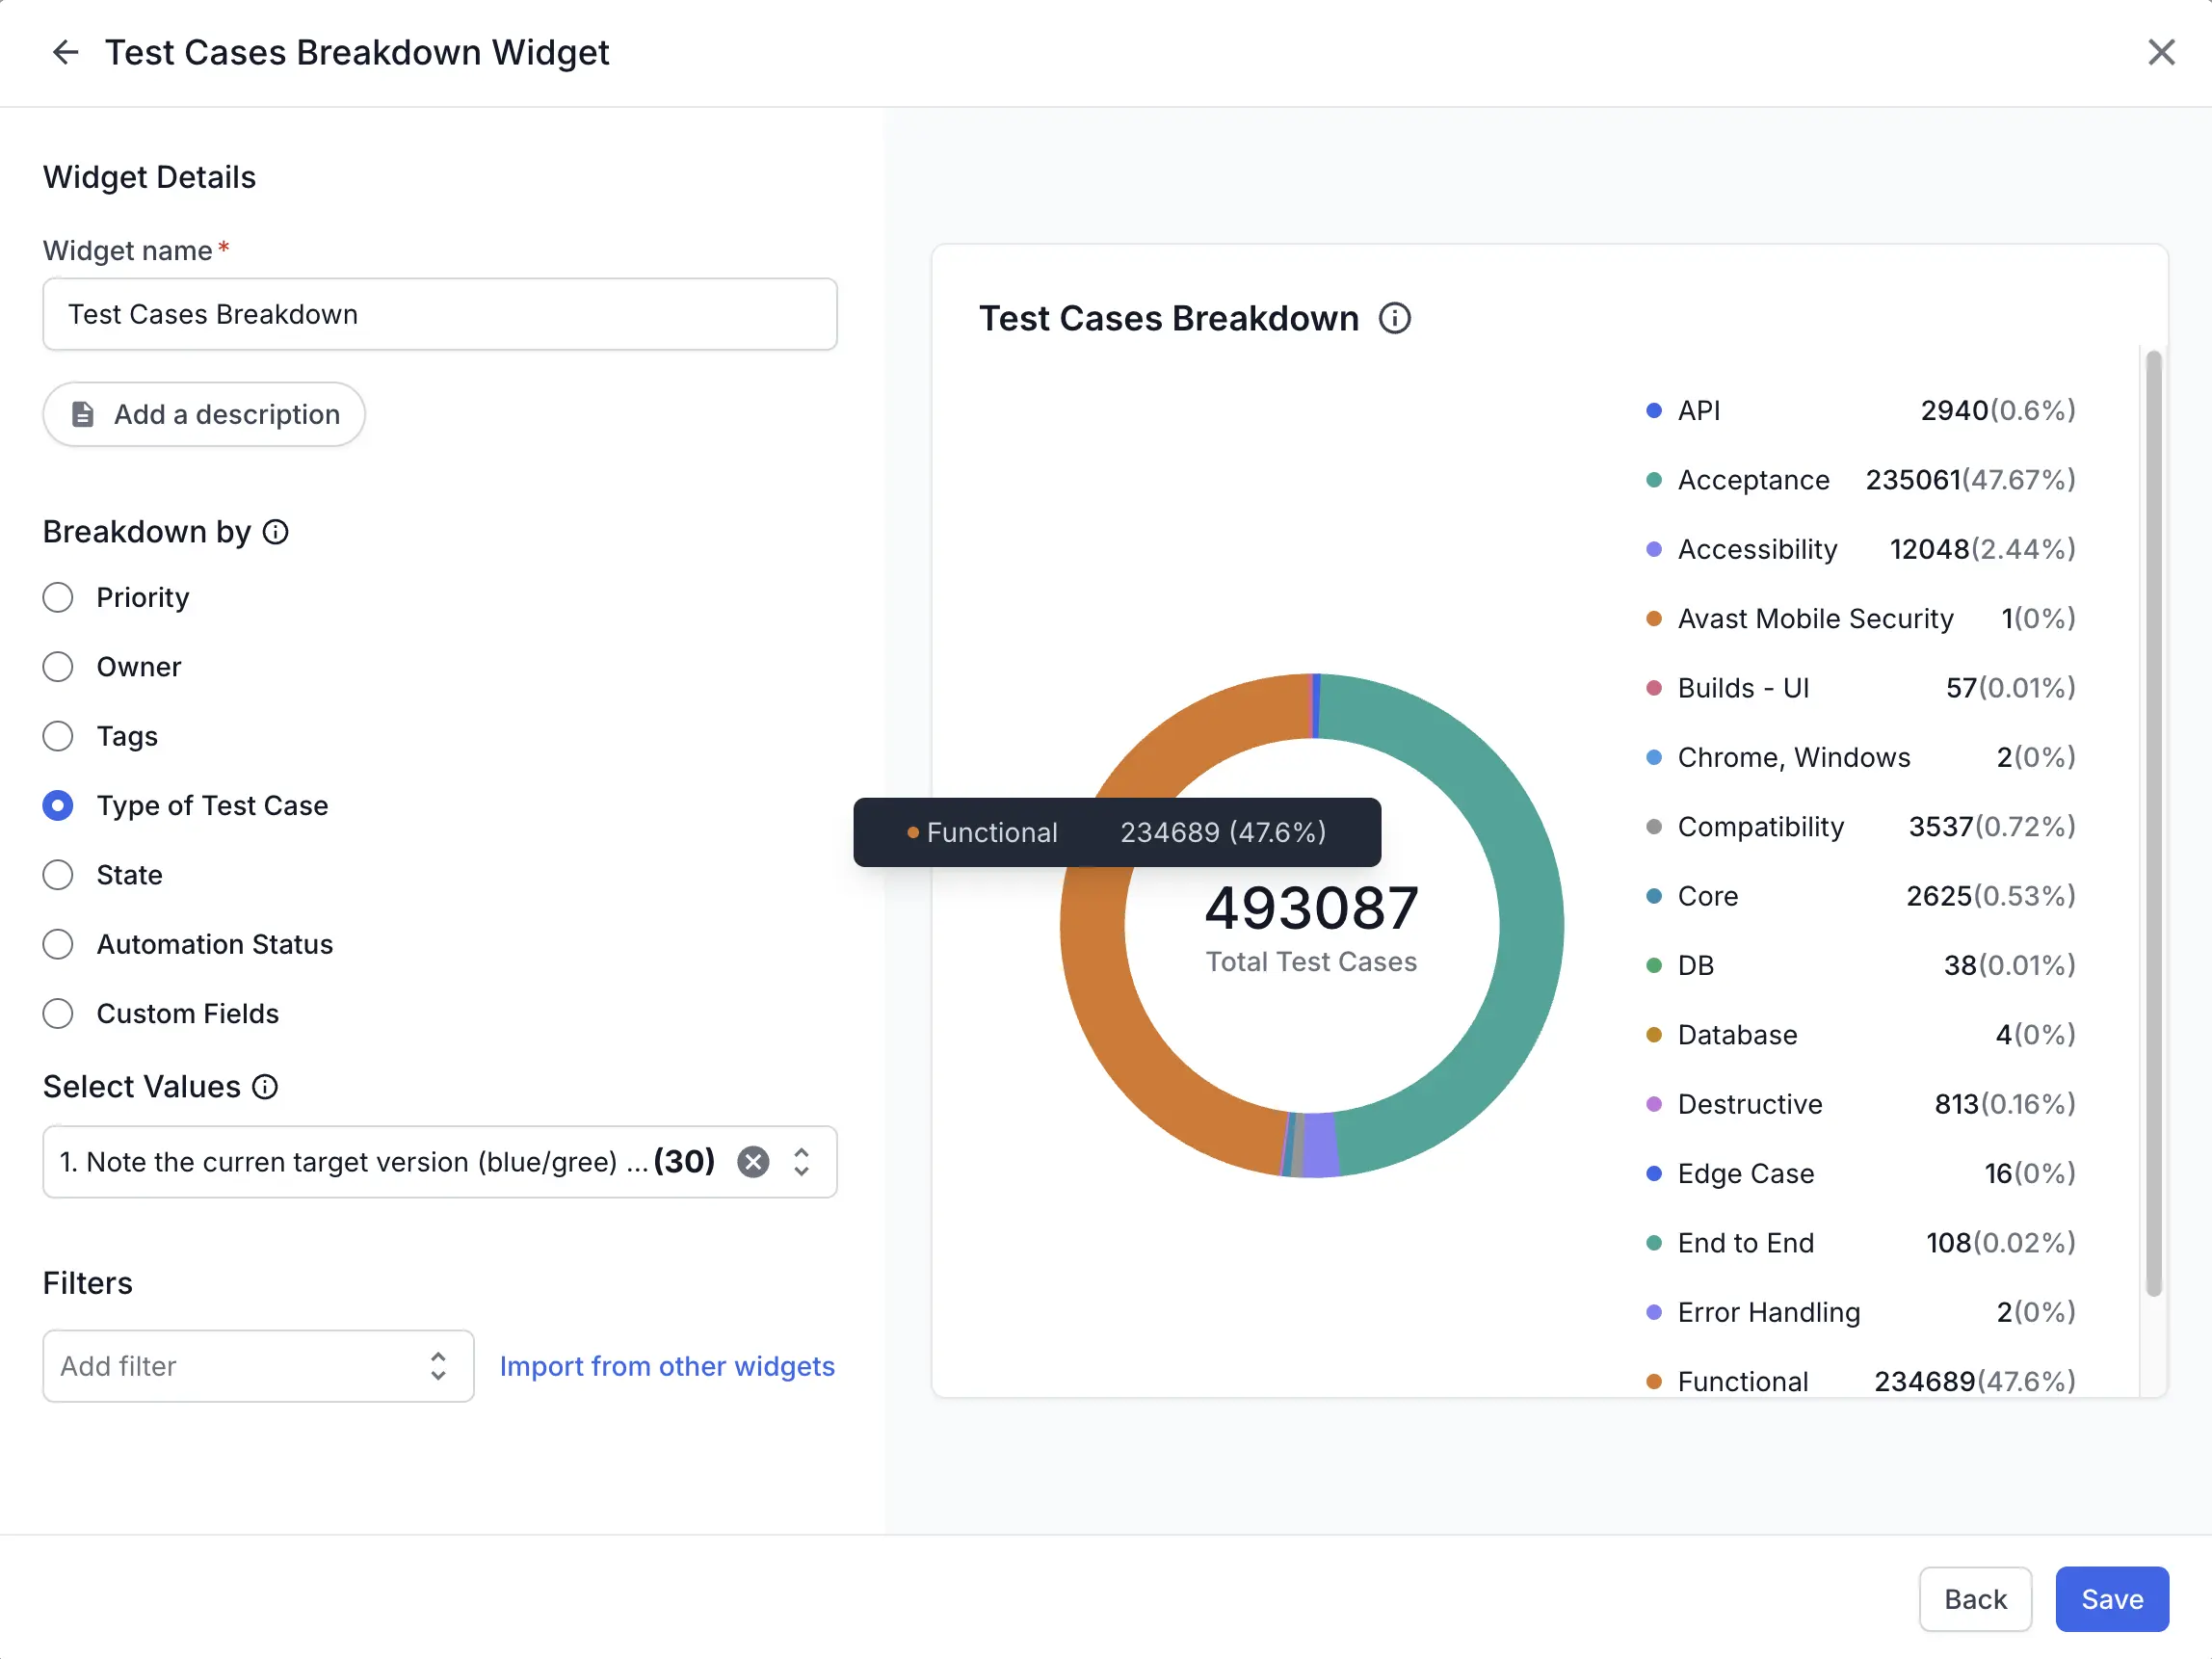
Widget configuration
Breakdown by and Select Values set what the widget counts and how it groups those counts. A third control, Filters, narrows the test cases counted. See Available filters.
Breakdown by
Breakdown by sets the property that defines the segments. Choose one of the following:
| Breakdown type | Segments |
|---|---|
| Priority | One segment per priority level assigned to your test cases. |
| Owner | One segment per user who owns test cases. |
| Tags | One segment per test case tag. |
| Type of Test Case | One segment per test case type defined in your workspace. |
| State | One segment per test case state. |
| Automation Status | One segment per automation status, such as Automated or Not automated. |
| Custom Fields | One segment per value of the single custom field you select. |
| Project | One segment per project. |
Select values
Select Values controls which values appear as segments. You can chart up to 20 values at a time:
- When a property has more than 20 values, the widget preselects the first 20. For Project, these are the most recently active projects.
- Start typing in the field to filter the list, then adjust the selection to chart the values you care about.
- After you select 20 values, the picker stops accepting more.
A widget saved before this limit can hold more than 20 values, so that widget keeps working unchanged until you edit it. A message about the 20-value limit then appears. You cannot save until you reduce the selection to 20 or fewer.
When Breakdown by is Custom Fields, the widget charts one custom field at a time. An additional Select fields dropdown appears, where you pick the field by name. Select Values then lists the values of the field you picked.
Available filters
Apply the following filters to narrow the test cases counted:
| Filter | Details |
|---|---|
| Projects | Count test cases from the projects you select. |
| Folders | Count test cases from the folders you select. |
| Test Case Types | Count test cases of the types you select, such as Functional or API. |
| Test Case Tags | Count test cases that carry the tags you select. |
| Test Case Priority | Count test cases with the priority levels you select. |
| Test Case State | Count test cases in the states you select. |
| Test Case Owner | Count test cases owned by the users you select. |
| Automation Status | Count test cases with the automation statuses you select. |
| Failure Categories | Count test cases mapped to the failure categories you select, such as Product Bug or Environment Issue. |
The list also includes every custom field defined in your workspace. The list omits the property you selected in Breakdown by.
To apply filters, click the Add filter dropdown and select the applicable filters. To reuse the filters already set on another widget, click Import from other widgets.
Break down test cases by a property
The following steps are the same for every breakdown type. This example breaks down test cases by project. Each segment is one project. You can compare library size across projects in one chart instead of opening each project in turn. To chart a different property, select that property in step 2 instead.
-
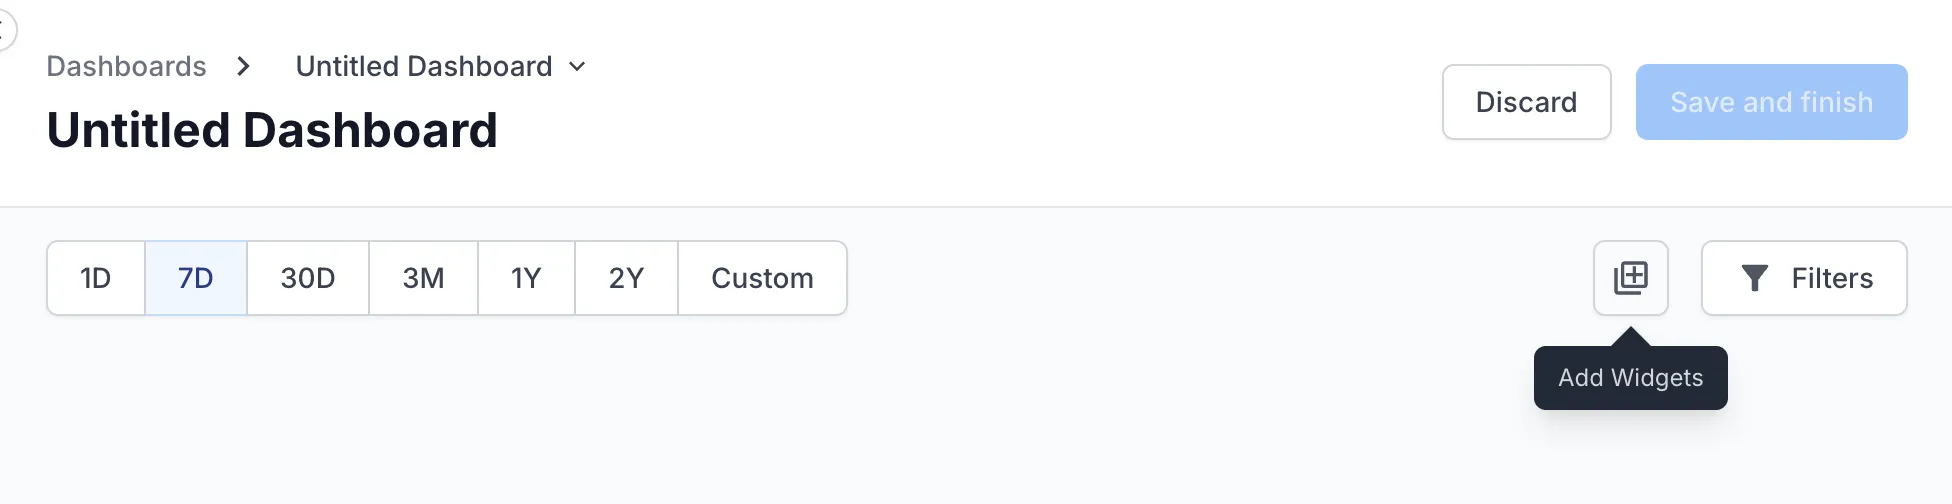
On your dashboard, click the Add Widgets icon and select Test Cases Breakdown.
-
In Breakdown by, select the property you want to group the test cases by. This example uses Project.
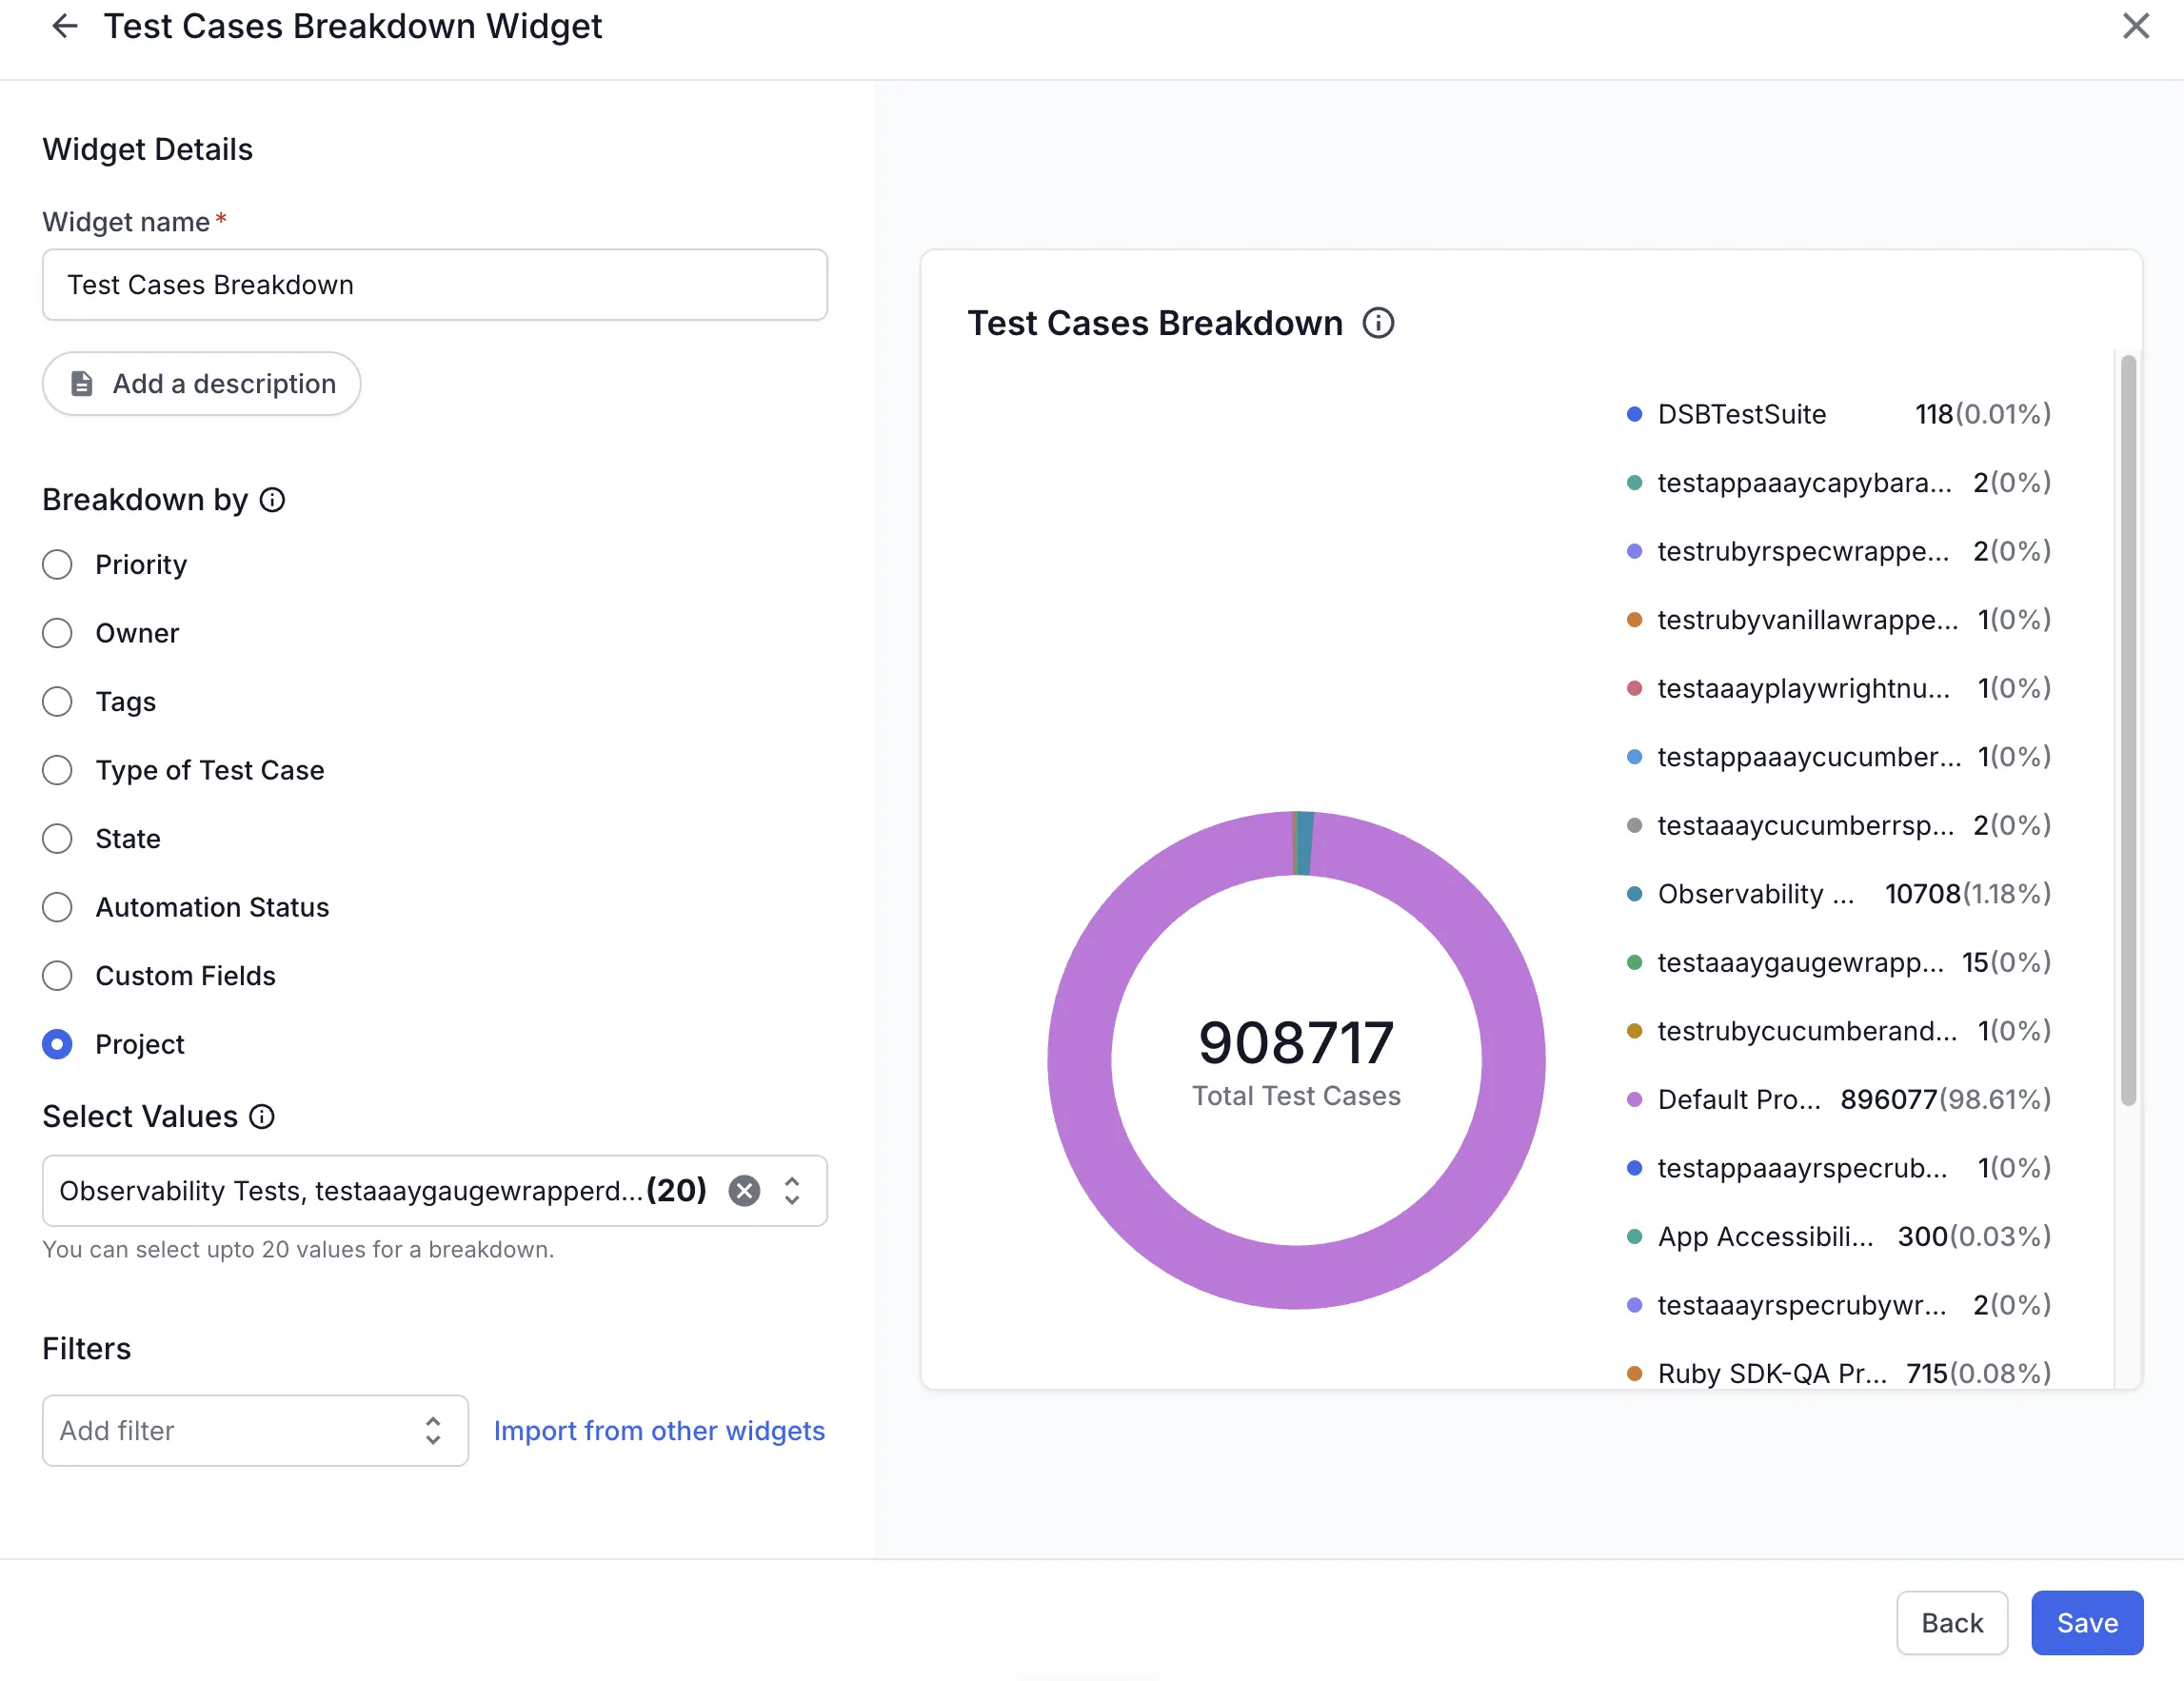
- In Select Values, keep the preselected values or choose the ones you want to compare.
- In Filters, add filters to narrow the test cases counted, or leave the field empty.
- Click Save.
On the project insights dashboard of a single project, a project breakdown returns one segment because that dashboard covers only one project. Add the widget to a dashboard that spans projects when you want to compare projects.
Drill down to test cases
You can open the test cases behind any segment, for any property you chart.
- Click a segment in the chart.
-
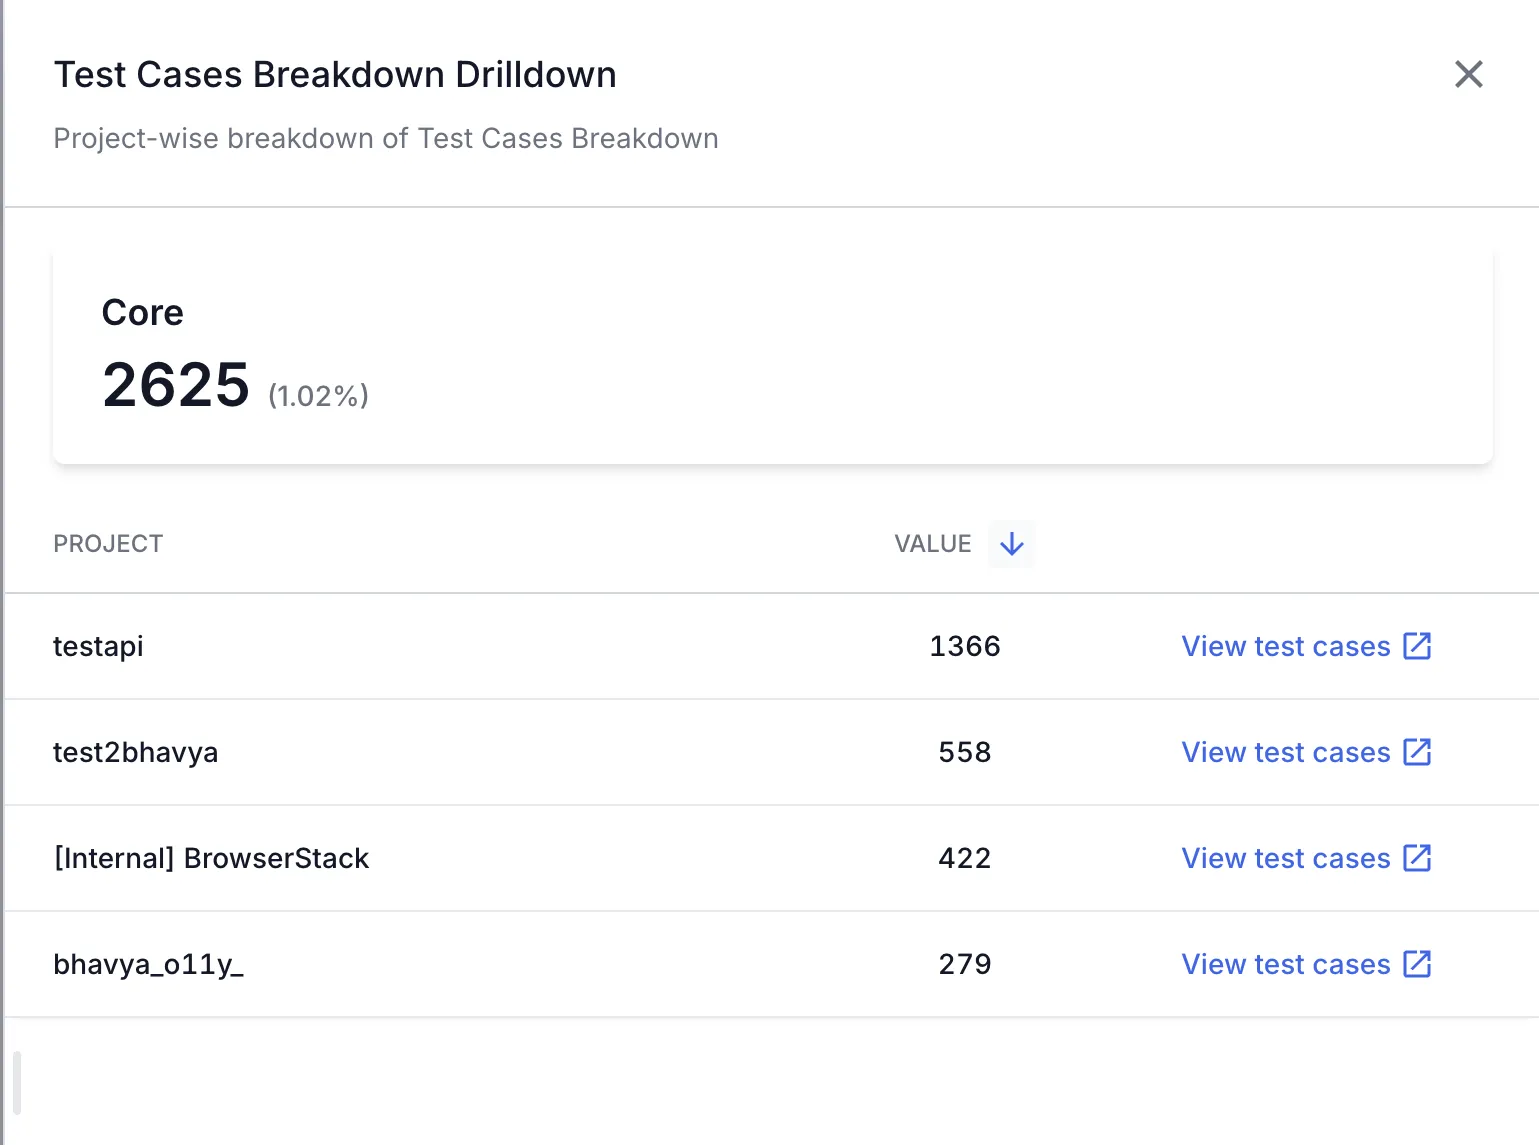
Click View breakdown. The Test Cases Breakdown Drilldown pane opens with a table of counts by project.
-
Click View test cases in any row to open the test cases counted in that row.
Use cases and actionable insights
Use the chart to spot gaps in your library and act on them:
| Insight | Action |
|---|---|
| One project holds most of your test cases. | Consider splitting that project, or check whether the smaller projects need more test cases. |
| A project you expect to be active shows a low count. | Open the drill-down and click View test cases to see which test cases the project already has, then plan the coverage it lacks. |
| Most test cases sit at a single priority level. | Rebalance priorities so that the critical paths stand out from the rest. |
A large share of test cases carry the Not automated status. |
Pick the segments with the highest counts and add them to your automation backlog. |
Interpreting test data
The shape of the chart tells you as much as the numbers. Use the following patterns to guide your analysis:
| Pattern | Cause | Action |
|---|---|---|
| One segment fills most of the chart. | That value holds the bulk of your library, or the remaining values are new. | Filter down to that value, then break the widget down by owner or type of test case to see what that value contains. |
| The chart shows exactly 20 segments. | The property has more than 20 values, so the widget charts the first 20 it preselects. | Edit the widget and adjust Select Values to swap in the values you want to compare. |
Next steps
- Track how much of that library is automated with the automation coverage widget.
- Watch the library grow over time with the trend of test cases widget.
- Review the full set of Test Management-specific dashboard widgets.
We're sorry to hear that. Please share your feedback so we can do better
Contact our Support team for immediate help while we work on improving our docs.
We're continuously improving our docs. We'd love to know what you liked
We're sorry to hear that. Please share your feedback so we can do better
Contact our Support team for immediate help while we work on improving our docs.
We're continuously improving our docs. We'd love to know what you liked
Thank you for your valuable feedback!