Manage Exploratory Sessions
Learn how to manage exploratory sessions in BrowserStack Test Management.
Use the list view to monitor active and closed sessions across your project, read session log summaries at a glance, and understand session lifecycle states.
The list view
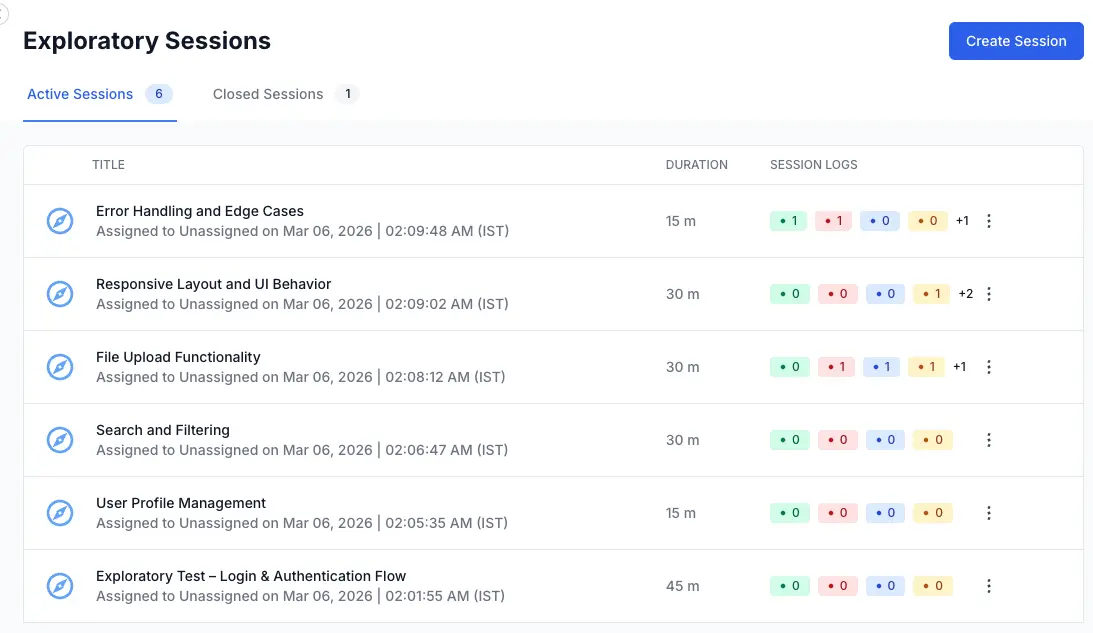
Click Exploratory Sessions in the left navigation panel to open the list view. This is the central hub for all session management. Every session in your project is accessible from here.
The list view is divided into two tabs:
-
Active Sessions (the default tab) displays all sessions that are in the Yet to start or In Progress state. A count badge on the tab shows the total number of active sessions. This is your working view during active testing cycles.
-
Closed Sessions displays all sessions that have been finalized. Closed sessions are read-only records. They retain all log entries, linked issues, and metadata, but you cannot modify anything.
List columns
Each session entry in the list displays the following information:
| Column | Description |
|---|---|
| Title | Defines session name and the assigned tester, along with the creation date and time. Click the title to open the session. |
| Duration | Defines the total elapsed time recorded for the session. Shows “–” if no time has been recorded yet. |
| Session Logs | Defines color-coded count badges summarizing the log entries by status. See “Session log counts” below. |
| Actions | Defines a three-dot menu (⋮) providing access to Edit Session, Close Session, and Delete. |
Session log counts
The Session Logs column shows four color-coded badges in a fixed order. Each badge displays a number representing the count of log entries with that status.
- Green represents Pass entries.
- Red represents Fail entries.
- Blue represents Note and Blocked entries (combined).
- Orange represents Bug entries.
The Session Logs badges show the number of passes, fails, notes or blocked entries, and bugs for that session. This allows you to assess session outcomes without opening the session. A row dominated by red and orange badges signals a session that uncovered significant issues.

Session lifecycle states
An exploratory session moves through three states. Transitions are one-directional: a session moves forward through the lifecycle and cannot move backward.
Yet to start
This is the initial state after creation. The session has no log entries, the elapsed-time counter shows 00:00:00, and an informational banner on the session page explains the exploratory testing model.
A Yet to start session is fully editable. You can update metadata, link requirements, and prepare the session for execution. The session appears in the Active Sessions tab.
In Progress
The session enters this state automatically when you add the first log entry. There is no manual “start” action required. The status badge in the session header changes from Yet to start to In Progress.
An In Progress session is fully editable. You can continue adding log entries, linking defects, updating metadata, and adjusting the timebox. The session remains in the Active Sessions tab.
Closed
The session enters this state when you explicitly close it via the three-dot menu or the session page. The session becomes read-only and moves to the Closed Sessions tab. You cannot add or modify log entries, change metadata, or update linked issues.
Closing is irreversible. You cannot reopen a closed session. For full details on the closing process and its consequences, see Edit, close, and delete Exploratory Sessions documentation.
| State | Log entries | Metadata | Linked issues | Tab |
|---|---|---|---|---|
| Yet to start | Can add | Can edit | Can add/remove | Active Sessions |
| In Progress | Can add | Can edit | Can add/remove | Active Sessions |
| Closed | Read-only | Read-only | Read-only | Closed Sessions |
Closed sessions tab
Click the Closed Sessions tab to view finalized sessions. If no sessions have been closed yet, the tab shows an empty state: “No Closed Sessions. When you close any session, it will appear here.”
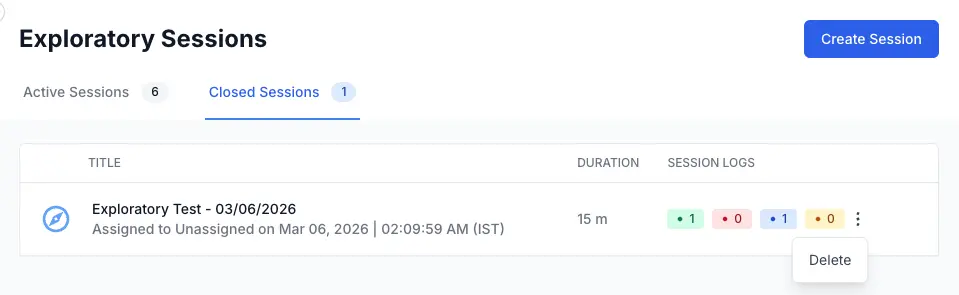
Closed sessions display the same columns as active sessions (Title, Duration, Session Logs, Actions). The only available action on a closed session is Delete. Clicking the session title opens it in a read-only view where you can review all log entries, linked issues, and metadata.
Exploratory Sessions are excluded from all existing Test Run Reports, Test Plan Reports, and Dashboard widgets. Session data does not appear in project-level analytics or aggregated metrics.
This is intentional. Exploratory Sessions produce a different data structure (a sequential log with mixed statuses) compared to Test Runs (pass/fail results per test case). Mixing the two would distort existing reporting baselines.
For now, the session log itself serves as the primary reporting artifact. If you need to share session outcomes with stakeholders, open the session and walk through the log timeline. The status bar at the top of the session gives a quick summary of findings by status type.
We're sorry to hear that. Please share your feedback so we can do better
Contact our Support team for immediate help while we work on improving our docs.
We're continuously improving our docs. We'd love to know what you liked
We're sorry to hear that. Please share your feedback so we can do better
Contact our Support team for immediate help while we work on improving our docs.
We're continuously improving our docs. We'd love to know what you liked
Thank you for your valuable feedback!